

ABSTRACT
Background: Identifying and addressing hotspots is a key element of imaginal exposure in Brief Eclectic Psychotherapy for PTSD (BEPP). Research shows that treatment effectiveness is associated with focusing on these hotspots and that hotspot frequency and characteristics may serve as indicators for treatment success.
Objective: This study aims to develop a model to automatically recognize hotspots based on text and speech features, which might be an efficient way to track patient progress and predict treatment efficacy.
Method: A multimodal supervised classification model was developed based on analog tape recordings and transcripts of imaginal exposure sessions of 10 successful and 10 non-successful treatment completers. Data mining and machine learning techniques were used to extract and select text (e.g. words and word combinations) and speech (e.g. speech rate, pauses between words) features that distinguish between ‘hotspot’ (N = 37) and ‘non-hotspot’ (N = 45) phases during exposure sessions.
Results: The developed model resulted in a high training performance (mean F1-score of 0.76) but a low testing performance (mean F1-score = 0.52). This shows that the selected text and speech features could clearly distinguish between hotspots and non-hotspots in the current data set, but will probably not recognize hotspots from new input data very well.
Conclusions: In order to improve the recognition of new hotspots, the described methodology should be applied to a larger, higher quality (digitally recorded) data set. As such this study should be seen mainly as a proof of concept, demonstrating the possible application and contribution of automatic text and audio analysis to therapy process research in PTSD and mental health research in general.
KEYWORDS: Supervised classification, text mining, speech analysis, posttraumatic stress disorder, cognitive behavioural therapy, brief eclectic psychotherapy, hotspot
Antecedentes:La identificación y el abordaje de los puntos críticos (hotspots en inglés) es un elemento clave para exposición imaginaria en la Psicoterapia Ecléctica Breve para TEPT (BEPP por sus siglas en inglés). La investigación muestra que la efectividad del tratamiento se asocia con la focalización en estos puntos críticosy que la frecuencia y características de los puntos críticos podría servir de indicador para el éxito terapéutico.
Objetivo: Este estudio tiene como objetivo desarrollar un modelo para reconocer automáticamente los puntos críticos basados en características de texto y discurso, lo que podría ser una forma eficiente de seguir los progresos del paciente y predecir la eficacia del tratamiento.
Metodo: Se desarrolló un modelo de clasificación supervisada multimodal basado en grabaciones y transcripciones de cintas analógicas de sesiones de exposición imaginaria de diez de tratamiento exitosos y diez no exitosos. Se usaron técnicas de minería de datos y técnicas de aprendizaje automático para extraer y seleccionar las características de texto (ej., palabras y combinaciones de palabras) y discurso (ej., velocidad del discurso, pausas entre las palabras) que distinguen entre las fases de ‘puntos críticos’ (N= 37) y ‘ puntos no críticos’ (N= 45) durante las sesiones de exposición.
Resultados: El modelo desarrollado resultó en un alto rendimiento de entrenamiento (puntaje F1 promedio de 0.76) pero un bajo rendimiento de prueba (puntaje F1 promedio = 0.52). Esto muestra que las características de los textos y discursos seleccionados podrían distinguir claramente entre puntos críticos y puntos no críticos en el conjunto de datos actual, pero probablemente no reconocerá muy bien los puntos críticos de nuevos datos de entrada.
Conclusiones: Para mejorar el reconocimiento de nuevos puntos críticos, la metodología descrita debería ser aplicada a un conjunto de datos más grande y de mejor alta calidad (grabado digital). Como tal, este estudio debe verse principalmente como una prueba de concepto, demostrando la posible aplicación y contribución del análisis automático de texto y audio para la investigación del proceso terapéutico en TEPT e investigación en salud mental en general.
PALABRAS CLAVES: clasificación supervisada, minería de texto, análisis de discurso, trastorno de estrés postraumático, terapia cognitivo conductual, psicoterapia ecléctica breve, punto crítico
HIGHLIGHTS: • Hotspots during imaginal exposure can be automatically recognized.• Text and audio features were used for supervised classification.• A combined feature set resulted in highest model performance.• A larger data set might help to improve model generalizability.
背景:在PTSD的简短折衷心理疗法 (BEPP) 中, 识别和解决热点 (hotspot) 是想象暴露法的关键要素。研究表明, 治疗效果与关注这些热点有关, 并且热点频率和特征可以作为治疗成功的指标。
目标:本研究旨在开发一种基于文本和语音特征来自动识别热点的模型, 这可能是追踪患者进展和预测治疗效果的有效方法。
方法:基于对十个成功和十个不成功治疗完成者的想象暴露会话的模拟磁带录音和笔录, 建立了多模式监督分类模型。数据挖掘和机器学习技术用于在暴露会话中提取和选择区分‘热点’ (N = 37) 和‘非热点’ (N = 45) 阶段的文本 (例如单词和单词组合) 和语音 (例如语速, 单词间的停顿) 。
结果:开发的模型训练成绩很高 (平均F1得分为0.76), 但测试性能较低 (平均F1得分为0.52) 。这表明所选的文本和语音特征可以清楚地区分此数据集的热点和非热点, 但可能无法很好地识别新输入数据中的热点。
结论:为了提高对新热点的识别, 应将所描述的方法应用于更大, 更高质量 (数字记录) 的数据集。因此, 本研究应主要被视为概念的证明, 证明自动文本和音频分析在PTSD的治疗过程研究和一般心理健康研究中可能的应用和贡献。
关键词: 监督分类, 文本挖掘, 语音分析, 创伤后应激障碍, 认知行为疗法, 简短折衷心理疗法, 热点
1. Introduction
Posttraumatic stress disorder (PTSD) is a mental health disorder that can develop after experiencing or witnessing a traumatic event (American Psychiatric Association, 2013). The lifetime prevalence rate of PTSD in the general population is 7.4% (De Vries & Olff, 2009; Kessler et al., 2017). Several effective treatments for PTSD exist (Bisson et al., 2019), examples of which are trauma-focused cognitive behavioural therapy (CBT; Ehlers & Clark, 2000) and eye movement desensitization and reprocessing (EMDR; Shapiro, 2001). Of all effective psychotherapies, one of the ingredients they have in common is exposure to trauma (Olff et al., in press; Schnyder et al., 2015). Despite its efficacy, there is still a considerable proportion of patients that does not (sufficiently) respond to this form of trauma-focused therapy. For example, in their meta-analysis of psychotherapy for PTSD, Bradley, Greene, Russ, Dutra, and Westen (2005) report mean improvement rates of 37.6% and 47.4%, among CBT intent-to-treat patients and treatment completers, respectively.
Grey, Young, and Holmes (2002) argue that the effectiveness of PTSD treatment can significantly improve by focusing on hotspots. This is in line with the results of Nijdam, Baas, Olff, and Gersons (2013), who showed that hotspots were more frequently addressed in successful than in non-successful treatments. Hotspots, the moments of traumatic experiences with the highest emotional impact, have been an important topic of research in the past decades. For example, Ehlers, Hackmann, and Michael (2004) and Ehlers, Clark, Hackmann, McManus, and Fennell (2005) found that imaginal exposure during trauma-focused CBT should focus on addressing and changing the meaning of hotspots as this could lead to greater PTSD symptom reduction. The importance of hotspots in psychotherapy was also highlighted in earlier studies that argued that hotspots need to be addressed to ensure habituation (Richards & Lovell, 1999) or to identify deeper meanings (Ehlers & Clark, 2000).
A form of trauma-focused CBT that focuses on the identification and addressing of hotspots is Brief Eclectic Psychotherapy for PTSD (BEPP; Gersons, Carlier, Lamberts, & Van Der Kolk, 2000). Through imaginal exposure, the patient is led slowly through the traumatic situation until the worst moment (the hotspot) is reached (Grey & Holmes, 2008). Hotspots are addressed by encouraging the patient to describe and remember the exact details of the most frightening or emotional moment, for example, by asking about sounds, smells, weather, or surroundings. By helping the patient to remember the details, cues to new aspects and details of the event can come to mind, enabling the patient to relive the situation as vividly as possible (Gersons, Meewisse, Nijdam, & Olff, 2011). When the hotspot is sufficiently covered, the trauma narrative can be continued until (over the course of several exposure sessions) all the hotspots have been addressed. The imaginal exposure phase is completed when all hotspots are addressed and the emotions associated with the traumatic event are levelled down sufficiently (Nijdam et al., 2013).
With regard to the content of hotspots, previous studies focused on the presence of emotions (Grey, Holmes, & Brewin, 2001; Grey et al., 2002) and cognitions (Grey & Holmes, 2008; Holmes, Grey, & Young, 2005), which showed that especially anxiety, helplessness, horror, anger, sadness, shame, and guilt frequently occurred in hotspots. In addition, Grey et al. (2002) found that hotspots are characterized by subtle textual changes, which may guide the therapist in the identification of emotional hotspots. An example of a study assessing textual differences within trauma narratives is that of Jelinek et al. (2010), who studied the organization and content of the ‘worst moments’ of traumatic memories by analysing the degree of disorganization, emotions, and speaking style. They found that these moments showed different characteristics with regard to the organization than the rest of the narrative.
To obtain a deeper knowledge and understanding of trauma treatment and specifically hotspots, more in-depth, large-scale analysis of treatment and hotspot content is required. Until now, treatment content has mainly been studied by manually coding the occurrence of a predefined set of characteristics within therapy session recordings or transcripts retrospectively. Due to the time-consuming nature of such analyses, most of these studies focus on one specific construct, such as text cohesion (Foa, Molnar, & Cashman, 1995), complexity (Amir, Stafford, Freshman, & Foa, 1998), or dissociation (Zoellner, Alvarez-Conrad, & Foa, 2002). It is suggested that future studies should focus on assessing the relationship between multiple constructs underlying traumatic narratives instead of studying every construct separately (Amir et al., 1998).
An effective way to study multiple constructs and variables at once is to analyse treatment sessions using automatic text and audio analyses. Text analysis is frequently used in PTSD research, as word use and linguistic features proved to be indicative of people’s mental, social, and sometimes physical state, and their defensive operations (Nelson & Horowitz, 2010; Pennebaker, Mehl, & Niederhoffer, 2003). Word counts have been used to study trauma narrative content in relation to PTSD symptom severity (e.g. Jelinek et al., 2010; Pennebaker, 1993) and insight in the linguistic elements present within trauma narratives could lead to improved PTSD treatment (Alvarez-Conrad, Zoellner, & Foa, 2001). For example, specific linguistic features such as cognitive processing words (Alvarez-Conrad et al., 2001; D’Andrea, Chiu, Casas, & Deldin, 2012; Pennebaker, Francis, & Booth, 2001), emotion words (Alvarez-Conrad et al., 2001; Pennebaker et al., 2001), words related to insight (Pennebaker et al., 2001), reflection (D’Andrea et al., 2012), causation (Boals & Klein, 2005), and affection and death (Alvarez-Conrad et al., 2001) have been used to predict improvements in post-treatment PTSD symptoms, perceived physical health, and personal functioning. Because mood and emotions are found to influence speaking behaviour and speech sound characteristics, audio signal analysis is regularly applied in psychiatric studies as well, for example, to predict recovery time in depression (Kuny & Stassen, 1993) or to recognize psychosis development in high-risk youths (Bedi et al., 2015).
Text and speech features can be used to identify and study specific concepts on a large scale, in a transparent and uniform fashion, over a long period of time. For the automatic recognition or prediction of pre-defined concepts, supervised classification is generally used. Supervised classification is a data mining application in which objects (e.g. texts or audio signals) are assigned to a set of predefined class labels using a classification model based on labelled training samples (Bird, Klein, & Loper, 2009). Supervised classification based on text features has been used, for example, to screen forum posts for PTSD (He, Veldkamp, & de Vries, 2012) or to predict treatment adherence for schizophrenia patients (Howes, Purver, McCabe, Healey, & Lavelle, 2012), whereas speech features have been used to classify distress in PTSD patients (Van Den Broek, Van Der Sluis, & Dijkstra, 2009). Though most studies use either text or audio analysis, Schuller, Villar, Rigoll, and Lang (2005) and Forbes-Riley and Litman (2004) found that models based on multimodal feature sets outperformed models based on either acoustic or linguistic features alone (e.g. in emotion classification), as multimodal sets provide a broader and more complete picture of one’s (emotional) state (Bhaskar, Sruthi, & Nedungadi, 2015).
This study aims to develop a multimodal supervised classification model to automatically recognize hotspots based on text and speech features extracted from tape recordings and transcripts of imaginal exposure sessions of successful and non-successful treatment completers. Automatic hotspot recognition can provide clinicians with insight in the occurrence and characteristics of hotspots during their treatments, which may assist them in offering a more effective intervention. We hypothesized that a combination of text and speech features extracted from patient speech could be used to develop a supervised classification model to automatically distinguish between hotspot and non-hotspot phases during imaginal exposure sessions. Based on the formal hotspot characteristics and previous research on hotspots and CBT sessions, we identified nine constructs (affect, emotions, cognitions, dissociation, avoidance, cohesion, organization, fragmentation, and complexity, further described in the Methods section) that we expected to differ between hotspots and non-hotspots. Each construct was operationalized through a number of text and speech characteristics that were captured using a large range of features extracted from CBT session transcripts and recordings.
2. Methods
2.1. Sample and data set
We used data of patients undergoing Brief Eclectic Psychotherapy for PTSD (BEPP; Gersons et al., 2000). To develop the hotspot classification model, an existing expert-annotated data set consisting of imaginal exposure session recordings was used in which hotspots and their characteristics were coded. This data set consisted of analog cassette tape recordings of 45 PTSD patients and was collected for a previous study by Nijdam et al. (2013), who investigated differences in hotspots between successful and unsuccessful BEPP trauma-focused psychotherapies. They analysed session recordings in which imaginal exposure was present for 20 of the 45 patients (the 10 most and the 10 least successful treatment completers). The sample consisted of twelve female and eight male adults with a mean age of 39.60 (SD = 10.98) and different ethnic backgrounds (mainly Dutch, N = 15, but also Indonesian, Surinamese, Aruban, and Bosnian). The types of trauma the patients experienced included assault (N = 13), disaster (N = 2), sexual assault (N = 1), accident (N = 1), war-related (N = 1), and other (N = 2).
Nijdam et al. (2013) coded the frequency of hotspots, their characteristics (interrater reliability K = 0.86), emotions (interrater reliability K = 0.81), and cognitions (interrater reliability K = 0.85) for 102 recordings based on the Hotspot Identification Manual, an adaptation of the Hotspots Manual of Holmes and Grey (2002), developed by Nijdam and colleagues to enable retrospective coding based on audio recordings. Of the 102 coded sessions, recordings of insufficient quality for transcription (mainly due to heavy background noise, N = 29) or that did not contain any hotspots (N = 29) were excluded in the present study. From the remaining 44 recordings one session was selected per patient. This was the session in which the most hotspots occurred. In case there were multiple sessions with the same number of hotspots, the session occurring earliest in treatment was used. In total the 20 selected sessions contained 37 hotspots; seven recordings with three hotspots, three recordings with two hotspots, and ten recordings with one hotspot (see Figure 1).
Figure 1.
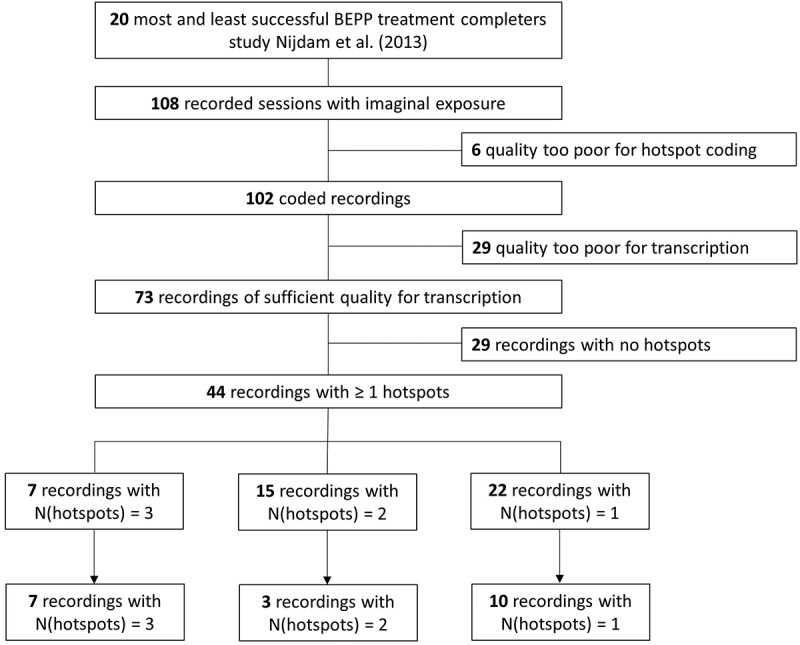
Data selection chart for available session recordings.
2.1.1. Data preparation
The data consisted of tape recordings (mono channel) of complete imaginal exposure sessions, which were converted to WAV format (16-bit, 16 kHz, mono) using the digital audio editor Audacity® version 2.0.5 (Audacity Team, 2013). The recordings were over 10-years old at the time of digitization, which negatively influenced the sound quality. Each recording contained a complete imaginal exposure session consisting of four elements (Gersons et al., 2011):
Discussion: discussion of the previous session, the course of the PTSD symptoms, and the structure and content of the current session.
Relaxation exercises: repeatedly tensing and relaxing muscle groups to enable the patient to focus on the traumatic event and go back to the situation.
Exposure: for the first exposure session, the patient is brought back to the day of the traumatic event and is asked to give a detailed account of the situation prior to the event and the event itself. In subsequent sessions, exposure starts where it left off in the previous session.
Discussion: discussion of the exposure experienced so far and explanation of the content and structure of the following session.
Since we were only interested in the imaginal exposure phase, the initial discussion of the previous session, relaxation, and concluding discussion were removed, leaving only the exposure phase, usually about 15–20 min per recording, for analysis.
Because the audio was of poor quality and transcriptions needed to be as detailed as possible, automatic speech recognition (ASR) was not applicable. The recordings were therefore transcribed and annotated by the first author, who was blind to therapeutic outcome. The transcriptions are verbatim, meaning that every recorded word, including unfinished words (stammering), non-fluencies (e.g. uh, hmm), and forms of backchanneling (e.g. uhhu, ok), was transcribed. Background noise was removed only if necessary for transcription, using the noise reduction function implemented in Audacity® version 2.0.5. However, for some sessions small parts of the speech could still not be transcribed due to the amount of noise, heavy emotions, or weakness of the speech signal. These parts are coded as ‘inaudible’, including start and end time. The exact start and end time of each hotspot were coded by the first two authors.
The transcriptions were then converted to the (C)XML file format for annotating transcriptions to enable parsing (easily separating patient from therapist speech and hotspot from non-hotspot phases for the text analysis) and to link the transcribed text to the digital audio recordings. Linking of text and audio data was done using forced alignment within the WebMaus Pipeline version 2.25 (Kisler, Reichel, & Schiel, 2017), including the Chunker function by Poerner and Schiel (2016). The resulting TextGrid files were then complemented with interval tiers; connected sequences of labelled intervals annotating hotspots, the speaker turns, and silences, using Praat version 6.0.4.3 (Boersma & Weenink, 2019). This way the transcriptions and recordings were converted to input formats suitable for the multimodal classification pipeline.
2.1.2. Identifying hotspots
The Hotspots Manual of Holmes and Grey (2002), and succeeding research on hotspots by Holmes et al. (2005) and Grey and Holmes (2008), was used to identify hotspots: 1) the moment is defined by the patient as the ‘worst moment’; 2) the moment was identified as a hotspot in a previous session; 3) an audible change in affect; 4) the patient changes from present to past tense; 5) the patient changes from first to third person; 6) the patient is ‘whizzing through’; 7) the patient cannot remember details of the moment; 8) the patient is dissociating; or 9) the moment is mentioned by the patient to correspond to an intrusion.
2.2. Operational constructs for automatic recognition
We distinguished nine constructs underlying hotspots that could be used in their automatic recognition. Five of these are based on the formal hotspot characteristics; affect, emotions, cognitions, dissociation, and avoidance. The remaining four (cohesion, organization, fragmentation, and complexity) were selected based on previous research on CBT sessions. Although until now, except for organization, these additional constructs were mainly studied with regard to complete trauma narratives and not to specific parts such as hotspots, we expected them to be useful for automatic hotspot recognition as they do play a part in the emotional processing of traumatic events (Amir et al., 1998).
Each construct is operationalized through variables that can be measured based on combinations of either text, speech, or text and speech features. Since the aim is to recognize hotspots automatically, we only used those variables that could be measured based on automatically extracted (i.e. without the need for manual coding) text and speech features. The features used to capture each construct are described in sections 2.3.2 Text feature extraction and 2.3.3 Speech feature extraction. More feature details, including examples and equations, can be found in Appendix A and Appendix B. The operationalization of each construct and the related features are shown schematically in Figure 2 and elaborated upon in Appendix C.
Figure 2.
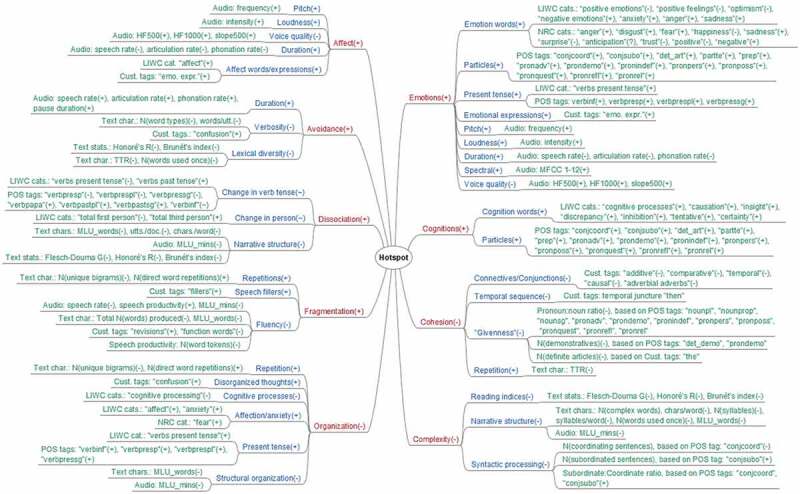
Operationalization scheme for constructs underlying hotspots (red), related variables (blue), and extracted features (green). For each node is indicated whether it is expected to increase (+), decrease (-), change in both directions (~), or either direction (?).
2.2.1. Affect
According to Grey et al. (2002) a visible change in affect (e.g. bursting into tears, turning red, shaking, or sweating) is the most obvious way to identify a hotspot. When working with audio files, audible cues can be used instead of visible cues, as in Nijdam et al. (2013), who showed that change in affect remains a strong identifier even without the visible aspect. Juslin and Scherer (2005) define affect as ‘a general, umbrella term that subsumes a variety of phenomena such as emotion, stress, mood, interpersonal stance, and affective personality traits’ [p. 69].
2.2.2. Emotions
Emotion is one of the affective phenomena listed by Juslin and Scherer (2005), and as such the constructs affect and emotions are closely related. Holmes et al. (2005) distinguished 11 emotion categories based on emotion words that occurred during hotspots: fear, helplessness, anger, sadness, surprise, disgust, dissociation, happiness, shame, guilt, and horror. Of these, especially anxiety, helplessness, and horror are deemed important, as these were specified explicitly under PTSD criterion A2 of the DSM-4-TR (American Psychiatric Association, 2013), although this criterion was removed from the most recent version, the DSM-5 (American Psychiatric Association, 2000). We also expected higher occurrences of the emotions anger, sadness, shame, disgust, and guilt, as these were found to be often related to hotspots (Grey et al., 2001, 2002; Holmes et al., 2005).
2.2.3. Cognitions
In addition to emotion categories, Holmes et al. (2005) distinguished seven cognitive themes that can characterize hotspots: uncertain threat, general threat of injury and death, control and reasoning, consequences, abandonment, esteem, and cognitive avoidance. Cognitive themes of psychological threat (sense of self) were found to appear more in hotspots than those of physical threat (physical integrity) (Grey & Holmes, 2008; Holmes et al., 2005).
2.2.4. Dissociation
Hotspots are also identified by changes in speaking style. During imaginal exposure, patients are asked to describe the past event as if it were happening now, in the first person present tense. Patients may dissociate during hotspots by changing from present to past tense or from first to third person (Grey et al., 2002). This altered or unreal perception of the traumatic event may indicate that peritraumatic dissociation occurred during or directly after the traumatic experience.
2.2.5. Avoidance
Other hotspot characteristics related to speaking style described by Grey et al. (2002) are ‘whizzing through’ (rushing through the main event giving minimal details, while extensively describing the build-up and aftermath) and the patient declaring he or she is unable to remember details of the moment. These characteristics reflect (non-conscious) avoidance.
2.2.6. Cohesion
Narrative cohesion focuses on the occurrence of explicit cues within the text that enable the reader (or listener) to make connections within or between sentences or clauses (Crossley, Kyle, & McNamara, 2016). Previous studies found cohesion to be related to the level of intrusive symptoms in children (O’Kearny, Speyer, & Kenardy, 2007) and trauma-related avoidance (O’Kearney, Hunt, & Wallace, 2011), which both are hotspot characteristics.
2.2.7. Organization
Trauma survivors with PTSD are found to produce more disorganized trauma narratives than trauma survivors without PTSD (Halligan, Michael, Clark, & Ehlers, 2003; Jones, Harvey, & Brewin, 2007). The (dis)organization of the ‘worst moments’ (hotspots) in traumatic memories was previously studied based on text features by Jelinek et al. (2010).
2.2.8. Fragmentation
Foa et al. (1995) suggest that trauma memories are more fragmented (i.e. lacking flow) for trauma survivors with PTSD, because information could not be adequately processed and encoded under stressful conditions. They found a significant correlation between fragmentation and PTSD symptoms over treatment.
2.2.9. Complexity
Amir et al. (1998) found that narrative complexity correlated negatively with PTSD severity three months after the trauma. They found that patients who wrote more simplistic narratives showed more severe PTSD than patients who wrote more complex narratives. However, later studies concluded that found effects could also be due to differences in writing skill and cognitive ability (see Gray & Lombardo, 2001). Complexity may relate to the hotspot characteristic ‘whizzing through’, due to which hotspot moments are described in a more simplistic fashion and in less detail. Also, hotspot moments may be narrated in a more fragmented way due to changes in affect.
2.3. Classification pipeline
The development of a new classification model involves two phases; a training phase and a prediction phase. In the training phase, information is extracted from each object following a range of preprocessing and feature extraction steps, resulting in labelled feature sets. A machine learning algorithm uses those labelled feature sets to learn and select the most discriminative text and speech features for the ‘hotspot’ versus the ‘non-hotspot’ phases.
In the prediction phase, the classifier uses those features to identify hotspots from new imaginal exposure session recordings and transcripts (for more on the development of classification models, see Wiegersma, Van Noije, Sools, & Veldkamp, n.d.). This sequence of steps, in which the output of each step is the input for the next, is called a pipeline (see Figure 3).
Figure 3.
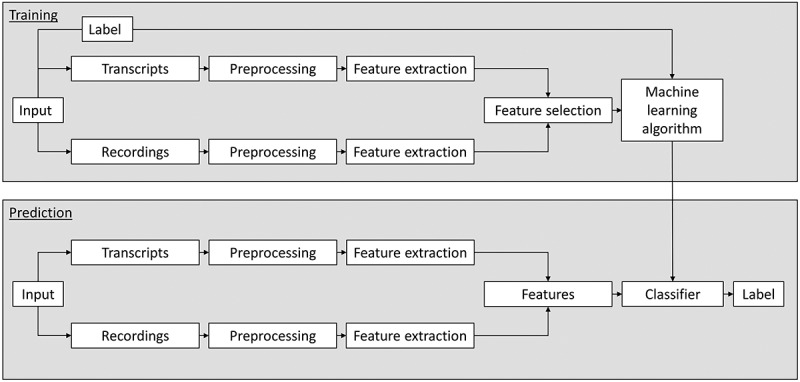
Multimodal supervised classification pipeline.
The preparation, preprocessing and feature extraction steps were done separately for text and speech features because they require different techniques. Feature selection and machine learning were applied to the combined, multimodal feature sets. Text preprocessing and feature extraction was done in Python 3.7.2 (Python Software Foundation, 2019) using the Natural Language Toolkit (NLTK 3.4; NLTK Project, 2019) and Python’s Textstat package (version 0.5.4; Bansal & Aggarwal, 2018), and in LIWC using the Dutch LIWC dictionary and the NRC emotion lexicon. Audio preprocessing and feature extraction were done using Audacity® version 2.0.5, WebMaus version 2.25, and Praat version 6.0.4.3. Conversion of the text transcripts from plain text files to parsable and linkable file formats was done using custom XML and CXML converters developed by one of the authors (available upon request). For feature selection and machine learning, the Scikit-learn library (Pedregosa et al., 2011) version 0.20.2 was used.
2.3.1. Preprocessing
The text and audio analysis focused on patient speech only. The textual input for the classification pipeline consisted of plain text files containing the transcribed, anonymized patient speech cut into ‘hotspot’ and ‘non-hotspot’ segments (parts in the exposure phase preceding or following a hotspot). In total the transcripts were split into 37 hotspot segments and 45 non-hotspot segments. To analyse the text on word level, separate words were extracted from the transcripts using the word tokenizer for Dutch implemented in NLTK (see Perkins, 2014, for more on tokenization). All words were normalized by removing punctuation, accents, and capital letters. For the N-gram extraction, each word except for stop words was stemmed (reduced to its base form, see Jurafsky & Martin, 2009, for more on stemming) using a standard Dutch Snowball stemmer included in NLTK (Porter, 2001). For the tagger-based feature extraction and the overall text characteristics the unstemmed input text was used.
For the audio analysis, the prepared TextGrid files (see 2.1.1 Data Preparation) were directly processed in Praat, selecting the audio signals for patient-speech only and distinguishing between hotspot and non-hotspot phases within the annotated interval tiers. In line with Jurafsky and Martin (2009), we used utterances instead of sentences because we work with a corpus of transcribed speech that does not contain punctuation such as original text corpora. Utterances, which can be words, phrases or clauses, were identified based on Tanaka, Sakti, Neubig, Toda, and Nakamura (2014), in which utterances are separated based on a pause in speech longer than 1 s.
2.3.2. Text feature extraction
Text features capture what is being said, focusing on the textual content. Text content can be examined on word or phrase level by extracting unigrams, N-grams, or N-multigrams (single words, phrases, or variable-length word combinations). With small samples, frequencies of individual words or phrases may be too low to recognize specific patterns. In that case, it is useful to analyse words belonging to particular grammatical or lexical categories by assigning labels (tags) to each word using parts-of-speech (POS), lexicon-based, or custom taggers.
In general, grammatical POS tags such as personal pronouns and verb tense are thought to give information about one’s (temporal) focus and psychological distance towards a situation or event, which may provide cues on thought processes, priorities, and intentions (Tausczik & Pennebaker, 2010). Tags regarding verb tense are also considered useful in assessing memory (dis)organization and time perspective (Jelinek et al., 2010). Previous studies in which POS tags were used showed that tags such as first-person singular pronouns correlated positively with psychological distress (Rude, Gortner, & Pennebaker, 2004; Wolf, Sedway, Bulik, & Kordy, 2007). In addition, trauma survivors that were sensitive to developing posttraumatic stress symptoms were found to use more first-person plural than first-person singular pronouns (Chung & Pennebaker, 2007; Stone & Pennebaker, 2002).
A widely used lexicon-based tagger is LIWC, which assigns words to categories related to linguistic elements, emotions, and cognitive processes, and counts their relative frequencies. Since hotspots are the most emotionally distressing moments of trauma (Nijdam et al., 2013), special attention was paid to the emotions present in the transcripts. Although LIWC extracts several emotion categories (anxiety, anger, and sadness), more extensive insight in the emotions was gained using a General Purpose Emotion Lexicon (GPEL), which is considered to significantly improve emotion classification (Aman & Szpakowicz, 2007).
Finally, text characteristics and statistics were extracted to analyse textual differences on the general level. Previous studies showed that these characteristics can be used to detect emotions (Lee & Narayanan, 2005) or as indicators for physical symptoms and discomfort (Alvarez-Conrad et al., 2001).
The text features were extracted over the complete hotspot or non-hotspot phase, extracting all text features for each separate hotspot and non-hotspot segment. To prevent bias towards longer text documents, the extracted N-grams were weighted by normalized term frequency (tf, occurrence counts normalized by document length, see more in Forman, 2003) or term frequency-inverse document frequency (tf-idf, see more in Jurafsky & Martin, 2009), which are the most commonly used feature weights. The occurrence frequencies returned by the taggers were normalized by document length. A detailed description of all used text features, their relation to the operational constructs, and the extraction process can be found in Appendix A.
2.3.3. Speech feature extraction
In addition to what is being said, which is captured by the text features, it is of interest how things are said, since one’s manner of speaking can convey signs of emotions or stress (Lefter, Rothkrantz, Van Leeuwen, & Wiggers, 2011; Scherer, 2003). Some emotions, especially emotions that are high in arousal, such as anger and fear, can be better identified from spoken than from written data (e.g. Truong & Raaijmakers, 2008).
The study of speech sounds is called phonetics. Phonetic studies can focus on how sounds are produced (articulatory phonetics), how sounds are perceived (auditory phonetics), or how sounds are transmitted (acoustic phonetics) (Ashby, 2013). The latter concentrates specifically on the acoustic characteristics (or physical properties) of speech, such as frequency, amplitude, and duration, which can be objectively measured by analysing acoustic waveforms. A waveform is a graphical representation of a sound wave, in which the variation in air pressure (y-axis) involved with the production of sound is plotted over time (x-axis) (Jurafsky & Martin, 2009). It is generally assumed that one’s affective state is reflected by objectively measurable voice cues. As such, acoustic phonetics are considered the most promising phonetic features in examining affect and emotion (Juslin & Scherer, 2005).
Lefter et al. (2011) divide acoustic features into prosodic, spectral, and voice quality features. Studies in which the identification of emotions or affective state plays a role mostly depend on prosodic features. Prosody refers to a collection of acoustic features that concern intonation-related (pitch), loudness-related (intensity), and tempo-related (e.g. durational aspects, speaking rate) features (Jurafsky & Martin, 2009). This can closely contribute to meaning and may reveal information normally not captured by textual features, such as emotional state or attitude (Wilson & Wharton, 2006).
Prosodic features generally cover speech units larger than one segment, such as syllables, words, or speaker turns, and are therefore also termed suprasegmentals (Jurafsky & Martin, 2009). The suprasegmentals pitch, loudness, and duration (tempo and pause) are among the most used features in the phonetic study of prosody (see, e.g. the prosodic frameworks of Ladd & Cutler, 1983; Roach, 2000; Schoentgen, 2006). Several recent clinical studies used suprasegmental features for the diagnosis of a range of psychological disorders (Scherer et al., 2013), or specific disorders such as PTSD (Vergyri et al., 2015) and dementia (Fraser et al., 2014; Jarrold et al., 2014). Other purposes for which suprasegmentals have been used include identifying indicators for PTSD therapy progress (Van Den Broek et al., 2009) and assessing depression severity during therapeutic intervention (Lamers, De Jong, Truong, Steunenberg, & Westerhof, 2014).
In addition to prosodic features, spectral features such as Mel-frequency cepstral coefficients (MFCCs) are commonly used in emotion detection as these are affected by emotional arousal (Lefter et al., 2011). Voice quality features such as high-frequency energy (HF) are found to be strongly related to emotions as well. Apart from neutral, voice qualities can be, for example, breathy, creaky, harsh, tense, or whispery. Finally, overall speaker turn statistics (e.g. turn length, the number of utterances per turn) were extracted as these can gauge language strength (poverty of speech) and structural organization (Orimaye et al., 2014).
The audio data were analysed based on the prosodic features pitch, loudness, and duration, which are the most commonly used voice cues (Juslin & Scherer, 2005), acoustic parameters related to spectral and voice quality features, and turn statistics. The prosodic, voice quality, and general features were extracted at speaker turn and utterance level, the spectral features at the frame level. In three segments not all speech features could be extracted at the patient level because these segments contained no or only one voiced segment, due to which no SDs could be calculated for the concerning speech features. For these missing values, overall averages for the concerning classes (hotspot or non-hotspot) were imputed. More information on the used speech features, their relation to the operational constructs, and the extraction process is given in Appendix B.
2.3.4. Feature union
Table 1 shows all extracted text and speech features. These features consist of a mixture of scales and quantities (e.g. normalized term and category frequencies, overall text statistics, mean amplitude values, and duration measures). Feature rescaling was done to make sure all input features have the same scale. This is preferred for many machine learning applications, to prevent features measured in greater numeric ranges from dominating features measured in smaller ranges. As such, each text and speech feature was rescaled to the [−1, +1] range, as proposed by Hsu, Chang, and Lin (2003), so that each feature’s maximal absolute value is equal to one (see Figure 4). This same scaling method is later applied to rescale the features in the test set.
Table 1.
Feature overview.
| Feature | Description |
|---|---|
| N-grams | Text representation schemes such as the bag-of-words model for unigrams (single words) or language-model based schemes like N-grams or N-multigrams. |
| POS tags | Grammatical tags that classify words in their ‘parts-of-speech’ and assign a label (tag) from a collection of tags (the tagset)a. |
| LIWC categories | Lexicon-based tags captured by LIWCb, which categorizes words as linguistic elements, emotions, and cognitive processes. |
| NRC emotion categories | Eight emotions and two sentiment categories captured using the general purpose NRC emotion lexiconc. |
| Custom tags | Custom tags are used to tag words or word patterns (e.g. specific expressions) in the transcripts that met a specified set of words or phrases. |
| Text characteristics | General descriptive features that capture information on the overall text structure and general characteristics. |
| Pitch | Perceived pitch is objectively measured by its acoustic correlate, fundamental frequency (F0)d. |
| Loudness | Perceived loudness is gauged by speech intensity, which objectively measures the energy in the acoustic signal. |
| Duration | Duration covers the temporal aspects of speech, which are tempo (speaking rate) and pause. |
| Spectral features | Frequency based features that represent the different frequencies (called ‘spectrum’) that together make up the acoustic waveforme. |
| Voice quality features | Perceived voice quality is measured by high-frequency energy (HF); the relative proportion of energy in an acoustic signal above versus below a specific frequency, and formant frequenciesd. |
| Turn statistics | General overall speech features that gauge language strength (poverty of speech) and structural organizationf. |
More details are provided in Appendix A and Appendix B.
aBird et al. (2009)
bLinguistic Inquiry and Word Count program, Pennebaker et al. (2001)
dJuslin and Scherer (2005)
eJurafsky and Martin (2009)
fOrimaye, Wong, and Golden (2014).
Figure 4.
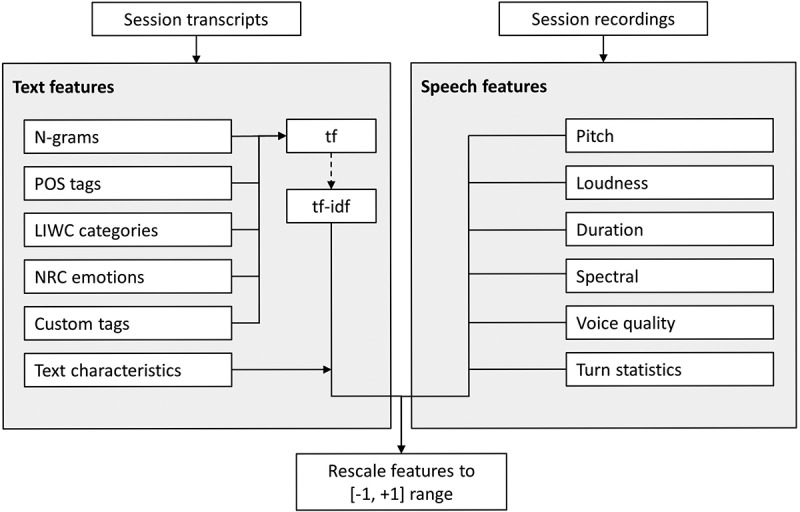
Rescaling process applied to extracted text and speech features before feature.
2.3.5. Feature selection
The most informative features are selected using Pearson’s chi-squared (χ2) test, an effective feature selection metric (Yang & Pedersen, 1997) often used in text classification tasks. A more thorough explanation of χ2 feature selection can be found in Oakes et al. (2001) or Manning, Raghavan, and Schütze (2008). The χ2-test compares the observed and expected feature occurrences in the hotspot versus non-hotspot phases. All features are then ranked based on their χ2-scores and the k features with the highest χ2-scores are selected for the final classification model (see Wiegersma et al., n.d., for a complete description of the process).
2.3.6. Excluded features
Some state that stop words should not be included in the classification model, because these words do not add to the meaning of text (Jurafsky & Martin, 2009; Perkins, 2014). Other studies found that stop words such as particles and pronouns may indicate health improvements (Campbell & Pennebaker, 2003). Since we expected particles and pronouns to be related to the construct fragmentation, we think stop words should not simply be excluded without further investigation, even if some (such as particles and pronouns) are also captured by the POS tagger.
To avoid needlessly large feature sets, other words that were considered for exclusion were words that only occur in very few documents (Joachims, 1998). This was assessed through minimal document frequency; the minimal number of different training documents a word occurs in.
2.3.7. Machine learning algorithm
The extracted text and speech feature sets were used to train a Support Vector Machine (SVM; Vapnik, 1995). SVMs are found to be among the best performing, most robust classification algorithms that can deal well with high-dimensional or imbalanced data sets (Joachims, 1998). We used the ‘C-Support Vector Classifier’ (SVC) with a linear kernel, implemented in Scikit-learn’s LIBSVM library (Chang & Lin, 2011). Two hyperparameters needed to be set; the kernel parameter γ, which we set to linear as is commonly done in text classification tasks, and the regularization parameter C, for which we compared different values in the parameter grid search.
Our classification task was a two-class problem; we wanted to distinguish hotspot phases from non-hotspot phases based on patient speech, defining hotspot phases as the positive class. To compensate for possible class imbalance we balanced class weights to be inversely proportional to the class sizes within the total data set, as in King and Zeng (2001).
2.3.8. Classification performance
In the training phase, the most informative features were extracted and selected for the final classification model. In the prediction phase, the occurrences of those selected features were used to predict a class label for each new input file. The model’s classification performance was measured by comparing the true (known) labels of each input feature set with the predicted label for that feature set. Labels were predicted by applying the decision function resulting from the training phase to the segments present in the test set. The segments were given a positive label (‘hotspot’) if the decision function resulted in a value > 0, and a negative label (‘non-hotspot’) otherwise (see Alpaydin, 2004, for an extensive description of the decision function and optimization problems involved when using SVMs).
The instances in the true and predicted classes can be included respectively in the rows and columns of a confusion matrix, as displayed in Table 2. The cells on the diagonal contain the number of correctly predicted labels (true positives and true negatives), the errors (false positives and false negatives) are in the off-diagonal cells (Bird et al., 2009). We used the correct and false predictions to calculate the classification performance metrics accuracy, precision, recall, and F1-score (see Table 3 for definitions) for the positive class. Of these, accuracy and F1-score are the most commonly used in the evaluation of supervised classification models, although the F1-score is the most suitable to deal with possible class imbalance. We will report all performance scores for each class and the weighted average over both classes, in which the performance scores of both classes are macro-averaged (Yang, 1997) and weighted by class size.
Table 2.
Confusion matrix to assess model performance.
| Predicted class | ||
|---|---|---|
| True class | Positive (CHS) | Negative (CnHS) |
| Positive (CHS) | True positive (tp) | False negative (fn) |
| Negative (CnHS) | False positive (fp) | True negative (tn) |
Comparison of true (rows) and predicted (columns) class labels for the positive (hotspot) class CHS and the negative (non-hotspot) class Cn−HS. The values on the diagonal (in boldface) show the correctly predicted class labels.
Table 3.
Performance metrics and functions.
| Metric (M) | Description | Function |
|---|---|---|
| Accuracy | Proportion of correctly classified segments | |
| Precision | Proportion of correctly identified positive segments | |
| Recall | Proportion of positive segments identified | |
| F1-score | Harmonic mean of precision and recall |
tp = true positives for each class, where true and predicted label are both positive. tn = true negatives for each class, where true and predicted label are both negative. fp = false positives for each class, where the true label is negative but predicted label is positive. fn = false negatives for each class, where the true label is positive but predicted label is negative.
2.3.9. Analytical strategy
We adopted a nested k-fold cross-validation (CV) strategy, iterating over alternating subsets of data (folds) to train, validate, and test the model in order to prevent model evaluation bias. In the inner loop, a 10-fold CV grid search was conducted on the training set, calculating training performance on the validation set to find the optimal combination of (hyper) parameter settings. In the outer loop, the selected model was trained on the complete development set (consisting of the training plus the validation set), calculating the testing performance on the held-out test set to evaluate model generalizability. We will report on the selected parameters and features for the model with the highest testing performance, which was selected as the final hotspot classification model.
Because each session was split in several hotspot and non-hotspot segments, the data set contained multiple labelled segments per patient. To prevent the machine learning algorithm from learning patient-specific features instead of class-specific features, we used Scikit-learn’s group-K-fold sampling strategy in both cross-validation loops. This strategy splits the folds in such a way that data of the same patient will not simultaneously occur in the training as well as the test set.
2.3.10. Parameter grid search
To find the best performing combination of parameter settings and features, an exhaustive grid search guided by the F1-score was conducted in which all possible parameter combinations (within the set ranges) were fitted on the data set. The following parameters and parameter values were compared:
Stop word removal: because there is no clear consensus on stop word removal, we included this as a parameter in the grid search. Stop words are either included or excluded using the Dutch stop word list from the NLTK library. This list includes 101 words, an overview can be found in Appendix A.
Minimal document frequency: we compared the effect of only including N-grams that occurred in at least one, two, or three separate training segments.
Representation schemes: we compared four N-gram representation schemes: unigrams (1,1), bigrams (2,2), trigrams (3,3), and 3-multigrams (1,3).
Term weights: we compared weighting textual content features by tf versus tf-idf.
Select k best features: we compared different cut-off points (k) for the number of features to be included in the model based on the χ2 feature selection metric. We compared values in the range 10–500 (increasing with 20 features each time) and all available features.
Regularization parameter C: the values 1, 2, 3, 100, and 1000 were compared.
To compare the performance of text features with that of speech features and text and speech features combined, the complete model development pipeline, including nested k-fold cross-validation and exhaustive grid search, was run three times. This resulted in three trained and tested models; one text only model, one speech only model, and one multimodal model. The model with the highest training performance was selected as the final model.
3. Results
3.1. Sample characteristics
In total, the selected recordings contained around 6.5 h of imaginal exposure speech, of which over 2 h of ‘hotspot’ speech (mean hotspot length ≈ 3.5 min) and over 4 h of ‘non-hotspot’ speech (mean non-hotspot length ≈ 5.5 min). Of the hotspot speech 70% is uttered by the patient, for the non-hotspot speech this is 78%. On average, the non-hotspot segments contain almost twice as many speaker turns and utterances as the hotspot segments, although the high SDs show there are large differences between segments. The number of word types and tokens show that patients use more unique words in non-hotspots than in hotspots, and that patient speech has a higher pitch in hotspots than in non-hotspots. A summary of the main hotspot and non-hotspot characteristics is given in Table 4.
Table 4.
Summary of characteristics hotspots, non-hotspots, and total sample.
| Characteristics | Hotspots (N = 37) | Non-hotspots (N = 45) | Total (N = 82) |
|---|---|---|---|
| Record length, hr:min:sec | 02:14:03 | 04:18:06 | 06:32:09 |
| Mean duration, hr:min:sec | 00:03:37 | 00:05:44 | 00:04:46 |
| Speaker turns, M(SD) | 24.43(21.52) | 40.13(45.38) | 33.05(37.23) |
| Utterances, M(SD) | 27.22(16.71) | 47.22(34.43) | 38.20(29.47) |
| Word tokens, M(SD) | 259.62(187.90) | 546.69(478.98) | 417.16(401.21) |
| Word types, M(SD) | 104.11(44.79) | 170.47(95.47) | 140.52(83.35) |
| Type:Token Ratio, M(SD) | 0.47(0.12) | 0.42(0.16) | 0.44(0.14) |
| Words per turn, M(SD) | 16.49(13.99) | 20.27(17.14) | 18.57(15.82) |
| Word length, M(SD) | 3.91(0.21) | 3.95(0.17) | 3.93(0.19) |
| Honoré’s R, M(SD) | 606.31(105.95) | 636.88(142.64) | 623.09(127.58) |
| Flesch-Douma G, M(SD) | 110.44(6.36) | 107.46(7.73) | 108.80(7.26) |
| Brunét’s index, M(SD) | 12.40(1.73) | 13.14(2.59) | 12.80(2.26) |
| Patient speech length, hr:min:sec | 01:33:52 | 03:21:05 | 04:54:58 |
| Sounding, hr:min:sec | 00:44:17 | 01:58:21 | 02:42:39 |
| Mean duration, hr:min:sec | 00:01:11 | 00:02:37 | 00:01:59 |
| Silent, hr:min:sec | 00:49:35 | 01:22:43 | 02:12:18 |
| Mean duration, hr:min:sec | 00:01:20 | 00:01:50 | 00:01:36 |
| Pitch, M(SD) | 253.24(67.86) | 231.00(61.61) | 241.03(65.06) |
| Intensity, M(SD) | 60.06(5.06) | 59.20(6.12) | 59.58(5.65) |
| Speech rate, M(SD) | 1.35(0.68) | 1.57(0.71) | 1.47(0.70) |
| Articulation rate, M(SD) | 3.65(0.74) | 3.56(0.60) | 3.60(0.66) |
| Phonation rate, M(SD) | 0.37(0.18) | 0.44(0.19) | 0.41(0.18) |
| Speech productivity, M(SD) | 1.41(1.65) | 1.03(0.92) | 1.20(1.30) |
Except for the number of speaker turns and record length, all characteristics take into account patient speech only.
3.1.1. Validation splits
The total data set consisted of data of 20 patients. In the outer loop of the nested k-fold cross-validation process, the data set was iteratively split into 10 development and test sets. The development sets consisted of the hotspot and non-hotspot segments of 18 patients (90% of the total sample), and the test sets of the remaining 10% (two patients). An exhaustive grid search was conducted on the development set in the inner loop, during which the development set again was iteratively split into 10 training and test sets, respectively consisting of 90% (16 or 17 patients) against 10% (two or one patients) of the development data.
3.2. Model comparison
We developed three different models; the first model was based only on text features, the second model used only speech features, and the third (multimodal) model consisted of text and speech features combined. This section reports the mean training performance of each model. The mean testing performance for all three models is discussed at the end of this section under 3.3.3 Generalizability.
3.2.1. Text features only
The model-based exclusively on text features was trained using N-grams, N-multigrams, the 96 lexicon-based, POS, or custom tags, and the general text characteristics included in Appendix A. The exhaustive grid search resulted in a mean training F1-score of 0.75 (SD = 0.03) for the hotspot class. This is a good classification performance, and the low SD shows that the grid search results are stable with little variation over the different folds. The model with the highest testing performance resulted in a reasonable precision (0.60), perfect recall (1.00), high F1-score (0.75), and a high classification accuracy (0.75). This model consisted of N-multigrams ranging from one to three words weighted by the tf-idf scheme. Among the most informative features for the hotspot class are words and word combinations such as ‘neck’, ‘terrible’, and ‘no no no’. The best text model was based on only 10 N-multigrams; general text features, lexicon-based features and POS tags were not among the most informative features selected by the grid search.
3.2.2. Speech features only
For the speech feature only model, 111 extracted speech features (see Appendix B for an overview) were compared in the exhaustive CV grid search. The mean training F1-score resulting from the exhaustive grid search was 0.62 (SD = 0.03) for the hotspot class. This is a reasonable performance score, although lower than that of the text only model. Like the text only model, the low SD points to stable grid search results over the folds in the inner loop. The model with the highest testing results was based on 10 speech features selected by the grid search and had a good precision (0.75), recall (0.75), and F1-score (0.75), and an overall classification accuracy of 0.75. The five most informative hotspot (marked by *) and non-hotspot features for this model are displayed in the index graph in Figure 5. This graph shows the change in each feature for the consecutive hotspot and non-hotspot segments compared to the base value of that feature at the start of the exposure session.
Figure 5.
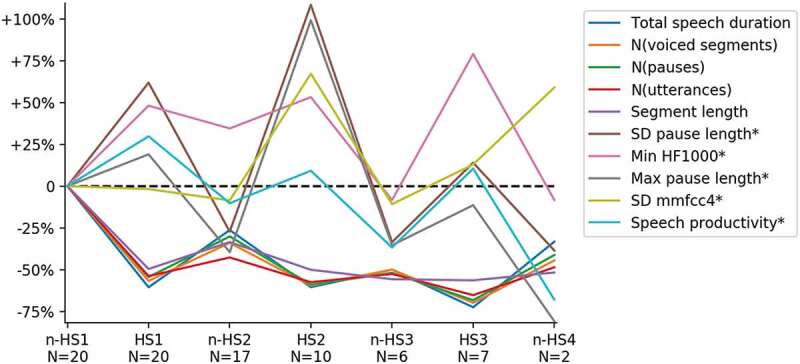
Five most informative speech features for hotspots (*) and non-hotspots.
3.2.3. Text and speech features combined
When using both text and speech features, the mean training F1-score was 0.76 (SD = 0.04) for the hotspot class. As for the speech only model, the combined model with the highest testing performance had a good precision (0.75), recall (0.75), and F1-score of 0.75. The overall training accuracy of the multimodal model was slightly better than for the best text only and speech only models, namely 0.78.
3.3. Final model
The multimodal model was selected as the final model because this resulted in the highest training F1-score for the hotspot class and overall accuracy. This model consisted of 310 text and speech features, where the text features were tf-idf weighted trigrams that occurred in at least two different segments in the training set.
3.3.1. Most informative features
Of the 50 most informative features, three are speech features, seven are LIWC features, two are features extracted through the NRC emotion lexicon, one is a POS tag, one is a custom tag, one is a text statistic, and the remaining 35 are trigrams. To illustrate the occurrences of different feature types in both classes, Table 5 shows a selection of 25 highly informative features that were included in the model.
Table 5.
Selection of most informative features of the multimodal classifier.
| Feature | χ2 | P | Hotspots | Non-hotspots |
|---|---|---|---|---|
| Nee nee nee (no no no)a | 23.347 | 0.127 | 4 | 1 |
| Angst euh euh (fear uh uh)a | 23.060 | 0.129 | 2 | 0 |
| War euh war (were uh were)a | 22.071 | 0.137 | 0 | 5 |
| Category ‘Disgust’b | 21.840 | 0.139 | 0.97 | 0.44 |
| Category ‘Death’c | 21.099 | 0.146 | 0.23 | 0.04 |
| Pijn helemal nik (pain absolutely nothing)a | 20.692 | 0.150 | 2 | 0 |
| Weg vlucht euh (away flight uh)a | 20.692 | 0.150 | 2 | 0 |
| Zeg euh euh (say uh uh)a | 20.408 | 0.153 | 0 | 11 |
| Emotional expressionsd | 18.663 | 0.172 | 8.02 | 1.71 |
| Category ‘Negative emotions’c | 17.905 | 0.181 | 2.30 | 1.22 |
| Category ‘Interrogative pronoun’e | 17.879 | 0.181 | 0.00 | 0.04 |
| Category ‘Anger’c | 17.803 | 0.182 | 0.46 | 0.19 |
| Absolute word count (word tokens)e | 17.498 | 0.186 | 245.85 | 521.12 |
| Bang dod gan (afraid to die)a | 17.443 | 0.187 | 3 | 0 |
| Category ‘Sadness’c,* | 17.192 | 0.190 | 0.69 | 0.23 |
| Euh soort euh (uh sort uh)a | 17.138 | 0.190 | 0 | 4 |
| Zeg euh kom (say uh come)a | 17.003 | 0.192 | 2 | 0 |
| Ging ging wer (went went again)a | 16.500 | 0.199 | 0 | 2 |
| Category ‘Anxiety’c | 16.249 | 0.202 | 0.77 | 0.37 |
| Category ‘Sadness’b,* | 15.045 | 0.220 | 1.80 | 1.05 |
| Number of voiced unitsf | 15.043 | 0.220 | 7.58 | 72.05 |
| Category ‘Eating’c | 15.038 | 0.220 | 0.05 | 0.17 |
| Number of silent unitsf | 14.569 | 0.227 | 5.79 | 66.95 |
| Total duration of speechf | 14.543 | 0.228 | 8.68 | 47.72 |
| Category ‘Swear words’c | 14.388 | 0.230 | 0.12 | 0.02 |
Twenty-five of the 50 most informative features, based on χ2 ranking. The first column shows a selection of high ranked features. N-grams are Dutch and stemmed (hence might seem misspelled; e.g. ‘dood’ is stemmed to ‘dod’, and ‘gaan’ to ‘gan’), with unstemmed English translations in parentheses. The remaining columns show occurrence counts and means for both classes. Values for the class with the highest occurrence are in boldface. *Sadness is listed twice: the first is the LIWC category and the second is the NRC emotion. aN-gram of 3 consecutive words, bEmotion feature extracted using the NRC emotion lexicon, cLIWC feature extracted using the LIWC dictionary, dEmotional expressions extracted using custom tagger, eText statistic extracted using Python’s TextStat package, fSpeech feature extracted using Praat.
3.3.2. Confusion matrix
The confusion matrix in Table 6 shows the number of correctly versus erroneously predicted labels for the hotspots and non-hotspots present in the test set. This shows that on average the model labelled three of the four hotspots correctly, and four of the five non-hotspots. It incorrectly labelled one hotspot as a non-hotspot and vice versa.
Table 6.
Confusion matrix to assess model performance.
| Predicted class |
||
|---|---|---|
| True class | Hotspot | Non-hotspot |
| Hotspot | 3 | 1 |
| Non-hotspot | 1 | 4 |
Note. Comparison of true (rows) and predicted (columns) class labels for the hotspot and the non-hotspot class. The values on the diagonal (in boldface) show the correctly predicted class labels.
3.3.3. Generalizability
The model generalization is the average testing performance over all test sets in the outer loop of the nested k-fold CV. This shows how well a model trained and validated on the labelled input data predicts the correct output for new, future data (Alpaydin, 2004). The testing performance for the final (multimodal) model was lower than the training performance (see Table 7), which means the developed model will not generalize well to new data. This was also the case for the best performing text only and speech only models. However, the models in which is made use of speech features (the speech only and text and speech features combined) seem to be slightly more robust than the model based only on text features. Since the text only model was based on only 10 N-multigrams, it could be that the selected features for the text model were too specific.
Table 7.
Mean testing performance.
| Class | Precision | Recall | F1-score | Accuracy | N(segments) in test set |
|---|---|---|---|---|---|
| Text features only | |||||
| Hotspots | 0.443 | 0.675 | 0.530 | 4 | |
| Non-hotspots | 0.652 | 0.435 | 0.469 | 5 | |
| Weighted average/Total(N) | 0.568 | 0.546 | 0.501 | 0.545 | 9 |
| Speech features only | |||||
| Hotspots | 0.543 | 0.592 | 0.534 | 4 | |
| Non-hotspots | 0.603 | 0.560 | 0.553 | 5 | |
| Weighted average/Total(N) | 0.586 | 0.565 | 0.543 | 0.566 | 9 |
| Multimodal (text and speech features) | |||||
| Hotspots | 0.464 | 0.617 | 0.525 | 4 | |
| Non-hotspots | 0.594 | 0.495 | 0.512 | 5 | |
| Weighted average/Total(N) | 0.543 | 0.556 | 0.522 | 0.555 | 9 |
Note. Per class and average performance scores for the final models.
4. Discussion
The aim of this paper was to examine if it was possible to automatically recognize hotspots in patients undergoing a trauma-focused treatment for PTSD. We hypothesized that a combination of text and speech features extracted from recorded and transcribed patient speech could be used to develop a supervised classification model to automatically distinguish between the hotspot and non-hotspot phases during imaginal exposure sessions. Based on the formal hotspot characteristics and previous research on hotspots and CBT sessions, we identified nine constructs that we expected to differ between hotspots and non-hotspots. We expected that hotspots would contain more affect, avoidance, dissociation, fragmentation, emotions, and cognitions, and less organization, cohesion, and complexity. These nine constructs were operationalized through a number of text and speech characteristics that were captured using a large range of features extracted from CBT session transcripts and recordings, as shown in Figure 2.
The results showed that text and speech features related to these constructs could indeed be used to train a stable model to distinguish between hotspots and non-hotspots within the current data set. The models consisting of text features alone or text and speech features combined resulted in the highest training performance. The training performance of models based on speech features alone was lower. However, clear fluctuations in speech features over the hotspot and non-hotspot segments were found. The high training performance shows that we were able to develop a model based on text and speech features that could classify the hotspot and non-hotspot segments included in the current data set very well.
The feature overview in Table 5 shows that many of the selected features are related to the construct Emotions (e.g. emotion categories disgust, anger, sadness, and anxiety, as well as audible emotional expressions such as sniffing and sighing). This was in line with our expectations, as hotspots are considered the most emotional moments in trauma (Nijdam et al., 2013) and emotions are found to occur more frequently in hotspot than in non-hotspot phases (Holmes et al., 2005). Moreover, the strong, clearly distinguishable dictionary-based features and audible cues that were used to capture emotions may have benefited their recognition.
Table 5 further shows that the LIWC category Sadness was slightly more discriminative than Sadness captured using the NRC lexicon. This could be because the Dutch LIWC dictionary is validated (Zijlstra, Van Meerveld, Van Middendorp, Pennebaker, & Geenen, 2004), whereas the NRC categories were simply converted to Dutch using Google Translate. However, both Sadness categories were discriminative enough for inclusion in the final model. The added value of the NRC dictionary is mainly in the fact that it distinguishes more emotional categories than LIWC, such as the category Disgust, which is also included in the model. Despite this extended range of emotions, two emotions defined by Holmes and colleagues as characterizing for hotspots, namely guilt and horror (the latter of which was also an explicit PTSD criterion of the DSM-4-TR, American Psychiatric Association, 2013), were not covered by the lexicons used. Expanding the emotion lexicon with dictionaries for guilt and horror might improve classification performance.
Psychological theories explaining the working mechanisms underlying PTSD treatments (see Nijdam & Wittmann, 2015), state that trauma memories are represented differently than ordinary memories (e.g. lacking spatial or temporal context, or inadequately integrated with broader memories). As exposure aims to re-encode and restructure the trauma memory in such a way that it no longer evokes the feeling of current threat, successful treatment should result in more integrated, cohesive, and less fragmented trauma narratives, indicating adequate processing of the trauma (Brewin, Dalgleish, & Joseph, 1996; Ehlers & Clark, 2000; Foa & Rothbaum, 1998). However, only a few features related to organization, cohesion, or fragmentation were included in the model, for example, the use of interrogative pronouns (related to Cohesion), the absolute word count and the frequent presence of the speech filler ’uh’ in the selected N-grams (indicators of Fragmentation), the number of voiced and silent units, and the total duration of speech (to capture Avoidance). This could be because for some features, changes in opposite directions may be indicative of different hotspot-related constructs (e.g. an increased speech rate is related to Avoidance, whereas a decreased speech rate may indicate Emotions). This may reduce these features’ discriminative power. Another reason could be that some hotspot characteristics based on which we defined the set of constructs and features to be extracted, did not occur (frequently) in our data set. For example, the change from first to the third person, which is a clear identifier for hotspots, did not take place in any of the sessions.
The low testing performance shows that the selected model does not generalize well to new data sets. Since we tried to fit a complex model with a large number of parameters to a small data set, the low testing performance most likely indicates overfitting (also called overtraining). This means that the selected model has not only learned the underlying structure but also the noise present in the training data (Alpaydin, 2004). Another reason for overfitting could be that the noisy audio data impeded accurate extraction of speech features.
Several studies have shown that emotions and mood influence speaking behaviour and speech sound characteristics (Kuny & Stassen, 1993; Scherer, Johnstone, & Klasmeyer, 2003). As acoustic features can be used in detecting conditions in which changes in speech are common (Fraser et al., 2014), one could also expect these features to detect moments in which changes in speech occur, such as hotspots. Therapy session recordings and transcripts hold a lot of information. Text and audio analysis can help to extract and process this information in a structured, efficient, and reproducible way. Moreover, the collection and analysis of text and audio data can be considered to be non-, or at least less, obtrusive than for example questionnaire-based research or biosignal analysis (which requires sensors to be attached to a patient, Van Den Broek et al., 2009). Given that lots of therapy data may already be recorded and processed as part of the standard treatment procedure, for therapist training and ongoing research, or as part of e-health interventions (e.g. Bourla, Mouchabac, El Hage, & Ferreri, 2018; Olff, 2015; Rizzo & Shilling, 2017; Wild et al., 2016), it is worth exploring how these available data can be made of further value.
It should be noted that most studies on emotion classification and vocal affect expression are based on clean, artificial data in which emotions are portrayed by actors (Juslin & Scherer, 2005) in simple and short utterances (Cowie et al., 2001). The data used in the current study contains raw, authentic emotions embedded in a broader context, from people with different backgrounds who experienced different types of trauma, which is more in line with the real world. As such, our data set can be considered highly ecologically valid and valuable not only for psychiatric research and practice but also for studies on speech sounds and emotion recognition (Van Den Broek et al., 2009). However, this strong point is also a huge limitation. Although re-using existing data sets seems efficient and durable, it also introduces challenges. The biggest challenge is the background noise due to simple recording equipment and the transitory nature of analog recordings, which reduced the recording quality over the years. Due to this, it was not possible to use automated speech recognition and session content needed to be transcribed manually, which remained impossible for small parts of the recordings even after noise reduction.
Another limitation is a methodological one. Because we had such a small data set, we chose not to waste any information by holding out a part of the data for model testing and validation. Instead, we used nested cross-validated grid search, a standard tool included in Scikit-learn. This tool does not provide the option to remove keywords with an occurrence frequency of lower than five in the training set (which is suggested in some studies, e.g. Manning & Schütze, 1999, to ensure reliability of the χ2 calculation).
Despite these limitations, we developed a hotspot classification model with high training performance, meaning that the model could clearly distinguish between the hotspots and non-hotspots present in our data set. However, the low testing performance indicates that the model will have difficulty recognizing hotspots from new input data. This is probably due to the application of a complex training strategy using many different features on a relatively small, low quality, but ecologically valid data set. Another reason could be that the patient characteristics and trauma types present in our data set may have influenced speech characteristics and word use, and as such the features included in the model. This should be studied in more detail on a larger data set. The techniques used lend themselves well to the application on larger data sets, and current audio recording equipment makes it easier to collect and process high-quality audio data which can be transcribed automatically using automatic speech recognition. This way, much larger sets of therapy session transcripts and recordings can be generated. Because this study only used text and speech features that could be automatically extracted it is very easy to train and test a new hotspot recognition model on new data using the same constructs, which we expect to improve model generalizability.
Although model performance needs to be improved, this type of research has the potential to advance theories about effective treatment elements in the context of trauma treatment. The automatic recognition of hotspots may aid in the comparison of hotspot characteristics for different patient groups, trauma types, or dropouts to investigate potential mediators of treatment success as suggested by Nijdam et al. (2013). In addition, clinicians can gain more insight in the occurrence and characteristics of hotspots and the way hotspots are addressed, which might assist them in offering a more effective intervention to patients that otherwise would not respond sufficiently to treatment (Nijdam & Wittmann, 2015).
Because of the low generalizability, the current study should merely be seen as a proof of concept, showing the technical and practical feasibility and possibilities of text and audio mining for research on trauma treatment processes and mental health research in general. Future research should focus on applying this method to larger, higher quality data sets before more general conclusions can be drawn. Still we want to emphasize the added value and potential of the used methods and data for future research. For clinical practice, in the future this work may benefit the patient because these types of models can provide the therapist with (direct) automated feedback, which allows for more precise and unobtrusive monitoring of treatment progress.
Appendix A. Extracted text features
A.1 N-grams
N-grams were extracted to analyse differences in the content of hotspots versus non-hotspots. N-grams are, for example, bigrams (sequences of two words) or trigrams (sequences of three words), whereas N-multigrams consist of variable-length sequences of maximum N words (Shen, Sun, Yang, & Chen, 2006). Contrary to unigrams, N-grams and N-multigrams can take into account the relationship between consecutive words and word context, which can be valuable when analysing words with multiple meanings or when the relationship between consecutive words changes the meaning of a phrase, for example, in case of negation (Bekkerman & Allan, 2003; Shen et al., 2006; Tan, Wang, & Lee, 2002). Unigrams, bigrams, trigrams, and N-multigrams of maximum three words were extracted and weighted using the CountVectorizer implemented in Scikit-learn.
Table A1.
N-grams.
| Feature | Description | Construct |
|---|---|---|
| Unigrams | Single words | Content |
| N-grams | Short phrases of N consecutive words (max N was set to 3) | Content |
| N-multigrams | Variable-length sequences of max N words (max N was set to 3) | Content |
A.2 Parts-of-speech (POS) tags
Many different POS tagsets exist, but almost every tagset contains the 12 universal grammatical tags, which are verbs, common and proper nouns, pronouns, adjectives, adverbs, pre- and postpositions, conjunctions, determiners, cardinal numbers, participles, ‘other’, and punctuation (Perkins, 2014). A POS tagger is generally trained on a training corpus that consists of POS tagged words; tokens of the format (word, tag). We used a pre-trained Perceptron tagger for Dutch by Van Miltenburg (2015) based on the NLCOW14 corpus, which was tagged using the stochastic TreeTagger by Schmid (1999), available in Python 3. We extracted 24 POS tags that were expected to relate to the prespecified operational constructs.
Table A2.
Parts-of-speech (POS) tags.
| Tag | Example (Dutch) | Construct |
|---|---|---|
| Conjcoord (coordinate conjunction) | And (en) | Complexity, Emotions, Cognitions |
| Conjsubo (subordinate conjunction) | As (als) | Complexity, Emotions, Cognitions |
| Det_art (determiner article) | The (de, het) | Emotions, Cognitions |
| Det_demo (demonstrative determiner) | Those (die) | Cohesion |
| Nounpl (common noun plural) | Humans (mensen) | Cohesion |
| Nounprop (proper noun) | Sudan (Soedan) | Cohesion |
| Nounsg (common noun singular) | Human (mens) | Cohesion |
| Partte (particle) | To (te) | Emotions, Cognitions |
| Prep (preposition) | At (aan) | Emotions, Cognitions |
| Pronadv (adverbial pronoun) | With that (er, daarmee) | Cohesion, Emotions, Cognitions |
| Prondemo (demonstrative pronoun) | Self (zelf) | Cohesion, Emotions, Cognitions |
| Pronindef (indefinite pronoun) | Some (sommigen) | Cohesion, Emotions, Cognitions |
| Pronpers (personal pronoun) | He (hij) | Cohesion, Emotions, Cognitions |
| Pronposs (possessive pronoun) | His, mine (zijn, mijn) | Cohesion, Emotions, Cognitions |
| Pronquest (interrogative pronoun) | Who, what (wie, wat) | Cohesion, Emotions, Cognitions |
| Pronrefl (reflexive pronoun) | ‘X’-self, each other (zich, elkaar) | Cohesion, Emotions, Cognitions |
| Pronrel (relative pronoun) | What (wat) | Cohesion, Emotions, Cognitions |
| Verbinf (verb infinitive) | To do (doen) | Emotions, Dissociation, Organization |
| Verbpapa (verb past participle) | Painted (geschilderd) | Dissociation |
| Verbpastpl (verb past tense plural) | Could (konden) | Dissociation |
| Verbpastsg (verb past singular) | Dived (dook) | Dissociation |
| Verbpresp (verb present participle) | Laughing (lachend) | Emotions, Dissociation, Organization |
| Verbprespl (verb present tense plural) | Sit (zitten) | Emotions, Dissociation, Organization |
| Verbpressg (verb present tense singular) | Sit (zit) | Emotions, Dissociation, Organization |
POS tag overview as published in the Dutch tagset documentation for the TreeTagger Tool developed by Helmut Schmid, Institute for Computational Linguistics, University of Stuttgart. Retrieved from http://www.cis.uni-muenchen.de/˜schmid/tools/TreeTagger/. Examples adopted from Sketch Engine; https://www.sketchengine.eu/dutch-treetagger/.
A.3 LIWC categories
Of the 66 categories included in LIWC, 23 were expected to relate to the prespecified operational constructs. Another 11 were included as features because of their expected relation to hotspot content (e.g. categories related to perceptual processes, assent, and negation). The occurrence frequencies for these categories were determined using the validated Dutch dictionary developed by Zijlstra et al. (2004).
Table A3.
LIWC categories.
| Category | Example (Dutch) | Construct |
|---|---|---|
| Total 1st person | I, we (ik, wij) | Dissociation |
| Total 2nd person | You, your (jij, jouw) | Dissociation |
| Total 3rd person | Their, she (hun, zij) | Dissociation |
| Negations | No, never (nee, nooit) | Content |
| Assent | Agree, yes (eens, ja) | Content |
| Affect words (emo. processes) | Happy, sad (blij, verdrietig) | Affect, Organization |
| Positive emotions | Thankful, brave (dankbaar, dapper) | Emotions |
| Positive feelings | Fun, love (plezier, liefde) | Emotions |
| Optimism | Proud, willpower (trots, wilskracht) | Emotions |
| Negative emotions | Hurt, hostile (gekwetst, vijandig) | Emotions |
| Anxiety | Nervous, worried (nerveus, bezorgd) | Emotions, Organization |
| Anger | Hate, threat (haat, dreiging) | Emotions |
| Sadness | Crying, grief (huilen, rouw) | Emotions |
| Cognitive processes | Cause, know (oorzaak, weten) | Cognitions, Organization |
| Causation | Because, effect (omdat, effect) | Cognitions |
| Insight | Think, consider (denk, overwegen) | Cognitions |
| Discrepancy | Should, could (zouden, kunnen) | Cognitions |
| Inhibition | Constrain, stop (beperken, stoppen) | Cognitions |
| Tentative | Maybe, perhaps (misschien, wellicht) | Cognitions |
| Certainty | Always, never (altijd, nooit) | Cognitions |
| Perceptual processes | Observing, feel (observeren, voelen) | Dissociation |
| Time | End, until (eind, totdat) | Dissociation |
| Verbs in past tense | Went, ran (ging, rende) | Dissociation |
| Verbs in present tense | Is, does (is, doet) | Emotions, Dissociation, Organization |
| Verbs in future tense | Will, going to (zal, gaan) | Dissociation |
| Religion | Pray, honour (bidden, eren) | Content |
| Death | Bury, kill (begraven, doden) | Content |
| Physical | Ill, faint (ziek, flauwvallen) | Content |
| Body | Vital, cramp (vitaal, kramp) | Content |
| Sexual | Flirt, kiss (flirten, kussen) | Content |
| Ingestion | Drink, hungry (drinken, honger) | Content |
| Sleep | Nightmare, awake (nachtmerrie, wakker) | Content |
| Groom | Shower, wash (douchen, wassen) | Content |
| Swear words | Content |
LIWC categories and examples translated from Zijlstra et al. (2004).
A.4 NRC emotion lexicon
To capture emotions we used the open-source NRC word-emotion association lexicon (also known as EmoLex) developed by Mohammad and Turney (2010, 2013). This is a hand-coded lexicon originally annotated for English and translated for over 20 languages using Google Translate (July 2015) based on the assumption that affective norms are stable across languages despite possible cultural differences. The Dutch NRC emotion lexicon contains associations for 7,850 words. Despite possible errors the lexicon may contain due to incorrect or transliteral translations, we expected features extracted using the NRC emotion lexicon to complement the LIWC emotion features, because it covers emotion categories not included in LIWC (e.g. disgust, trust, anticipation, and surprise).
Table A4.
NRC emotion lexicon.
| Category | Example (Dutch) | Construct |
|---|---|---|
| Anger | Crunch, harassing (knarsen, storend) | Emotions |
| Disgust | Dank, decompose (vochtig, ontleden) | Emotions |
| Fear | Crouch, hesitation (hurken, aarzeling) | Emotions, Organization |
| Happiness/Joy | Pleased, praise (tevreden, lof) | Emotions |
| Sadness | Homesick, pity (heimwee, jammer) | Emotions |
| Surprise | Incident, pop (incident, knal) | Emotions |
| Anticipation | Hurry, importance (haasten, belang) | Emotions |
| Trust | Personal, stable (persoonlijk, stabile) | Emotions |
| Positive sentiments | Amiable, learn (beminnelijk, leren) | Emotions |
| Negative sentiments | Chilly, suffer (kil, lijden) | Emotions |
Emotion categories and examples derived from Dutch NRC emotion lexicon file.
A.5 Custom tags
We specified several (parts of) words and word patterns that we expected to relate to the prespecified constructs. Counts for all words or phrases that matched these specific patterns were returned by the custom tagger.
Table A5.
Custom tags.
| Tag | Example (Dutch) | Construct |
|---|---|---|
| Emotional expressions | sniff, sob, cry, sigh, cough (snif, snik, huil, zucht, kuch) | Affect, Emotions |
| Additive connectives/ Conjunctions |
and, also, in addition, besides, not only … but also, moreover, further (en, ook, daarbij, daarnaast, niet alleen … maar ook, verder, voorts) | Cohesion |
| Comparative connectives/conjunctions | -Comparison: like, as if, except (zoals, alsof, behalve) -Contradiction: (even) though, although, despite, in spite of, without ((al)hoewel, ofschoon, ondanks dat, zonder dat) -Condition: if, in case, provided, unless (als, indien, mits, tenzij) -Between sentences: and, or, but, neither, however, nor (en, of, maar, doch, edoch, noch) |
Cohesion |
| Temporal connectives/conjunctions | -Time: when, if, while, once, before, for, now, then, after, afterwards, before (wanneer, als, terwijl, zodra, voordat, voor, nu, toen, nadat, nadien, vooraleer) -Duration: as long as, until, since, as, according as (zolang als, totdat, sinds, sedert, naarmate, naargelang) |
Cohesion |
| Causal connectives/conjunctions | Cause/effect/reason/purpose words: because, so, so … that, whereby, for, for that, therefore, that, since, if … then, by, in case (doordat, zodat, zo … dat, waardoor, omdat, opdat, daarom, dat, aangezien, als … dan, door, in geval) | Cohesion |
| Adverbial adverbs | -Connecting: moreover, likewise, nor, also, besides, even, therewith (bovendien, eveneens, evenmin, ook, tevens, zelfs, daarbij) -Contradicting: on the other hand, nevertheless, nonetheless, however, though, on the contrary, meanwhile, yet, now (daarentegen, des(al)niettemin, desondanks, echter, evenwel, integendeel, intussen, nochtans, niettemin, nu, toch) -Consequential: consequently, therefore, thus, hence, because of (bijgevolg, derhalve, deswege, dus, dientengevolge) -Other: at least, after all, by the way, besides, yet (althans, immers, overigens, trouwens, toch) |
Cohesion |
| Temporal juncture | ‘then’ (dan) | Cohesion |
| Definite articles | ‘the’ (de, het) | Cohesion |
| Confusion | Don’t know, don’t get it, don’t understand, don’t remember (weet (het) niet, snap(te) (het) niet, begrij(ee)p (het) niet, herinner (me) niet, niet herinneren) | Avoidance, Organization |
| Speech fillers | Uh, hmm, hmm-m, so, like, but, anyway, well (dus, ofzo, enzo, zeg maar, soort van, oke, he, weet je, toch, nou ja) | Fragmentation |
| Revisions | Fragments: -word, word- | Fragmentation |
| Function words | Function word list for Dutch (van Wijk & Kempen, 1980) | Fragmentation |
Connectives and conjunctions derived from grammar overviews by online Dutch NT2 providers:
http://www.openleercentrum.com/Nederlands/Staatsexamen/STEX%201/stex%20I%20schrijven/voegwoorden.doc.
A.6 Text characteristics and statistics
General text characteristics are, for example, the total number of words used (text length), the number of unique unigrams or N-grams (lexical diversity), number of complex words (words of six or more characters, Tausczik & Pennebaker, 2010), number of repeated words and bigrams, revisions, speaker turns and utterances, and statistical measures such as reading ease and grade level indices to examine language strength.
Except for the number of complex words, which was extracted using the LIWC tool, and Honoré’s R and Brunét’s index, which were calculated separately as in Fraser et al. (2014), all general and statistical text features were extracted using Python’s Textstat package. As readability index, we only used the Dutch Flesch-Douma measure G (Douma, 1960), an adaptation of the English Flesch reading ease index (FRE; Flesch, 1948), because the Bormuth Grade Level (Zoellner et al., 2002) uses a standard list of familiar words in English for which no Dutch translation is available.
Table A6.
Text characteristics and statistics.
| Characteristic/Statistic | Definition/Function | Construct |
|---|---|---|
| N(words) | Total number of words used (word tokens) | Fragmentation |
| N(unique words) | Number of unique words used (word types) | Avoidance |
| Type:Token Ratio (TTR) | N(word types)/N(word tokens) | Avoidance, Cohesion |
| Words used once | Words that occur only once in the text | Avoidance, Complexity |
| N(characters) | Total per phase | Complexity |
| Mean N(characters) per word | Mean word length in characters | Dissociation, Complexity |
| N(complex words) | Words of > 6 characters | Complexity |
| N(syllables) | Total syllables per phase | Complexity |
| Mean N(syllables per word) | Mean word length in syllables | Complexity |
| Repetition | Number of immediate word repetitions | Organization, Fragmentation |
| N(unique bigrams) | Number of unique bigrams used | Organization, Fragmentation |
| Pronoun:Noun ratio (PNR) | N(pronouns)/N(nouns) | Cohesion |
| Subordinate:coordinate ratio | N(conjsubo)/N(conjcoord) | Complexity |
| Dutch Flesch-Douma G | 207 − | Dissociation, Complexity |
| Honoré’s R | Avoidance, Complexity | |
| Brunét’s index | Avoidance, Complexity |
Note. Extracted using Python’s TextStat package and LIWC.
A.7 Stop words
Table A7.
Stop word list.
| Dutch stop words | English translation |
|---|---|
| ’de’, ’en’, ’van’, ’ik’, ’te’, ’dat’, ’die’, ’in’, ’een’, ’hij’, ’het’, ’niet’, ’zijn’, ’is’, ’was’, ’op’, ’aan’, ’met’, ’als’, ’voor’, ’had’, ’er’, ’maar’, ’om’, ’hem’, ’dan’, ’zou’, ’of’, ’wat’, ’mijn’, ’men’, ’dit’, ’zo’, ’door’, ’over’, ’ze’, ’zich’, ’bij’, ’ook’, ’tot’, ’je’, ’mij’, ’uit’, ’der’, ’daar’, ’haar’, ’naar’, ’heb’, ’hoe’, ’heeft’, ’hebben’, ’deze’, ’u’, ’want’, ’nog’, ’zal’, ’me’, ’zij’, ’nu’, ’ge’, ’geen’, ’omdat’, ’iets’, ’worden’, ’toch’, ’al’, ’waren’, ’veel’, ’meer’, ’doen’, ’toen’, ’moet’, ’ben’, ’zonder’, ’kan’, ’hun’, ’dus’, ’alles’, ’onder’, ’ja’, ’eens’, ’hier’, ’wie’, ’werd’, ’altijd’, ’doch’, ’wordt’, ’wezen’, ’kunnen’, ’ons’, ’zelf’, ’tegen’, ’na’, ’reeds’, ’wil’, ’kon’, ’niets’, ’uw’, ’iemand’, ’geweest’, ’andere’ | ’the’, ’and’, ’of’, ’I’, ’too’, ’that’, ’this’, ’in’, ’a’/’an’, ’he’, ’it’, ’not’, ’to be’, ’is’, ’was’, ’on’, ’at’, ’with’, ’if’, ’for’, ’had’, ’there’, ’but’, ’to’, ’hem’, ’then’, ’would’, ’or’, ’what’, ’mine’, ’one’, ’this’, ’so’, ’through’, ’over’, ’they’, ’them’, ’with’, ’too’, ’until’, ’you’, ’me’, ’from’, ’there’, ’her’, ’to’, ’have’, ’how’, ’has’, ’to have’, ’these’, ’you’, ’because’, ’still’, ’will’, ’me’, ’they’, ’now’, ’no’, ’because’, ’something’, ’to become’, ’still’, ’already’, ’were’, ’many’, ’more’, ’to do’, ’then’, ’have to’, ’am’, ’without’, ’can’, ’their’, ’so’, ’all’, ’under’, ’yes’, ’once’, ’here’, ’who’, ’was’, ’always’, ’but’, ’will be’, ’went’, ’could’, ’us’, ’self’, ’against’, ’after’, ’already’, ’want to’, ’could’, ’nothing’, ’your’, ’someone’, ’has been’, ’other’ |
Adapted from NLTK.
Appendix B.Extracted speech features
B.1 Pitch
The pitch is measured by the fundamental frequency (F0). The fundamental frequency is the lowest frequency of the waveform. Sounds with higher frequency are generally perceived as having a higher pitch (Jurafsky & Martin, 2009). For each patient utterance, we extracted statistics related to the mean pitch (m_pitch) and the standard deviation of pitch (s_pitch). M_pitch is the mean pitch measured when the patient is speaking. For each patient utterance in a hotspot or non-hotspot segment, the mean pitch is measured and averaged over all patient utterances in that hotspot or non-hotspot. S_pitch is the standard deviation of pitch measured when the patient is speaking. For each patient utterance in a hotspot or non-hotspot segment, the standard deviation of pitch is measured and averaged over all patient utterances in that hotspot or non-hotspot. For both m_pitch and s_pitch, the mean, variance, min, max, and range are calculated over all patient utterances in the segment (hotspot or non-hotspot phase in the session) in order to obtain one value per related statistic per segment.
Table B1.
Pitch.
| Feature | Parameters | Construct |
|---|---|---|
| m_pitch | Mean, SD, min, max, range | Affect, Emotions |
| s_pitch | Mean, SD, min, max, range | Affect, Emotions |
Extracted using Praat version 6.0.4.3.
B.2 Loudness
The intensity is correlated with a sound wave’s amplitude; the maximum vertical displacement from rest (silence) to the top (crest) or bottom (trough) of the wave, which is expressed in decibels (dB) (Lapp, 2006). In general, sounds with higher amplitudes are perceived as being louder (Jurafsky & Martin, 2009). Equal to the extraction of the pitch features, we extracted m_intensity and s_intensity and calculated their mean, variance, min, max, and range over all patient utterances in the hotspot and non-hotspot segments, resulting in one value per statistic per segment.
Table B2.
Loudness.
| Feature | Parameters | Construct |
|---|---|---|
| m_intensity | Mean, SD, min, max, range | Affect, Emotions |
| s_intensity | Mean, SD, min, max, range | Affect, Emotions |
Note. Extracted using Praat version 6.0.4.3.
B.3 Duration
Duration covers tempo and pause. Tempo refers to the speaking rate, which is measured as overall duration (e.g. sound length in (mili)seconds or total duration of speaking time (as in Fraser et al., 2014; Lamers et al., 2014), or as units per duration (e.g. words or syllables per second or minute) (Juslin & Scherer, 2005).
Table B3.
Duration.
| Feature | Parameters/Function | Construct |
|---|---|---|
| Speech rate (incl pauses) | -Words per minute -Syllables per minute -Praat: mean, SD, min, max, range |
Affect, Emotions, Fragmentation, Avoidance |
| Articulation rate (excl pauses) | -Words per voiced minute -Syllables per voiced minute |
Affect, Emotions, Avoidance |
| Phonation rate | N(voiced minutes)/N(total minutes) | Affect, Emotions, Avoidance |
| Speech productivity (pause:speech ratio) | N(silent minutes)/N(voiced minutes)a | Fragmentation |
| MLU (mean length utterance) | -MLU_words -MLU_mins |
Dissociation, Organization, Fragmentation, Complexity, Avoidance |
| Silent (pause duration) | Mean, SD, max, n, rate, sum | Avoidance |
| Sounding (speech duration) | Mean, SD, max, n, rate, sum | Avoidance |
a (Lamers et al., 2014). Extracted using Praat version 6.0.4.3.
We measured speech tempo for the entire audio fragment including pauses (speech rate) and for the spoken parts only, excluding pauses and hesitations (articulation rate) (Jacewicz, Fox, O’Neill, & Salmons, 2009). Similarly, pauses can be silent or voiced (Roach, 2000). Voiced pauses were covered by the lexical feature ‘speech-fillers’, silent pauses were captured automatically using Praat’s silence detection function, with the minimal silence duration set at 500 ms, as in Lamers et al. (2014). We extracted mean, SD, min, max, and rate for the duration of silences (pauses) and speaking time in Praat. Based on these values, we calculated phonation rate, speech productivity, and variables related to speech tempo.
B.4 Spectral features
Spectral features are frequency-based features that represent the different frequencies (called ‘spectrum’) that together make up the acoustic waveform (Jurafsky & Martin, 2009). These features were extracted at the frame level, over frames with a window length of 0.015 s and time steps of 0.005 s. We extracted 12 Mel-frequency cepstral coefficients (MFCCs) and calculated mean and variance over all frames. The MFCCs jointly form a mel-frequency cepstrum, which represents a sound’s short-term power spectrum (Iliou & Anagnostopoulos, 2010), see Logan (2000) for more on MFCC features.
Table B4.
Spectral features.
| Feature | Parameters | Construct |
|---|---|---|
| m_MFCC1 − 12 | Mean, SD | Emotions |
| s_MFCC1 − 12 | Mean, SD | Emotions |
Extracted using Praat version 6.0.4.3.
B.5 Voice quality features
Perceived voice quality is measured by high-frequency energy (HF), which is the relative proportion of energy in an acoustic signal above versus below a specific frequency, and formant frequencies (Juslin & Scherer, 2005). We used a common cut-off frequency of 500 Hz for the high-frequency energy, extracting mean and variance for HF 500. For the formant frequencies, we extracted the mean and precision of the first formant (F1), as commonly used.
Table B5.
Voice quality features.
| Feature | Parameters | Construct |
|---|---|---|
| HF 500 | Mean, SD, min, max | Affect, Emotions |
| HF 1000 | Mean, SD, min, max | Affect, Emotions |
| Slope 500 | Mean, SD, min, max | Affect, Emotions |
| Note. Extracted using Praat version 6.0.4.3. | ||
B.6 Turn statistics
Turn statistics are general, overall speech features for each hotspot and non-hotspot phase, such as the number of speaker turns, turn length, and the number of utterances.
Table B6.
Turn statistics.
| Feature | Parameters | Construct |
|---|---|---|
| N(speaker turns) | Total number of speaker turns | General |
| Turn length | Mean length of speaker turn (in words and minutes) | Complexity |
| N(utterances) | Total number of patient utterances, split by silences > 1 sec | Dissociation |
Extracted using Praat version 6.0.4.3.
Appendix C.Operationalization of hotspot constructs
C.1 Affect
To capture the construct affect, we adopted voice cues commonly used in studies of vocal affect, which are pitch, loudness, voice quality, and duration (Juslin & Scherer, 2005). In addition, we used lexicon-based features (LIWC) to assess the occurrence of affect words and custom tags for the occurrence of audible emotional expressions (e.g. sniffing, sighing).
C.2 Emotions
We assessed emotions through the use of emotion words, captured through lexicon-based features related to emotion (LIWC and NRC emotion lexicon), and audible emotional expressions. Although the LIWC and NRC categories do not completely cover the emotions found to relate most to hotspots (e.g. guilt and horror are not included in either of the lexicons, see Appendix A, we still expect the available emotion categories to provide additional information on the emotions present in hotspot moments. Emotions can additionally be represented by other textual features, such as an increased use of the present tense (Hellawell & Brewin, 2004; Pillemer, Desrochers, & Ebanks, 1998) and particles (Pennebaker et al., 2003), which we respectively measured through lexicon-based features and POS tags related to verb tense and particles (e.g. pronouns, articles, prepositions, conjunctives).
Apart from text features, speech features can also be expected to differ among emotions. For example, fundamental frequency and voice intensity (related to pitch and loudness, respectively) are found to be higher for the emotions anger, fear, and stress, and lower for sadness (Juslin & Scherer, 2005). We adopted prosodic features related to pitch, loudness, and duration, and spectral and voice quality features, as these are used in several studies related to emotion, such as the phonetic description of emotional speech (Roach, 2000), emotion detection (Cowie et al., 2001; Shen, Changjun, & Chen, 2011; Ververidis & Kotropoulos, 2006), and the measurement of emotional distress (Van Den Broek et al., 2009).
C.3 Cognitions
We operationalized cognitive themes through lexicon-based features (LIWC) related to cognitive processes. As for emotions, not all cognitive themes as defined by Holmes et al. (2005) are covered by the cognitive categories included in LIWC. Still we expect to gain extra information from the lexicon-based features that are available. For example, the categories ‘causation’ and ‘insight’ might relate to the cognitive theme consequences, and the categories ‘tentative’ and ‘inhibition’ to the theme uncertain threat (see overview of extracted cognitions in Appendix A). Moreover, as for emotional state, the POS tag ‘particle’ can be indicative of one’s cognitive style (Pennebaker et al., 2003).
C.4 Dissociation
We adopted lexicon-based features (LIWC) and POS tags to capture the change in personal pronouns and verb tense associated with dissociation. Following Zoellner et al. (2002), who studied indications for peritraumatic dissociation in trauma narratives, general text characteristics related to narrative structure (characters per word, words per sentence, the total number of sentences, and several reading indices) were also used.
C.5 Avoidance
We operationalized avoidance through audio statistics related to duration (tempo and pauses), text statistics related to the extensity of descriptions (verbosity) and lexical diversity (also termed vocabulary richness) such as Type:Token Ratio (TTR), Honoré’s R, Brunét’s index, as in Fraser et al. (2014), and custom tags that indicate confusion.
C.6 Cohesion
We operationalized cohesion through custom tags concerning the use of connectives and conjunctions (as in O’Kearney et al., 2011; O’Kearny et al., 2007), and the temporal juncture ‘then’ to measure the temporal sequence of spoken clauses (based on Shaw et al., 2001). According to Shaw and colleagues, use of this temporal juncture by PTSD patients indicates that the patient is closer to re-experiencing a narrated memory with high emotional involvement. Following Crossley et al. (2016), we also used the pronoun:noun ratio (PNR, calculated based on POS tags for nouns and pronouns), the occurrence of demonstratives (captured using POS tags), and definite articles (captured using a customized tag set) to gauge the amount of information given in the text (referred to as ‘givenness’). Finally, the general text statistic Type:Token Ratio (TTR), an indicator of word repetition across a text, was adopted to assess overall text cohesion.
C.7 Organization
Jelinek et al. (2010) studied (dis)organization by counting the number of words indicative of cognitive processes, words related to affection and anxiety, and words in the present tense (captured through lexicon-based text features and POS tags). They also used unfinished thoughts (based on Foa et al., 1995) and the ‘total disorganization score’ introduced by Halligan et al. (2003), which is calculated based on the occurrence of repetitions, disorganized thoughts and organized thoughts.
Repetitions are captured by counting the number of direct word repetitions (Croisile et al., 1996; De Lira, Ortiz, Campanha, Bertolucci, & Minett, 2011) and the number of unique bigrams, which is indicative of repeated bigram patterns (Orimaye et al., 2014). Disorganized thoughts, which consist of utterances implying confusion such as ‘I don’t remember’ or ‘I don’t know’ (Foa et al., 1995) are captured through custom tags, and structural organization of sentences is measured by the Mean Length of Utterance (MLU, as in Orimaye et al., 2014).
C.8 Fragmentation
Previous studies assessed fragmentation by coding repetitions, unfinished thoughts, and speech fillers (Foa et al., 1995; Römisch, Leban, Habermas, & Döll-Hentschker, 2014). Of these, we included repetitions (captured as for the construct Organization) and speech fillers (or filled pauses, Fraser et al., 2014, captured using custom tags for e.g. ‘uh’ or ‘hmm’), since these could be automatically extracted from the data.
Another commonly used indicator for fragmentation is (dis)fluency, because this is a direct and homogeneous measure (Römisch et al., 2014). Speech fluency was found to be inversely related to PTSD symptoms (e.g. Gil, Calev, Greenberg, Kugelmass, & Lerer, 1990; Uddo, Vasterling, Brailey, & Sutker, 1993). Examples of speech disfluencies are repetitions, repairs, filled pauses, and false starts (Shriberg, 2001). To measure speech fluency we used the speech features speech rate and speech productivity and the text feature audible struggle, which were found by Park et al. (2011) to be the most discriminative features for fluency. To capture audible struggle we used custom tags for revisions (based on Croisile et al., 1996; De Lira et al., 2011; Orimaye et al., 2014). Revisions are moments in which the patient retraces and corrects a preceding error, which is extracted from speech transcripts by counting transcribed fragments. Fragments in this context are words that are broken off in the middle. In speech transcripts, fragments are generally represented using ‘-‘, e.g. word- or -word (Jurafsky & Martin, 2009).
Finally, we used the total number of words produced (as in Fraser et al., 2014), because fragmented speech may be characterized by the use of short, less meaningful, or fragmented phrases and single words, and the total number of function words. Function words are the words that give meaning to a text (Orimaye et al., 2014). Their occurrence was counted using a standard Dutch function words list (first published by van Wijk & Kempen, 1980).
C.9 Complexity
We operationalized complexity through text characteristics related to reading indices, narrative structure, and syntactic processing complexity. Although the use of readability indices to capture text comprehensibility is not undisputed, many different reading indices exist and are used in scientific studies. Amir et al. (1998) for example, used the Flesch Reading Ease Index (FRE; Flesch, 1948) and the Flesch–Kincaid Grade Level (FKGL; Kincaid, Fishburne, Rogers, & Chissom, 1975) to capture narrative articulation (i.e., comprehensibility, complexity), whereas Zoellner et al. (2002) used the Bormuth Readability Index (Bormuth, 1969). To gauge narrative structure and syntactic processing complexity, we used general text characteristics such as mean word and sentence length, number of syllables and complex words, and the number and ratio of coordinated and subordinated conjunctions (captured through POS tags, see De Lira et al., 2011; Fraser et al., 2014). Finally, the total number of utterances and the mean number of words per utterance were also adopted as measures for language strength and verbosity (as in Orimaye et al., 2014).
Acknowledgments
We want to thank Laurens Satink and Michel Boedeltje from Telecats Enschede for their efforts on aligning our text and audio data.
Disclosure statement
No potential conflict of interest was reported by the authors.
References
- Alpaydin, E. (2004). Introduction to machine learning. Cambridge, MA: MIT Press. [Google Scholar]
- Alvarez-Conrad, J., Zoellner, L. A., & Foa, E. B. (2001). Linguistic predictors of trauma pathology and physical health. Applied Cognitive Psychology, 15(7SPEC. ISS), S159–S170. [Google Scholar]
- Aman, S., & Szpakowicz, S. (2007). Identifying expressions of emotion in text. Text, Speech and Dialogue, 196–26. doi: 10.1007/978-3-540-74628-7_27 [DOI] [Google Scholar]
- American Psychiatric Association . (2000). Diagnostic and statistical manual of mental disorders, Text Revision (4th ed.). Washington, DC: Author. [Google Scholar]
- American Psychiatric Association . (2013). Diagnostic and statistical manual of mental disorders (5th ed.). Washington, DC: Author. [Google Scholar]
- Amir, N., Stafford, J., Freshman, M. S., & Foa, E. B. (1998). Relationship between trauma narratives and trauma pathology. Journal of Traumatic Stress, 11(2), 385–392. [DOI] [PubMed] [Google Scholar]
- Ashby, P. (2013). Understanding phonetics. London: Routledge. [Google Scholar]
- Audacity Team . (2013). Audacity(R) software is copyright (c) 1999-2016 audacity team. The name Audacity(R) is a registered trademark of Dominic Mazzoni. Retrieved from http://audacityteam.org/
- Bansal, S., & Aggarwal, C. (2018). Textstat [Python package]. Retrieved from https://pypi.org/project/textstat/
- Bedi, G., Carrillo, F., Cecchi, G. A., Slezak, D. F., Sigman, M., Mota, N. B., … Corcoran, C. M. (2015). Automated analysis of free speech predicts psychosis onset in high-risk youths. Schizophrenia, 1(1). doi: 10.1038/npjschz.2015.30 [DOI] [PMC free article] [PubMed] [Google Scholar]
- Bekkerman, R., & Allan, J. (2003). Using Bigrams in Text Categorization (Technical Report IR-408). Amherst, MA: Center for Intelligent Information Retrieval, University of Massachusetts Amherst. [Google Scholar]
- Bhaskar, J., Sruthi, K., & Nedungadi, P. (2015). Hybrid approach for emotion classification of audio conversation based on text and speech mining. Procedia Computer Science, 46, 635–643. [Google Scholar]
- Bird, S., Klein, E., & Loper, E. (2009). Natural language processing with python. Sebastopol, CA: O’reilly Media, Inc. [Google Scholar]
- Bisson, J. I., Berliner, L., Cloitre, M., Forbes, D., Jensen, T. K., Lewis, C., … Shapiro, F. (2019). The international society for traumatic stress studies new guidelines for the prevention and treatment of posttraumatic stress disorder: Methodology and development process. Journal of Traumatic Stress, 32, 475–483. [DOI] [PubMed] [Google Scholar]
- Boals, A., & Klein, K. (2005). Word use in emotional narratives about failed romantic relationships and subsequent mental health. Journal of Language and Social Psychology, 24(3), 252–268. [Google Scholar]
- Boersma, P., & Weenink, D. (2019). Praat: Doing phonetics by computer [Computer program]. Retrieved from http://www.praat.org/
- Bormuth, J. R. (1969). Development of standards of readability: Toward a rational criterion of passage performance. Final report, U.S. Office of Education, Project No. 9-0237. Chicago, IL: University of Chicago. [Google Scholar]
- Bourla, A., Mouchabac, S., El Hage, W., & Ferreri, F. (2018). e-PTSD: An overview on how new technologies can improve prediction and assessment of posttraumatic stress disorder (PTSD). European Journal of Psychotraumatology, 9(sup1), 1424448. [DOI] [PMC free article] [PubMed] [Google Scholar]
- Bradley, R., Greene, J., Russ, E., Dutra, L., & Westen, D. (2005). A multidimensional meta-analysis of psychotherapy for PTSD. American Journal of Psychiatry, (162), 214–227. doi: 10.1176/appi.ajp.162.2.214 [DOI] [PubMed] [Google Scholar]
- Brewin, C. R., Dalgleish, T., & Joseph, S. (1996). A dual representation theory of posttraumatic stress disorder. Psychological Review, 103(4), 670. [DOI] [PubMed] [Google Scholar]
- Campbell, R. S., & Pennebaker, J. W. (2003). The secret life of pronouns: Flexibility in writing style and physical health. Psychological Science, 14(1), 60–65. [DOI] [PubMed] [Google Scholar]
- Chang, C. C., & Lin, C. J. (2011). A library for support vector machines. ACM Transactions on Intelligent Systems and Technology (TIST), 2, 3. [Google Scholar]
- Chung, C., & Pennebaker, J. W. (2007). The psychological functions of function words. In Fiedler K. (Ed.), Social communication (pp. 343–359). New York: Psychology Press. [Google Scholar]
- Cowie, R., Douglas-Cowie, E., Tsapatsoulis, N., Votsis, G., Kollias, S., Fellenz, W., & Taylor, J. G. (2001, January). Emotion recognition in human-computer interaction. IEEE Signal Processing Magazine, 18 32–80 [Google Scholar]
- Croisile, B., Ska, B., Brabant, M.-J., Duchene, A., Lepage, Y., Aimard, G., & Trillet, M. (1996). Comparative study of oral and written picture description in patients with Alzheimer’s disease. Brain and Language, 53(53), 1–19. [DOI] [PubMed] [Google Scholar]
- Crossley, S. A., Kyle, K., & McNamara, D. S. (2016). The tool for the automatic analysis of text cohesion (TAACO): Automatic assessment of local, global, and text cohesion. Behavior Research Methods, 48(4), 1227–1237. [DOI] [PubMed] [Google Scholar]
- D’Andrea, W., Chiu, P. H., Casas, B. R., & Deldin, P. (2012). Linguistic predictors of post-traumatic stress disorder symptoms following 11 september 2001. Applied Cognitive Psychology, 26(2), 316–323. [Google Scholar]
- De Lira, J. O., Ortiz, K. Z., Campanha, A. C., Bertolucci, P. H. F., & Minett, T. S. C. (2011). Microlinguistic aspects of the oral narrative in patients with Alzheimer’s disease. International Psychogeriatrics, 23(3), 404–412. [DOI] [PubMed] [Google Scholar]
- De Vries, G. J., & Olff, M. (2009). The lifetime prevalence of traumatic events and posttraumatic stress disorder in the Netherlands. Journal of Traumatic Stress, 22(4), 259–267. [DOI] [PubMed] [Google Scholar]
- Douma, W. H. (1960). De leesbaarheid van landbouwbladen: Een onderzoek naar en een toepassing van leesbaarheidsformules. Bulletin. Wageningen, Netherlands: Landbouw Hogeschool. [Google Scholar]
- Ehlers, A., & Clark, D. M. (2000). A cognitive model of chronic post-traumatic stress disorder. Behaviour Research and Therapy, 38(4), 319–345. [DOI] [PubMed] [Google Scholar]
- Ehlers, A., Clark, D. M., Hackmann, A., McManus, F., & Fennell, M. (2005). Cognitive therapy for post-traumatic stress disorder: Development and evaluation. Behaviour Research and Therapy, 43(4), 413–431. [DOI] [PubMed] [Google Scholar]
- Ehlers, A., Hackmann, A., & Michael, T. (2004). Intrusive re-experiencing in post-traumatic stress disorder: Phenomenology, theory, and therapy. Memory, 12(4), 403–415. [DOI] [PubMed] [Google Scholar]
- Flesch, R. (1948). A new readability yardstick. Journal of Applied Psychology, 32(3), 221. [DOI] [PubMed] [Google Scholar]
- Foa, E. B., Molnar, C., & Cashman, L. (1995). Change in rape narratives during exposure therapy for PTSD. Journal of Traumatic Stress, 8(4), 675–690. [DOI] [PubMed] [Google Scholar]
- Foa, E. B., & Rothbaum, B. O. (1998). Treating the trauma of rape: Cognitive-behavioral therapy for PTSD. New York: Guilford Press. [Google Scholar]
- Forbes-Riley, K., & Litman, D. J. (2004). Predicting emotion in spoken dialogue from multiple knowledge sources. In Proceedings of the Human Language Technology Conference of the North American Chapter of the Association for Computational Linguistics: HLT-NAACL 2004, Boston, MA. [Google Scholar]
- Forman, G. (2003). An extensive empirical study of feature selection metrics for text classification. Journal of Machine Learning Research, 3, 1289–1305. [Google Scholar]
- Fraser, K. C., Hirst, G., Graham, N. L., Meltzer, J. A., Black, S. E., & Rochon, E. (2014). Comparison of different feature sets for identification of variants in progressive aphasia. Workshop on Computational Linguistics and Clinical Psychology: from Linguistic Signal to Clinical Reality, 17–26. doi: 10.3115/v1/W14-3203 [DOI] [Google Scholar]
- Gersons, B. P. R., Carlier, I. V. E., Lamberts, R. D., & Van Der Kolk, B. A. (2000). Randomized clinical trial of brief eclectic psychotherapy for police officers with posttraumatic stress disorder. Journal of Traumatic Stress, 13(2), 333–347. [DOI] [PubMed] [Google Scholar]
- Gersons, B. P. R., Meewisse, M., Nijdam, M. J., & Olff, M. (2011). Protocol - Brief eclectic psychotherapy for posttraumatic stress disorder (BEP). Amsterdam, Netherlands: Academic Medical Centre, University of Amsterdam. [Google Scholar]
- Gil, T., Calev, A., Greenberg, D., Kugelmass, S., & Lerer, B. (1990). Cognitive functioning in post-traumatic stress disorder. Journal of Traumatic Stress, 3(1), 29–45. [Google Scholar]
- Gray, M. J., & Lombardo, T. W. (2001). Complexity of trauma narratives as an index of fragmented memory in PTSD: A critical analysis. Applied Cognitive Psychology, 15(7SPEC. ISS), 171–186. [Google Scholar]
- Grey, N., & Holmes, E. A. (2008). “Hotspots” in trauma memories in the treatment of post-traumatic stress disorder: A replication. Memory, 16(7), 788–796. [DOI] [PubMed] [Google Scholar]
- Grey, N., Holmes, E. A., & Brewin, C. R. (2001). Peritraumatic emotional “hotspots” in memory. Behavioural and Cognitive Psychotherapy, 29(3), 367–372. [Google Scholar]
- Grey, N., Young, K., & Holmes, E. (2002). Cognitive restructuring within reliving: A treatment for peritraumatic emotional “hotspots” in Posttraumatic Stress Disorder. Behavioural and Cognitive Psychotherapy, 30, 37–56. [Google Scholar]
- Halligan, S. L., Michael, T., Clark, D. M., & Ehlers, A. (2003). Posttraumatic stress disorder following assault: The role of cognitive processing, trauma memory, and appraisals. Journal of Consulting and Clinical Psychology, 71(3), 419–431. [DOI] [PubMed] [Google Scholar]
- He, Q., Veldkamp, B. P., & de Vries, T. (2012). Screening for posttraumatic stress disorder using verbal features in self narratives: A text mining approach. Psychiatry Research, 198(3), 441–447. [DOI] [PubMed] [Google Scholar]
- Hellawell, S. J., & Brewin, C. R. (2004). A comparison of flashbacks and ordinary autobiographical memories of trauma: Content and language. Behaviour Research and Therapy, 42(1), 1–12. [DOI] [PubMed] [Google Scholar]
- Holmes, E. A., & Grey, N. (2002). Hotspots manual: Third revision. London, England: Camden and Islington Mental Health and Social Care Trust, The Traumatic Stress Clinic. [Google Scholar]
- Holmes, E. A., Grey, N., & Young, K. A. D. (2005). Intrusive images and “hotspots” of trauma memories in posttraumatic stress disorder: An exploratory investigation of emotions and cognitive themes. Journal of Behavior Therapy and Experimental Psychiatry, 36(1SPEC. ISS), 3–17. [DOI] [PubMed] [Google Scholar]
- Howes, C., Purver, M., McCabe, R., Healey, P. G. T., & Lavelle, M. (2012). Predicting adherence to treatment for schizophrenia from dialogue transcripts. Proceedings of the 13th Annual Meeting of the Special Interest Group on Discourse and Dialogue (SIGDIAL) (pp. 79–83). Stroudsburg, PA: Association for Computational Linguistics. [Google Scholar]
- Hsu, C. W., Chang, C. C., & Lin, C. J. (2003). A Practical Guide to Support Vector Classification. (Technical Report). Taipei, Taiwan: Department of Computer Science, National Taiwan University. [Google Scholar]
- Iliou, T., & Anagnostopoulos, C. N. (2010). SVM - MLP - PNN classifiers on speech emotion recognition field - A comparative study. 5th International Conference on Digital Telecommunications, ICDT 2010 (pp. 1–6). doi: 10.1109/ICDT.2010.8 [DOI] [Google Scholar]
- Jacewicz, E., Fox, R. A., O’Neill, C., & Salmons, J. (2009). Articulation rate across dialect, age, and gender. Language Variation and Change, 21(2), 233–256. [DOI] [PMC free article] [PubMed] [Google Scholar]
- Jarrold, W., Peintner, B., Wilkins, D., Vergryi, D., Richey, C., Gorno-Tempini, M. L., & Ogar, J. (2014). Aided diagnosis of dementia type through computer-based analysis of spontaneous speech. Proceedings of the Workshop on Computational Linguistics and Clinical Psychology: From Linguistic Signal to Clinical Reality (pp. 27–37). doi: 10.3115/v1/W14-3204 [DOI] [Google Scholar]
- Jelinek, L., Stockbauer, C., Randjbar, S., Kellner, M., Ehring, T., & Moritz, S. (2010). Characteristics and organization of the worst moment of trauma memories in posttraumatic stress disorder. Behaviour Research and Therapy, 48(7), 680–685. [DOI] [PubMed] [Google Scholar]
- Joachims, T. (1998). Text categorization with support vector machines: Learning with many relevant features. In Proceedings of the 10th European Conference on Machine Learning ECML ’98 (pp. 137–142). Chemnitz, Germany: Springer Berlin Heidelberg. doi: 10.1007/BFb0026683 [DOI] [Google Scholar]
- Jones, C., Harvey, A. G., & Brewin, C. R. (2007). The organisation and content of trauma memories in survivors of road traffic accidents. Behaviour Research and Therapy, 45(1), 151–162. [DOI] [PubMed] [Google Scholar]
- Jurafsky, D., & Martin, J. H. (2009). Speech and language processing: An introduction to natural language processing, computational linguistics, and speech recognition. Upper Saddle River, NJ: Pearson Prentice Hall. [Google Scholar]
- Juslin, P. N., & Scherer, K. R. (2005). Vocal expression of affect. In Harrigan J. A., Rosenthal R., & Scherer K. R. (Eds.), The new handbook of methods in nonverbal behavior research (pp. 65–135). Oxford, UK: Oxford University Press. [Google Scholar]
- Kessler, R. C., Aguilar-Gaxiola, S., Alonso, J., Benjet, C., Bromet, E. J., Cardoso, G., … Koenen, K. C. (2017). Trauma and PTSD in the WHO world mental health surveys. European Journal of Psychotraumatology, 8(sup5), 1353383. [DOI] [PMC free article] [PubMed] [Google Scholar]
- Kincaid, J. P., Fishburne, R. P., Jr, Rogers, R. L., & Chissom, B. S. (1975). Derivation of new readability formulas (automated readability index, fog count and flesch reading ease formula) for navy enlisted personnel (p. 56). Orlando, FL: Institute for Simulation and Training, University of Central Florida. [Google Scholar]
- King, G., & Zeng, L. (2001). Logistic regression in rare events data. Political Analysis, 9(2), 137–163. [Google Scholar]
- Kisler, T., Reichel, U., & Schiel, F. (2017). Multilingual processing of speech via web services. Computer Speech and Language, 45, 326–347. Elsevier Ltd. [Google Scholar]
- Kuny, S. T., & Stassen, H. H. (1993). Speaking behavior and voice sound characteristics in depressive patients during recovery. Journal of Psychiatric Research, 27(3), 289–307. [DOI] [PubMed] [Google Scholar]
- Ladd, D. R., & Cutler, A. (1983). Introduction. Models and measurements in the study of prosody. In Cutler A. & Ladd D. R. (Eds.), Prosody: Models and measurements. Springer Series in Language and Communication (pp. 1–10). Berlin, Heidelberg: Springer. doi: 10.1007/978-3-642-69103-4_1 [DOI] [Google Scholar]
- Lamers, S. M. A., De Jong, F., Truong, K., Steunenberg, B., & Westerhof, G. (2014). Applying prosodic speech features in mental health care: An exploratory study in a life-review intervention for depression. Workshop on Computational Linguistics and Clinical Psychology, 61–68. doi: 10.3115/v1/W14-3208 [DOI] [Google Scholar]
- Lapp, D. (2006). The pyshics of music and musical instruments. Medford, Massachusetts: Wright Center for Science Education Tufts University. [Google Scholar]
- Lee, C. M., & Narayanan, S. (2005). Toward detecting emotions in spoken dialogs. IEEE Transactions on Speech and Audio Processing, 13(2), 293–303. [Google Scholar]
- Lefter, I., Rothkrantz, L. J. M., Van Leeuwen, D. A., & Wiggers, P. (2011). Automatic stress detection in emergency (telephone) calls. International Journal of Intelligent Defence Support Systems, 4(2), 148. [Google Scholar]
- Logan, B. (2000). Mel frequency cepstral coefficients for music modeling. Proceedings of the International Symposium on Music Information Retrieval (ISMIR) 2000 (pp. 1–11), Cambridge, MA. [Google Scholar]
- Manning, C. D., Raghavan, P., & Schütze, H. (2008). Introduction to Information Retrieval. Cambridge, MA: Cambridge University Press. [Google Scholar]
- Manning, C. D., & Schütze, H. (1999). Foundations of statistical natural language processing. Cambridge, MA: MIT Press. [Google Scholar]
- Mohammad, S. M., & Turney, P. D. (2010, June). Emotions evoked by common words and phrases: Using mechanical Turk to create an emotion lexicon. Proceedings of the NAACL HLT 2010 Workshop on Computational Approaches to Analysis and Generation of Emotion in Text (pp. 26–34), Los Angeles, CA. [Google Scholar]
- Mohammad, S. M., & Turney, P. D. (2013). Crowdsourcing a word-emotion association lexicon. Computational Intelligence, 29(3), 436–465. [Google Scholar]
- Nelson, K. L., & Horowitz, L. M. (2010). Narrative structure in recounted sad memories. Discourse Processes, 31(3), 307–324. [Google Scholar]
- Nijdam, M. J., & Wittmann, L. (2015). Psychological and social theories of PTSD. In Schnyder U. & Cloitre M. (Eds.), Evidence based treatments for trauma-related psychological disorders: A practical guide for clinicians (pp. 41–61). Switzerland: Springer International Publishing. doi: 10.1007/978-3-319-07109-1_3 [DOI] [Google Scholar]
- Nijdam, M. J., Baas, M. A. M., Olff, M., & Gersons, B. P. R. (2013). Hotspots in trauma memories and their relationship to successful trauma-focused psychotherapy: A pilot study. Journal of Traumatic Stress, 26, 38–44. [DOI] [PubMed] [Google Scholar]
- NLTK Project . (2019). Copyright © 2019 NLTK Project. Retrieved from http://www.nltk.org/
- O’Kearney, R., Hunt, A., & Wallace, N. (2011). Integration and organization of trauma memories and posttraumatic symptoms. Journal of Traumatic Stress, 24(6), 716–725. [DOI] [PubMed] [Google Scholar]
- O’Kearny, R., Speyer, J., & Kenardy, J. (2007). Children’s narrative memory for accidents and their post-traumatic distress. Applied Cognitive Psychology, 21(7), 821–838. [Google Scholar]
- Oakes, M., Gaaizauskas, R., Fowkes, H., Jonsson, A., Wan, V., & Beaulieu, M. (2001). A method based on the chi-square test for document classification. Proceedings of the 24th annual international ACM SIGIR conference on Research and development in information retrieval - SIGIR ’01 (pp. 440–441). doi: 10.1145/383952.384080 [DOI] [Google Scholar]
- Olff, M. (2015). Mobile mental health: A challenging research agenda. European Journal of Psychotraumatology, 6(1), 27882. [DOI] [PMC free article] [PubMed] [Google Scholar]
- Olff, M., Monson, C., Riggs, D., Lee, C., Ehlers, A., & Forbes, D. (in press). Psychological treatments for adults with PTSD: Core and common elements of effective treatment. In Forbes D., Monson C., Berliner L., & Bisson J. I. (Eds.), Effective treatments for PTSD (3rd ed.). [Google Scholar]
- Orimaye, S. O., Wong, J. S. M., & Golden, K. J. (2014). Learning predictive linguistic features for Alzheimer’s disease and related dementias using verbal utterances. In Proceedings of the workshop on computational linguistics and clinical psychology: From linguistic signal to clinical reality (pp. 78–87). doi: 10.3115/v1/W14-3210 [DOI] [Google Scholar]
- Park, H., Rogalski, Y., Rodriguez, A. D., Zlatar, Z., Benjamin, M., Harnish, S., … Reilly, J. (2011). Perceptual cues used by listeners to discriminate fluent from nonfluent narrative discourse. Aphasiology, 25(9), 998–1015. [DOI] [PMC free article] [PubMed] [Google Scholar]
- Pedregosa, F., Varoquaux, G., Gramfort, A., Michel, V., Thirion, B., Grisel, O., … Duchesnay, E. (2011). Scikit-learn: Machine learning in python. Journal of Machine Learning Research, 12, 2825–2830. [Google Scholar]
- Pennebaker, J. W. (1993). Putting stress into words: Health, linguistic, and therapeutic implications. Behaviour Research and Therapy, 31(6), 539–548. [DOI] [PubMed] [Google Scholar]
- Pennebaker, J. W., Francis, M. E., & Booth, R. J. (2001). Linguistic inquiry and word count: LIWC 2001 [Software]. Mahway: Lawrence Erlbaum Associates. [Google Scholar]
- Pennebaker, J. W., Mehl, M. R., & Niederhoffer, K. G. (2003). Psychological aspects of natural language use: Our words, our selves. Annual Review of Psychology, 54, 547–577. [DOI] [PubMed] [Google Scholar]
- Perkins, J. (2014). Python 3 text processing with NLTK 3 cookbook. Birmingham, UK: Packt Publishing Ltd. [Google Scholar]
- Pillemer, D. B., Desrochers, A. B., & Ebanks, C. M. (1998). Autobiographical memory: Theoretical and applied perspectives. In Thompson C. P., Herrmann D. B., Read J. D., Payne G., & Toglia M. P. (Eds.), Remembering the past in the present: Verb tense shifts in autobiographical memory narratives (pp. 145–162). New York: Lawrence Erlbaum Associates. [Google Scholar]
- Poerner, N., & Schiel, F. (2016). An automatic chunk segmentation tool for long transcribed speech recordings. Proceedings of the Phonetics & Phonology Conference (pp. 6–8), Munich, Germany. [Google Scholar]
- Porter, M. (2001). Snowball stemmer [stemming algorithm]. Retrieved from http://snowballstem.org/
- Python Software Foundation . (2019). Copyright © 2001-2019 python software foundation; All rights reserved. Retrieved from https://www.python.org/
- Richards, D., & Lovell, K. (1999). Post-traumatic stress disorders: Concepts and therapy. In Yule W. (Ed.), Behavioural and cognitive behavioural interventions in the treatment of PTSD (pp. 239–266). Chichester: Wiley. [Google Scholar]
- Rizzo, A. S., & Shilling, R. (2017). Clinical virtual reality tools to advance the prevention, assessment, and treatment of PTSD. European Journal of Psychotraumatology, 8(sup5), 1414560. [DOI] [PMC free article] [PubMed] [Google Scholar]
- Roach, P. (2000). Techniques for the phonetic description of emotional speech. Invited Review Paper, ITRW on Speech and Emotion, 53–59. doi: 10.1051/0004-6361/201220577 [DOI] [Google Scholar]
- Römisch, S., Leban, E., Habermas, T., & Döll-Hentschker, S. (2014). Evaluation, immersion, and fragmentation in emotion narratives from traumatized and nontraumatized women. Psychological Trauma: Theory, Research, Practice, and Policy, 6, 465–472. [Google Scholar]
- Rude, S. S., Gortner, E. M., & Pennebaker, J. W. (2004). Language use of depressed and depression-vulnerable college students. Cognition and Emotion, 18(8), 1121–1133. [Google Scholar]
- Scherer, K. R. (2003). Vocal communication of emotion: A review of research paradigms. Speech Communication, 40(1), 227–256. [Google Scholar]
- Scherer, K. R., Johnstone, T., & Klasmeyer, G. (2003). Vocal expression of emotion. In Davidson R. J., Scherer K. R., & Goldsmith H. H. (Eds.), Series in affective science. Handbook of affective sciences (pp. 433–456). New York, NY: Oxford University Press. [Google Scholar]
- Scherer, S., Stratou, G., Lucas, G., Mahmoud, M., Boberg, J., Gratch, J., … Morency, L. P. (2013). Automatic audiovisual behavior descriptors for psychological disorder analysis. Image and Vision Computing, 32(10), 648–658. [Google Scholar]
- Schmid, H. (1999). Improvements in part-of-speech tagging with an application to German. In S. Armstrong, K. Church, P. Isabelle, S. Manzi, E. Tzoukermann, & D. Yarowsky (Eds.), Natural language processing using very large corpora (pp. 13–25). Dordrecht: Springer. [Google Scholar]
- Schnyder, U., Ehlers, A., Elbert, T., Foa, E. B., Gersons, B. P. R., Resick, P. A., … Cloitre, M. (2015). Psychotherapies for PTSD: What do they have in common? European Journal of Psychotraumatology, 6(1), 28186. [DOI] [PMC free article] [PubMed] [Google Scholar]
- Schoentgen, J. (2006). Vocal cues of disordered voices: An overview. Acta Acustica United with Acustica, 92(5), 667–680. [Google Scholar]
- Schuller, B., Villar, R. J., Rigoll, G., & Lang, M. (2005). Meta-classifiers in acoustic and linguistic feature fusion-based affect recognition. Proceedings (ICASSP ’05). IEEE International Conference on Acoustics, Speech, and Signal Processing (pp. 325–328), Philadelphia, PA. [Google Scholar]
- Shapiro, F. (2001). Eye movement desensitization and reprocessing: Basic principles, protocols and procedures. New York: Guilford Press. [Google Scholar]
- Shaw, R. J., Harvey, J. E., Nelson, K. L., Gunary, R., Kruk, H., & Steiner, H. (2001). Linguistic analysis to assess medically related posttraumatic stress symptoms. Psychosomatics, 42(1), 35–40. [DOI] [PubMed] [Google Scholar]
- Shen, D., Sun, J. T., Yang, Q., & Chen, Z. (2006). Text classification improved through multigram models. Proceedings of the 15th ACM International Conference on Information and Knowledge Management (pp. 672–681). doi: 10.1145/1183614.1183710 [DOI] [Google Scholar]
- Shen, P., Changjun, Z., & Chen, X. (2011). Automatic speech emotion recognition using support vector machine. International Conference on Electronic & Mechanical Engineering and Information Technology, IEEE (pp. 621–625), Harbin, China. [Google Scholar]
- Shriberg, E. (2001). To ‘errrr’is human: Ecology and acoustics of speech disfluencies. Journal of the International Phonetic Association, 31(1), 153–169. [Google Scholar]
- Stone, L. D., & Pennebaker, J. W. (2002). Trauma in real time: Talking and avoiding online conversations about the death of princess diana. Basic and Applied Social Psychology, 78712, 1–36. [Google Scholar]
- Tan, C. M., Wang, Y. F., & Lee, C. D. (2002). The use of bigrams to enhance text categorization. Information Processing and Management, 38(4), 529–546. [Google Scholar]
- Tanaka, H., Sakti, S., Neubig, G., Toda, T., & Nakamura, S. (2014). Linguistic and acoustic features for automatic identification of autism spectrum disorders in children’s narrative. Proceedings of the workshop on computational linguistics and clinical psychology: From linguistic signal to clinical reality (pp. 88–96), Baltimore, MD. [Google Scholar]
- Tausczik, Y. R., & Pennebaker, J. W. (2010). The psychological meaning of words: LIWC and computerized text analysis methods. Journal of Language and Social Psychology, 29(1), 24–54. [Google Scholar]
- Truong, K. P., & Raaijmakers, S. (2008). Automatic recognition of spontaneous emotions in speech using acoustic and lexical features. In Popescu-Belis A. & Stiefelhagen R. (Eds.), Machine learning for multimodal interaction. MLMI 2008. Lecture notes in computer science (Vol. 5237, pp. 161–172). Berlin Heidelberg: Springer-Verlag. [Google Scholar]
- Uddo, M., Vasterling, J. J., Brailey, K., & Sutker, P. B. (1993). Memory and attention in combat-related post-traumatic stress disorder (PTSD). Journal of Psychopathology and Behavioral Assessment, 15(1), 43–52. [Google Scholar]
- Van Den Broek, E. L., Van Der Sluis, F., & Dijkstra, T. (2009). Therapy progress indicator (TPI): Combining speech parameters and the subjective unit of distress. Proceedings of the 3rd International Conference on Affective Computing and Intelligent Interaction and Workshops, ACII 2009 (pp. 2–7). doi: 10.1109/ACII.2009.5349554 [DOI] [Google Scholar]
- Van Miltenburg, E. (2015). Dutch tagger. Retrieved from https://github.com/evanmiltenburg/Dutch-tagger
- van Wijk, C., & Kempen, G. (1980). Funktiewoorden - een Inventarisatie voor het Nederlands - An inventory of Dutch function words. ITL - International Journal of Applied Linguistics, 47(May), 53–68. [Google Scholar]
- Vapnik, V. (1995). The nature of statistical learning. New York, NY: Wiley. [Google Scholar]
- Vergyri, D., Knoth, B., Shriberg, E., Mitra, V., Mclaren, M., Ferrer, L., … Marmar, C. (2015). Speech-based assessment of PTSD in a military population using diverse feature classes. Proceedings of Interspeech 2015 (pp. 3729–3733), Dresden, Germany. [Google Scholar]
- Ververidis, D., & Kotropoulos, C. (2006). Emotional speech recognition: Resources, features, and methods. Speech Communication, 48(9), 1162–1181. [Google Scholar]
- Wiegersma, S., Van Noije, A. J., Sools, A. M., & Veldkamp, B. P. (n.d.). Supervised text classification: A tool and tutorial for model selection and evaluation. [Google Scholar]
- Wild, J., Warnock-Parkes, E., Grey, N., Stott, R., Wiedemann, M., Canvin, L., … Ehlers, A. (2016). Internet-delivered cognitive therapy for PTSD: A development pilot series. European Journal of Psychotraumatology, 7(1), 31019. [DOI] [PMC free article] [PubMed] [Google Scholar]
- Wilson, D., & Wharton, T. (2006). Relevance and prosody. Journal of Pragmatics, 38(10), 1559–1579. [Google Scholar]
- Wolf, M., Sedway, J., Bulik, C. M., & Kordy, H. (2007). Linguistic analyses of natural written language: Unobtrusive assessment of cognitive style in eating disorders. International Journal of Eating Disorders, 40(8), 711–717. [DOI] [PubMed] [Google Scholar]
- Yang, Y. (1997). An evaluation of statistical approaches to text categorization. Information Retrieval, 1(1), 69–90. [Google Scholar]
- Yang, Y., & Pedersen, J. O. (1997). A comparative study on feature selection in text categorization. Fourteenth International Conference on Machine Learning (ICML) (pp. 412–420), Nashville, TN. [Google Scholar]
- Zijlstra, H., Van Meerveld, T., Van Middendorp, H., Pennebaker, J. W., & Geenen, R. (2004). De Nederlandse versie van de LIWC. Gedrag & Gezondheid, 32(4), 271–281. [Google Scholar]
- Zoellner, L. A., Alvarez-Conrad, J., & Foa, E. B. (2002). Peritraumatic dissociative experiences, trauma narratives, and trauma pathology. Journal of Traumatic Stress, 15(49), 49–57. [DOI] [PubMed] [Google Scholar]
Associated Data
This section collects any data citations, data availability statements, or supplementary materials included in this article.
Data Citations
- Bansal, S., & Aggarwal, C. (2018). Textstat [Python package]. Retrieved from https://pypi.org/project/textstat/
- Boersma, P., & Weenink, D. (2019). Praat: Doing phonetics by computer [Computer program]. Retrieved from http://www.praat.org/
- NLTK Project . (2019). Copyright © 2019 NLTK Project. Retrieved from http://www.nltk.org/