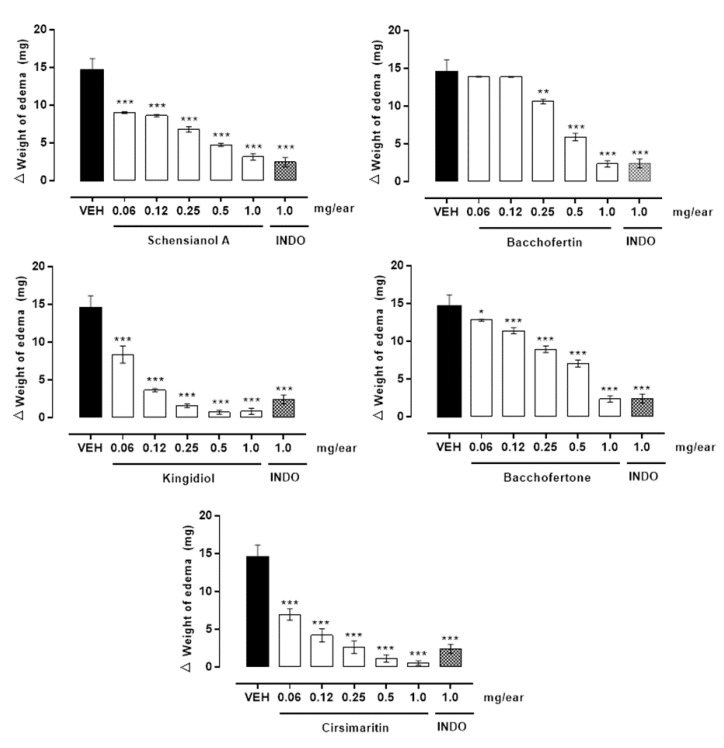
Figure 4.
Curve dose-response of isolated compounds from B. conferta on TPA-induced ear edema. Each treatment with TPA (VEH) immediately before the application of schensianol A (1), bacchofertin (2), kingidiol (3), bacchofertone (5), hispidulin (6) and cirsimaritin (7). The bars show the mean ± S.E.M. of the weight difference in milligrams (mg) (n = 5) 6 h after TPA application. Significantly different from VEH, *p ˂ 0.05, **p ˂ 0.01, ***p ˂ 0.0001.

