

Abstract
Background
Granulopoiesis‐stimulating factors, such as granulocyte‐colony‐stimulating factor (G‐CSF) and granulocyte‐macrophage‐colony‐stimulating factor (GM‐CSF), are being used to prevent febrile neutropenia and infection in patients undergoing treatment for malignant lymphoma. The question of whether G‐CSF and GM‐CSF improve dose intensity, tumour response, and overall survival in this patient population has not been answered yet. Since the results from single studies are inconclusive, a systematic review was undertaken.
Objectives
To determine the effectiveness of G‐CSF and GM‐CSF in patients with malignant lymphoma with respect to preventing neutropenia, febrile neutropenia and infection; improving quality of life, adherence to treatment protocol, tumour response, freedom from treatment failure (FFTF) and overall survival (OS); and adverse effects.
Search methods
We searched The Cochrane Library, MEDLINE, EMBASE, CancerLit, and other relevant literature databases; Internet databases of ongoing trials; and conference proceedings of the American Society of Clinical Oncology and the American Society of Hematology (1980 ‐ 2007). We included full‐text and abstract publications as well as unpublished data.
Selection criteria
Randomised controlled trials comparing prophylaxis with G‐CSF or GM‐CSF versus placebo/no prophylaxis in adult patients with malignant lymphoma undergoing chemotherapy were included for review. Both study arms had to receive identical chemotherapy and supportive care.
Data collection and analysis
Trial eligibility and quality assessment, data extraction and analysis were done by two reviewers independently. Authors were contacted to obtain missing data.
Main results
We included 13 eligible randomised controlled trials with 2607 randomised patients. Compared with no prophylaxis, both G‐CSF and GM‐CSF did not improve overall survival (hazard ratio 0.97; 95% CI 0.87 to 1.09) or FFTF (hazard ratio 1.11; 95% CI 0.91 to 1.35). Prophylaxis significantly reduced the relative risk (RR) for severe neutropenia (RR 0.67; 95% confidence interval (CI) 0.60 to 0.73), febrile neutropenia (RR 0.74; 95% CI 0.62 to 0.89) and infection (RR 0.74; 95% CI 0.64 to 0.85). There was no evidence that either G‐CSF or GM‐CSF reduced the number of patients requiring intravenous antibiotics (RR 0.82; 95%CI 0.57 to 1.18); lowered infection related mortality (RR 0.93; 95% CI 0.51 to 1.71); or improved complete tumour response (RR 1.03; 95% CI 0.95 to 1.10).One study evaluated quality of life parameters and found no differences between the treatment groups.
Authors' conclusions
G‐CSF and GM‐CSF, when used as a prophylaxis in patients with malignant lymphoma undergoing conventional chemotherapy, reduce the risk of neutropenia, febrile neutropenia and infection. However, based on the randomised trials currently available, there is no evidence that either G‐CSF or GM‐CSF provide a significant advantage in terms of complete tumour response, FFTF or OS.
Plain language summary
Granulopoiesis‐stimulating factors in the prevention of adverse effects during the therapeutic treatment of malignant lymphoma.
Lymphoma is a cancer that begins in the lymph nodes. It can be treated with chemotherapy (anti‐cancer drugs), but this disrupts the immune system and lowers white cell counts. This can increase a person's risk of infection and limit the amount of chemotherapy that can be given. Granulopoiesis‐stimulating factors (GSF) can increase the body's production of white cells. The review found that treatment with GSF increases white cell counts and reduces the risk of infection in people receiving chemotherapy for lymphoma. However, GSF treatment did not improve survival. More research is needed to improve GSF treatments.
Background
Description of the condition
Malignant lymphomas are a heterogeneous group of neoplastic disorders that develop in lymphatic cells (Freedman 1999). These tumours usually originate in lymph nodes and spread along the lymphatic system, involving lymphatic tissues such as lymph nodes and the spleen. Malignant cells can also infiltrate non‐lymphatic tissues such as bone, liver, lung and, less frequently, skin and brain, either by haematogenesis or by invasion of adjacent tumour masses. Based on their distinct histology, malignant lymphomas are classified as Hodgkin's disease (HD) or non‐Hodgkin's lymphoma (NHL). The incidence of HD is steady, affecting 3 people out of every 100,000 per year in Europe and Northern America, whereas the incidence of NHL has increased in recent years. Nowadays 14 people in 100,000 are affected by NHL every year (Engert 1994). The aetiology of malignant lymphoma remains unclear. An association with viral infections, such as Epstein‐Barr virus, and genetic predisposition are being discussed (Engert 1994; Herrmann 1998). Depending on their histological classification, stage and prognostic factors, malignant lymphomas are treated with chemotherapy, radiotherapy or both. One limiting factor in the treatment of malignant lymphoma is the myelosuppressive side effect of cytotoxic drugs. Myelosuppression is characterised by leucopenia, anaemia and thrombocytopenia. Neutropenia, neutropenic fever and neutropenia‐related infections are dose‐limiting events during chemotherapy. The risk of febrile neutropenia and subsequent infection is directly related to the degree and duration of neutropenia (Bodey 1966; Bodey 1986). Febrile neutropenia and neutropenia‐related infections can result in longer hospital stays and higher mortality. Consequently, reducing the dose of cytostatic drugs or increasing the interval between treatment courses is often required (Talcott 1992; Klastersky 2000). The Goldie‐Coldman hypothesis suggests that the application of the intended dose on time may improve tumour response and overall survival (Goldie 1983). Therefore, reducing the intended dose intensity is clinically undesirable (Hryniuk 1984; Hryniuk 1986; Hryniuk 1987). In this context, malignant lymphomas are of particular interest since they have been shown to be chemosensitive, both in experimental models (Skipper 1990) and in retrospective clinical analyses (DeVita 1987; Armitage 1993; Lepage 1993).
Description of the intervention
Haematopoietic growth factors, such as granulocyte‐colony‐stimulating factor (G‐CSF) and granulocyte‐macrophage‐colony‐stimulating factor (GM‐CSF), stimulate haematopoietic progenitors, thereby increasing the number of functional neutrophils (Lopez 1986; Bronchud 1988; Crawford 1991). These drugs were introduced in an attempt to prevent and treat neutropenia, neutropenic fever and neutropenia‐related infections. G‐CSF predominantly augments the proliferation, maturation and release of neutrophils (Roskos 1998; Dempke 2000), whereas GM‐CSF enhances the proliferation and differentiation of macrophages as well (Dempke 2000). The most common side effect of G‐CSF is bone pain; other less common side effects are myalgia and elevation of lactate dehydrogenase, uric acid and serum and leucocyte alkaline phosphatase levels. Less frequently, patients may also suffer from exacerbation of pre‐existing inflammatory conditions such as psoriasis, vasculitis or eczema. GM‐CSF has similar side effects, although injection site reactions are seen more often. Patients also complain of bone pain, myalgia, fever, nausea, fatigue, headache and chills (ASCO Guidelines 1994). Clinical trials indicate that both G‐CSF and GM‐CSF decrease fever incidence and the incidence and duration of neutropenia after standard chemotherapy (Morstyn 1988; Yoshida 1990; Hovgaard 1992). However, the scant results from prospective, randomised studies directly comparing G‐CSF and GM‐CSF are inconclusive, and it is unknown which of these agents is superior (Lydaki 1995; Magrath 1997; Beveridge 1998; Deb 1998; Alvarado Ibarra 1999; Bennett 2000a). In a meta‐analysis of patients with solid cancers or lymphoma, pegfilgrastim reduced the incidence of febrile neutropenia. However, only 15% of patients had malignant lymphoma (Pinto 2007).
Although G‐CSF and GM‐CSF are cost intensive drugs, economic evaluations have demonstrated an overall cost reduction from reduced antibiotic use and shorter hospital stays (Bow 1998). However, this economic benefit is achieved only in specific clinical settings, and the controversy over defining economic thresholds continues (Souêtre 1994; Zagonel 1994; Bobey 1998; Lyman 1998; ASCO Guidelines 2000; Bennett 2000b; Lyman 2000; EORTC Guidelines 2006; ASCO Guidelines 2006).
Why it is important to do this review
The considerable uncertainty surrounding the clinical use of these agents led the American Society of Clinical Oncology (ASCO) to set up guidelines in 1994 for the use of G‐CSF and GM‐CSF in the treatment of both solid and haematological malignancies (updated in 1996, 2000 and 2006) in order to avoid infectious complications and maintain dose intensities. The current ASCO guidelines recommend the primary administration of G‐CSF and GM‐CSF in clinical settings where the expected risk of suffering febrile neutropenia is at least 20%. This threshold was reduced from 40% in 2005, following the publication of two trials in patients with solid tumours and a risk of febrile neutropenia in the control arm between 19% in one study (Vogel 2005) and 32% with concomitant antibiotic prophylaxis int the other study (Timmer‐Bonte 2005). Granulopoiesis‐stimulating factors are also recommended for patients who have developed febrile neutropenia in a previous chemotherapy cycle or when the alternative of reducing the chemotherapy dose is not appropriate (secondary prophylaxis). G‐CSF and GM‐CSF were not recommended as a supportive measure to increase chemotherapy dosages beyond standard regimens outside of a clinical trial (ASCO Guidelines 2006). Systematic reviews on the effectiveness of G‐CSF in the chemotherapeutic treatment of solid and haematological malignancies provided evidence that G‐CSF reduced the incidence of febrile neutropenia (Rusthoven 1998; Kuderer 2007). However, the relevance of the results with respect to malignant lymphoma are questionable since both reviews only included a limited number of lymphoma trials. For example, the review by Kuderer 2007 only included 5 trials with lymphoma patients (Ösby 2003;Doorduijn 2003; Gisselbrecht 1997; Zinzani 1997; Pettengell 1992), compared to 12 trials published during their search period. Another systematic review assessing the effectiveness of G‐CSF and GM‐CSF in the treatment of haematological tumours has not been published in full and cannot be assessed in detail (Hackshaw 2004). Therefore, the critical question of whether G‐CSF and GM‐CSF improve dose intensity, tumour response and overall survival in the treatment of malignant lymphoma remains unanswered.
Since current evidence based information on the use of G‐CSF and GM‐CSF is inconclusive in a number of key questions and includes only parts of the existing literature, we conducted a comprehensive systematic review. In the first publication of this review we included 11 prospectively randomised studies with a total of 1431 patients, the first update included 12 trials with 1820 patients. We now present the second update, which includes 13 trials with 2604 randomised patients. All patients had either HD or NHL and received standard chemotherapy with or without G‐CSF or GM‐CSF prophylaxis. The outcome measures examined included overall survival (OS), freedom from treatment failure (FFTF), risk and duration of neutropenia and febrile neutropenia, infection, mortality, received dose intensity, tumour response, adverse events and quality of life.
Objectives
We conducted a systematic review of randomised controlled trials of patients with malignant lymphoma to determine the effectiveness of G‐CSF and GM‐CSF in:
improving OS and FFTF (primary outcome measures);
decreasing the risk and duration of neutropenia and febrile neutropenia, infection and mortality during chemotherapy; improving received dose intensity, tumour response and quality of life (secondary outcome measures). Adverse effects were also assessed.
Methods
Criteria for considering studies for this review
Types of studies
Only randomised controlled trials comparing G‐CSF or GM‐CSF prophylaxis with placebo/no prophylaxis were included. Studies on long lasting G‐CSF preparations such as filgrastim are eligible as well (this inclusion criterion was added in 2008). Crossover studies, quasi‐randomised, e.g. treatment allocation alternate or by date of birth, and non‐randomised comparative studies were excluded. Studies with less than ten lymphoma patients per study arm were disqualified. Abstracts and unpublished data were included if sufficient information on study design, patient characteristics, interventions and outcomes was available. Otherwise they were excluded or included with reservations.
Types of participants
Eligible patients were older than 16 years and had NHL or HD confirmed by biopsy. The following histological classifications were admitted: Working Formulation, Kiel‐, REAL‐ and WHO‐classification. Acute and chronic leukaemias, including chronic lymphatic leukaemia, multiple myeloma and human immunodeficiency virus (HIV) associated lymphoma were excluded because they include disease specific immunodeficiencies that may confound the results.
Types of interventions
G‐CSF or GM‐CSF had to be given at doses of at least 1 µg/kg/day, intravenously or subcutaneously, as primary prophylaxis during a standard non‐myeloablative chemotherapy prior to the onset of neutropenia in the first‐ or second‐line treatment of malignant lymphoma. G‐CSF or GM‐CSF had to be given within 72 hours of administering cytotoxic substances and in each cycle of chemotherapy. The control group had to receive an identical chemotherapy regimen and, apart from G‐CSF or GM‐CSF, the same supportive care, e.g. antibiotic prophylaxis, in addition to a placebo or no prophylaxis. Trials investigating the sequential administration of G‐CSF or GM‐CSF, or their secondary prophylactic administration and therapeutic use in established neutropenia and febrile neutropenia, were excluded, as were trials on myeloablative chemotherapy regimens with consecutive stem cell support.
Types of outcome measures
Primary outcomes
overall survival;
freedom from treatment failure.
Secondary outcomes
quality of life;
risk and duration of neutropenia;
risk and duration of febrile neutropenia;
infection;
mortality during chemotherapy;
received dose intensity of chemotherapy;
tumour response (complete response);
adverse effects of G‐CSF and GM‐CSF;
risk and duration of parenteral antibiotic treatment;
hospitalisation;
risk and duration of thrombocytopenia and anaemia.
Search methods for identification of studies
Electronic searches
We searched the Cochrane Central Register of Controlled Trials (CENTRAL), MEDLINE, EMBASE, CancerLit, Medikat, Russmed Articles, SOMED, Toxline, BIOSIS Previews and LILACS. The search covered the time period from January 1980 to April 21 2008. No language restriction was applied. In databases other than CENTRAL, we used the highly sensitive search strategy for identifying reports of randomised controlled trials developed by Dickersin 1994. See Appendix 1 for the MEDLINE search strategy. This search strategy was adapted for use in the other databases.
We also searched internet databases of grey literature (SIGLE) and ongoing trials as follows. These websites were last checked for relevant trials in April 2008.
www.controlled‐trials.com
http://clinicaltrials.nci.nih.gov
http://clinicaltrials.gov/ct/gui
www.eortc.be/
www.ctc.usyd.edu.au/
www.trialscentral.org/index.html
Searching other resources
We handsearched the conference proceedings of the American Society of Clinical Oncology (1980 to August 2007) and the American Society of Hematology (1980 to 2007) and two medical journals: American Journal of Hematology and Annals of Hematology. Citations of all trials identified in the search were checked for additional references. We also contacted experts in the field and pharmaceutical companies (Amgen, Chugai, Novartis Pharma, Janssen‐Cilag, Sandoz, Schering‐Plough) for additional unpublished or ongoing trials.
Data collection and analysis
Selection of studies
Titles and abstracts of studies identified from the above sources were screened independently by two reviewers (JB, MR, CH) according to the eligibility criteria. If this could not be done satisfactorily from the title and abstract, the full‐text was obtained. Studies that met the inclusion criteria were assessed with an eligibility form, which contained the following questions.
Is the study described as randomised?
Did the participants in the study have malignant lymphoma?
Were the participants at risk of febrile neutropenia?
Were the participants adults ( > 16 years of age)?
Was one group (treatment group) given G‐CSF or GM‐CSF subcutaneously or intravenously (not per os) after the course of chemotherapy in a dose of at least 1 µg/kg/day?
Were the groups treated identically (identical chemotherapy and supportive care such as antibiotic prophylaxis) other than for the named intervention?
Did the study document dose intensity and tumour response or febrile neutropenia?
Studies had to meet all of the above criteria to be eligible. If there was insufficient information to judge eligibility, the first author of the study or report was contacted for clarification. Any disagreements between the reviewers were resolved by discussion. Any duplicate reports were identified. Full‐text versions of all eligible studies were obtained for quality assessment and data extraction.
Data extraction and management
Data on study design, patient characteristics, interventions and outcome were extracted independently by two reviewers (MR, JB and CH) using a previously designed data extraction form that included the following items.
General information: title, authors, source, contact address, country, language and year of publication, duplicate publications, sponsors and trial setting.
Trial characteristics such as inclusion and exclusion criteria, sample size, diagnostic criteria, assessment of compliance;, method of randomisation, concealment of allocation and blinding of patients, care givers and outcome assessors, withdrawals, losses to follow up and intention‐to‐treat analysis were extracted separately with a validity form.
Interventions: placebo, intervention and co‐medication including dose, route and timing.
Patients: sample size, disease and baseline characteristics.
Outcomes: outcomes as specified above.
Disagreements arising at any stage were resolved by discussion and consensus. All authors were contacted to obtain missing data on study design, characteristics of patients, interventions and primary and selected secondary outcome measures (rate and duration of neutropenia and febrile neutropenia, mortality during and after chemotherapy, complete response, FFTF and OS).
Assessment of risk of bias in included studies
Study quality was assessed independently by two unblinded reviewers (JB, MR, CH). Any disagreements were discussed within the group until consensus was reached. Quality was assessed using an in‐house assessment form that has not been validated (sources used: Jadad 1996; Verhagen 1998). The following criteria were considered.
Was the randomisation method satisfactory?
Was treatment allocation concealed?
Were the groups similar at baseline regarding the most important prognostic factors?
Was treatment allocation masked from the participants?
Was treatment allocation masked from the clinicians?
Was treatment allocation masked from the outcome assessors?
Was the number of withdrawals, dropouts and losses to follow‐up in each group stated?
Was an intention‐to‐treat analysis included in the data analysis?
We defined important prognostic factors as age, gender, performance status, stage of disease, presence of B‐symptoms, above normal lactate dehydrogenase concentration, bone marrow involvement and untreated, resistant or relapsed disease. We explored the influence of individual quality criteria in a sensitivity analysis.
Data synthesis
For statistical analysis, we used RevMan 5, R and STATA. To estimate OS and FFTF, hazard ratios (HR) were calculated. If individual patient data were not available we extracted and analysed data from the published survival curves using methods described by Parmar 1998. For binary data, relative risks (RR) and 95% confidence intervals (CI)were calculated for each trial and the Mantel‐Haenszel method was used for pooling. The results were pooled using a fixed effect model. Number needed to treat and number needed to harm, with corresponding confidence intervals, were calculated for ease of interpretation. Continuous data were calculated as weighted mean differences with 95% CI and summarised, if appropriate. Heterogeneity of treatment effect between trials was tested using a chi squared statistic with significance set at P < 0.05. The robustness of the overall results and causes of heterogeneity were assessed by sensitivity and subgroup analyses as described below. In meta‐analyses of at least four trials, a funnel plot was generated and a linear regression test (Egger 1997) was performed to examine the presence of bias. A probability value of less than 0.1 was considered significant for the linear regression test. All data included were based on 'intention‐to‐treat' or 'full set analysis' as defined by ICH 1999. Data based on 'per protocol analysis' were not included.
Subgroup analysis and investigation of heterogeneity
The clinical and methodological diversity of the included studies, as well as the statistical heterogeneity of selected results were analysed according to the following criteria.
Type of drug (G‐CSF compared to GM‐CSF);
HD versus NHL;
Age (trials restricted to age > 60 years versus trials including all ages);
Administration of prophylactic antibiotic drugs during chemotherapy;
Different toxicity of chemotherapy regimens: chemotherapies applied in the different studies may differ in their specific haematological toxicity. The haemato‐toxicity of different chemotherapy regimens was categorised indirectly by means of the incidence of neutropenia in the control group.
Sensitivity analysis
Placebo controlled studies versus open label studies;
Concealment of allocation;
Size of studies (including less than 100 patients versus at least 100 patients);
Published versus unpublished, unreported or abstract based data;
Duration of follow‐up
Results
Description of studies
The electronic update search from August 2003 to April 2008 retrieved 306 abstracts. Of these 3 were retrieved for an evaluation of the full text and one was included in the updated version of the review.
Please note: previously unreported data and unpublished studies are marked with an asterix (*).
Eligible studies We identified 16 randomised controlled trials that met our inclusion criteria. Of these trials, three additional follow‐up reports (Engelhard 1994; Gerhartz 1994a; Zinzani 1999) and an economic analysis of identical patient data (Souêtre 1994) were identified. Two of the 16 studies were excluded. One study of 100 patients has not been published (Unpublished trial), while the other study was published only as an interim analysis and did not report any useable data (as part of a multicenter trial, N = 14) (Liberati 1991). We were unable to obtain data from the original investigators for either of these studies. In addition, we initially identified three studies that were ongoing (Blay; Cunningham; Doorduijn 2003). Two of these (Cunningham; Doorduijn 2000) were published in the meantime and are included in the present updated review (Doorduijn 2003; Burton 2006).
Included studies
Thirteen randomised studies with a total of 2607 randomised patients were analysed (Cunningham*; Pettengell 1992; Bastion 1993; Gerhartz 1993; Avilés 1994; Fridrik 1997; Gisselbrecht 1997; Zinzani 1997; Dunlop 1998; Aglietta 2000; Doorduijn 2003; Ösby 2003; Burton 2006) (see 'Characteristics of included studies' table). All trials were reported in English. All first authors were contacted to obtain unreported data. We obtained additional information on study design, patient characteristics and selected outcome data for nine trials (Cunningham*; Avilés 1994; Fridrik 1997; Zinzani 1997; Gisselbrecht 1997; Dunlop 1998; Björkholm 1999; Aglietta 2000; Doorduijn 2003).
Eleven studies evaluated G‐CSF (Cunningham*; Pettengell 1992; Bastion 1993; Avilés 1994; Fridrik 1997; Gisselbrecht 1997; Zinzani 1997; Dunlop 1998; Doorduijn 2003; Ösby 2003; Burton 2006) and two studies evaluated GM‐CSF versus placebo or no treatment (Gerhartz 1993; Aglietta 2000). Two studies were restricted to patients with HD (Dunlop 1998; Aglietta 2000); one study analysed both NHL and HD (Cunningham*) and ten studies included NHL patients only (Pettengell 1992; Bastion 1993; Gerhartz 1993; Avilés 1994; Fridrik 1997; Gisselbrecht 1997; Zinzani 1997; Doorduijn 2003; Ösby 2003; Burton 2006). Twelve studies included newly diagnosed patients only, while one study was conducted in patients with relapsed lymphoma (Cunningham*). Nine of the thirteen studies had a sample population aged between 15 and 77 years, whereas four studies were restricted to patients older than sixty years (Zinzani 1997; Doorduijn 2003; Ösby 2003, Burton 2006).
Growths factors were given before the onset of neutropenia and less than 48 hours after cytotoxic drug administration at doses of 5 µg/kg/day, or in equivalent doses of 230 µg/m² (G‐CSF) (Pettengell 1992), 300 µg/day (G‐CSF) (Doorduijn 2003), 263 µg/day (G‐CSF) (Burton 2006) or 400 µg/day (GM‐CSF) (Gerhartz 1993), subcutaneously during each course of chemotherapy. In one study, GM‐CSF was given between chemotherapy cycles to investigate whether GM‐CSF given before chemotherapy is myeloprotective (Aglietta 2000). All chemotherapy regimens applied were CHOP or MOPP‐like and were moderately myelosuppressive. Antibiotic prophylaxis was given in three studies (Pettengell 1992; Zinzani 1997; Burton 2006). Withdrawals and dropouts were stated in nine reports (Cunningham*; Pettengell 1992; Gerhartz 1993; Avilés 1994; Fridrik 1997; Gisselbrecht 1997; Dunlop 1998; Aglietta 2000; Doorduijn 2003). In one abstract publication, the specific number of patients in each study arm was not reported but results were reported in percentages (Bastion 1993). Assuming equal group sizes, we distributed the total number of patients (N = 119) at random to the four different study arms. One study was never published but the data were kindly provided by the principal investigator (Cunningham*). One study (Souêtre 1994) presented an economic analysis of patient data that were presented as clinical outcome data elsewhere (Gisselbrecht 1997). In five of the studies, two different chemotherapy regimens with or without G‐CSF were analysed in four separate study arms (Bastion 1993; Gisselbrecht 1997; Dunlop 1998; Ösby 2003; Burton 2006), and we analysed the data, where possible, accordingly (Bastion ACVBP 1993; Bastion VIMMM 1993; Dunlop MOPP 1998; Dunlop MOPP/EVAP 98; Ösby CHOP 2003; Ösby CNOP 2003). Only three studies (Zinzani 1997; Doorduijn 2003; Burton 2006) were not sponsored by the pharmaceutical industry.
Excluded studies
Thirty‐seven studies did not meet the inclusion criteria. One study in children and adults (Magrath 1996; Adde 1998) and three studies of various tumour entities (Yau 1996; Gregory 1998; Rao 2005) were excluded because there were fewer than ten eligible adult lymphoma patients per study arm. We also excluded ten non‐randomised studies (Gianni 1990; Ho 1990; Riccardi 1993; Zagonel 1994; Mangiagalli 1995; Niitsu 1995; Bertini 1996; Gustavsson 1997; Wilson 1998; Gordon 1999) and three crossover studies (Motoyoshi 1986; Shi 1994; Shi 1996). Two trials dealing with the secondary prevention of febrile neutropenia (Kaku 1993; Maiche 1993), two studies on the treatment of chemotherapy induced neutropenia (Gerhartz 1993; Hartmann 1997) and seven trials on the treatment of established febrile neutropenia (Bodey 1994; Maher 1994; Mayordomo 1995; Anaissie 1996; Vellenga 1996; Yoshida 1999; Lopez‐Hernandez 2000) were also excluded. Additionally, we discarded one trial on HIV‐associated lymphoma (Kaplan 1991) and two trials investigating patients with multiple myeloma exclusively (Moreau 1997; Togawa 2000). Two further studies were excluded because patients received GM‐CSF or placebo only in the first two cycles of chemotherapy (Bergmann 1995) or received G‐CSF only prior to the first cycle of chemotherapy (Hansen 1995). We excluded one study where G‐CSF administration did not start before the completion of the second cycle of chemotherapy (Ogawa 1990; Kaneko 1991) and one trial on the topical administration of G‐CSF for the prevention of mucositis (Karthaus 1998). Two dose finding studies were also excluded (Hovgaard 1992; Seymour 1995).
Risk of bias in included studies
All trials were described as randomised. In ten of thirteen trials, adequate measures were taken to conceal treatment allocation (Cunningham*; Gerhartz 1993; Avilés 1994; Fridrik 1997; Gisselbrecht 1997; Zinzani 1997; Dunlop 1998; Aglietta 2000; Ösby 2003; Doorduijn 2003). In three studies, the concealment of allocation could not be clarified (Pettengell 1992; Bastion 1993; Burton 2006). At baseline, the distribution of prognostic factors, such as age and stage of disease, was well balanced in the study groups. Five trials were placebo‐controlled (Bastion 1993; Gerhartz 1993; Avilés 1994; Gisselbrecht 1997; Aglietta 2000). Nine studies included intention‐to‐treat calculations in the analysis of primary outcomes (Cunningham*; Pettengell 1992; Avilés 1994; Gisselbrecht 1997; Dunlop MOPP 1998; Aglietta 2000; Ösby 2003; Doorduijn 2003; Burton 2006). Withdrawals and losses to follow up were stated in nine out of eleven published trials (full text) (Pettengell 1992; Gerhartz 1993; Avilés 1994; Fridrik 1997; Gisselbrecht 1997; Dunlop 1998; Aglietta 2000; Doorduijn 2003; Ösby 2003). In two reports, the number of withdrawals was stated but the reasons were not given (Fridrik 1997; Gisselbrecht 1997). For details of the quality assessment see Table 8.
1. Quality Assessment.
| Author | Properly randomised | Concealment of allocation | Studies comparable a | Patients blinded | Physicians blinded | Outcome assessors blinded | ITT | Withdrawals stated |
| Aglietta 2000 | Yes | Yes* | Yes | Yes | Yes | Yes | Yes | Yes |
| Aviles 1994 | Yes | Yes* | Yes | Yes* | Yes* | Yes* | Yes | Yes |
| Balducci 2007 | Yes | Yes | Yes | No | No | No | No | Yes |
| Bastion 1993 | NR | NR | NR | Yes | Yes | NR | NR | NR |
| Burton 2006 | NR | NR | Yes | No | No | NR | Yes (survival) No (neutropenia) |
NR |
| Ösby 2003/ Björkholm 1999 | Yes | Yes* | Yes | No | No | Yes* | Yes | Yes |
| Cunningham | Yes | Yes | Yes* | No* | No* | No* | Yes | Yes* |
| Dunlop MOPP 1998 | Yes | Yes | Yes* | No | No | No | Yes | Yes |
| Dunlop MOPP/EVAP 1998 | Yes | Yes | Yes* | No | No | No | No | Yes |
| Fridrik 1997 | Yes | Yes | Yes | No | No | No | No | Yes, but |
| Gerhartz 1993 | Yes | Yes | Yes | Yes | Yes | NR | No | Yes |
| Gisselbrecht 1997 | Yes | Yes | Yes | Yes | Yes | No* | Yes | Yes, but |
| Pettengell 1992 | NR | NR | Yes | No | No | No | Yes | Yes |
| Zinzani 1997 | Yes | Yes* | Yes | No | No | No | No | No |
| Doorduijn 2003 | Yes | Yes* | Yes | No | No | No | Yes | Yes |
Effects of interventions
As described above, trials that examined two chemotherapy regimens with or without G‐CSF were analysed according to the chemotherapy regimen. For this reason the true number of included studies may be lower than the number of studies calculated by RevMan automatically in the table of outcomes.
Primary outcome measures Overall survival Ten studies including 2221 patients were analysed (Cunningham*; Pettengell 1992; Engelhard 1994; Fridrik 1997; Zinzani 1997; Dunlop 1998; Björkholm 1999; Aglietta 2000; Doorduijn 2003; Burton 2006). Dunlop 1998 was analysed according to the chemotherapy regimen ( Dunlop MOPP 1998* ; Dunlop MOPP/EVAP 98* ). Aglietta 2000 only provided data for 29 of 56 patients with complete patient records (see Figure 1). The pooled HR was 0.97 (95% CI 0.87 to 1.09). There was no significant statistical heterogeneity among the trials (chi squared = 4.59, df = 10, P = 0.92). The average observation time of the studies was 4.3 years, range 1.3 to 7.9. Sensitivity analyses (see comparison 2) did not show any significant differences with respect to type of growth factor, tumour entity, age of patients, antibiotic prophylaxis, quality and size of study or length of follow‐up. Based on the data available, there is no evidence that either G‐CSF or GM‐CSF improve OS (Figure 2; Figure 3; Figure 4; Figure 5; Figure 6; Figure 7; Figure 8; Figure 9).
1.
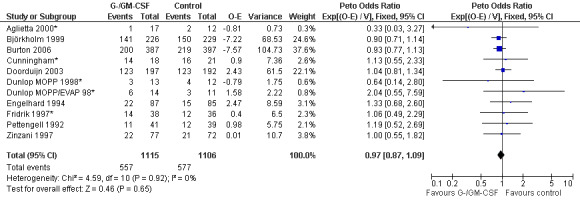
Forest plot of comparison: 1 G‐CSF/GM‐CSF versus control, outcome: 1.1 Overall survival.
2.
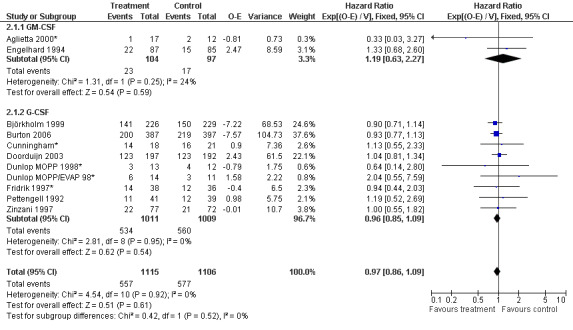
Forest plot of comparison: 6 Sensitivity analysis: Overall survival, outcome: 6.1 GM‐CSF versus G‐CSF.
3.
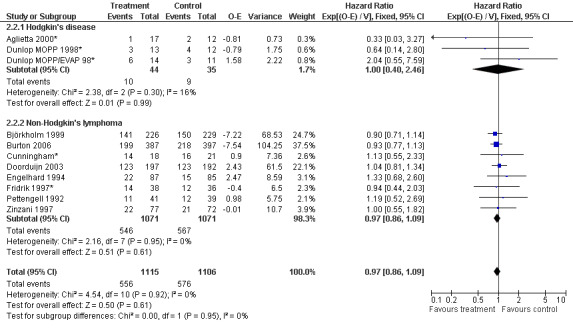
Forest plot of comparison: 6 Sensitivity analysis: Overall survival, outcome: 6.2 HD versus NHL.
4.
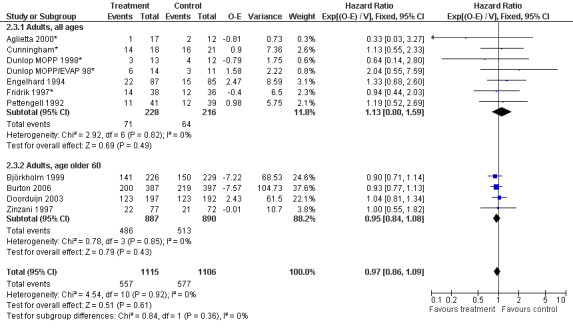
Forest plot of comparison: 6 Sensitivity analysis: Overall survival, outcome: 6.3 Age.
5.
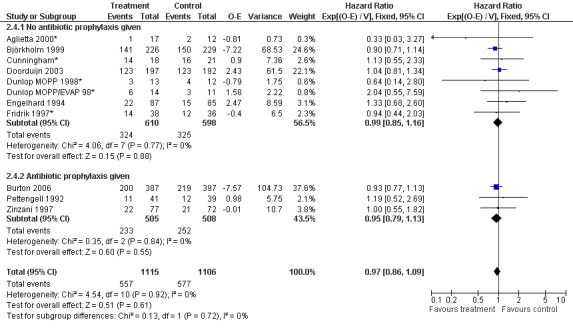
Forest plot of comparison: 6 Sensitivity analysis: Overall survival, outcome: 6.4 Antibiotic prophylaxis.
6.
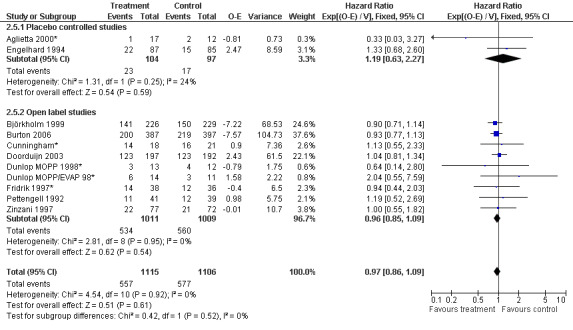
Forest plot of comparison: 6 Sensitivity analysis: Overall survival, outcome: 6.5 Blinded versus open label studies.
7.
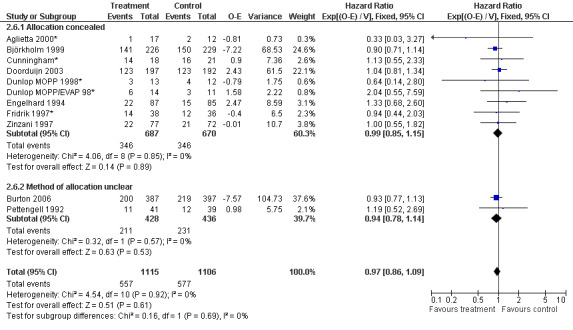
Forest plot of comparison: 6 Sensitivity analysis: Overall survival, outcome: 6.6 Concealed allocation versus concealment of allocation unclear.
8.
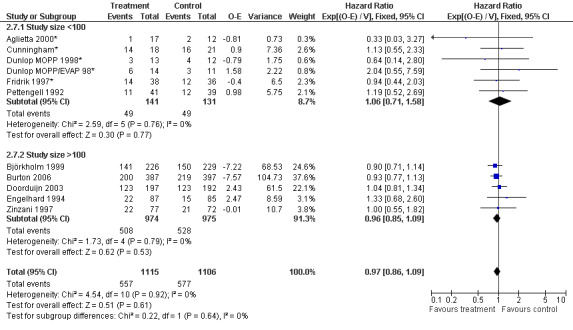
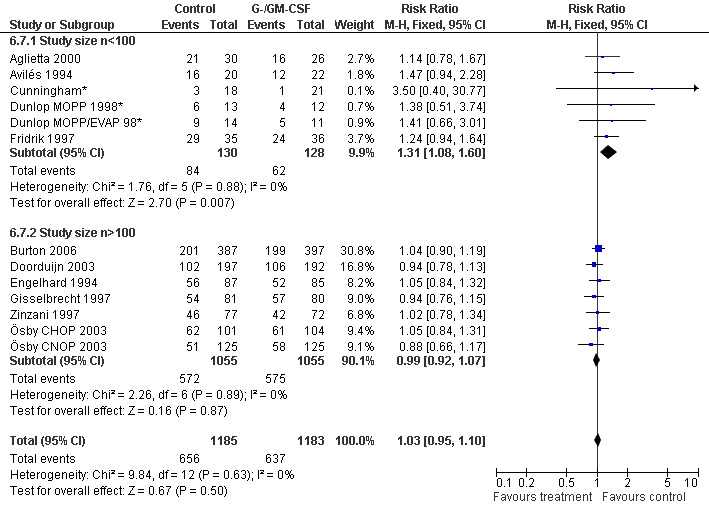
Forest plot of comparison: 6 Sensitivity analysis: Overall survival, outcome: 6.7 Size of studies.
9.
Forest plot of comparison: 6 Sensitivity analysis: Overall survival, outcome: 6.8 Duration of follow‐up.
Freedom from treatment failure FFTF was defined as freedom from progression, relapse of disease or death of any cause. Five studies with 718 patients were included for analysis (Aglietta 2000; Dunlop 1998; Fridrik 1997; Gerhartz 1993; Doorduijn 2003). Again, Dunlop 1998 was analysed by chemotherapy regimen. Aglietta 2000 only provided data for 29 of the 56 patients initially evaluated. When compared to placebo or no treatment, there was no evidence that G‐CSF or GM‐CSF had a significant effect on FFTF (HR 1.11; 95% CI 0.91 to 1.35) (Figure 10). There was no significant statistical heterogeneity among the trials (chi squared = 0.55, df = 5, P = 0.99). A sensitivity analysis was not performed. Thus, there is no evidence that either G‐CSF or GM‐CSF improve FFTF rates.
10.
Forest plot of comparison: 1 G‐CSF/GM‐CSF versus control, outcome: 1.10 Freedom from treatment failure.
Secondary outcome measures Quality of Life One study assessed quality of life (QoL) (Doorduijn 2003) with the following questionnaires: the EuroQol questionnaire, the EORTC Quality of Life Questionnaire and the Multidimensional Fatigue Inventory. Of the 389 patients initially included in the trial, 162 patients were asked to participate in the QoL study; 19% refused. Of the participating patients, 96% returned their questionnaires during the study period and 88% in the follow‐up period. Overall, no differences in QoL between the G‐CSF and the control group were detected.
Neutropenia
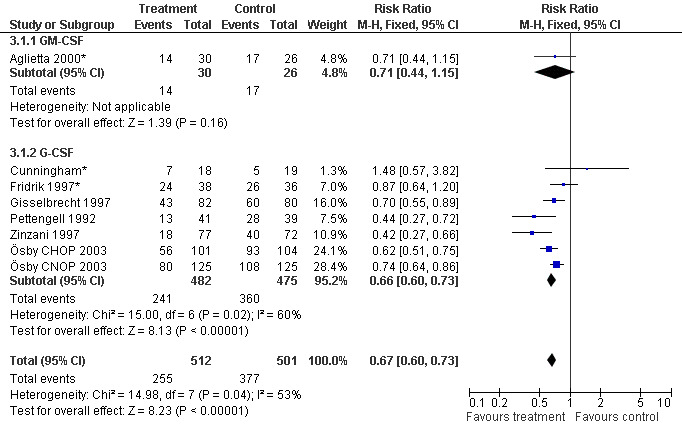
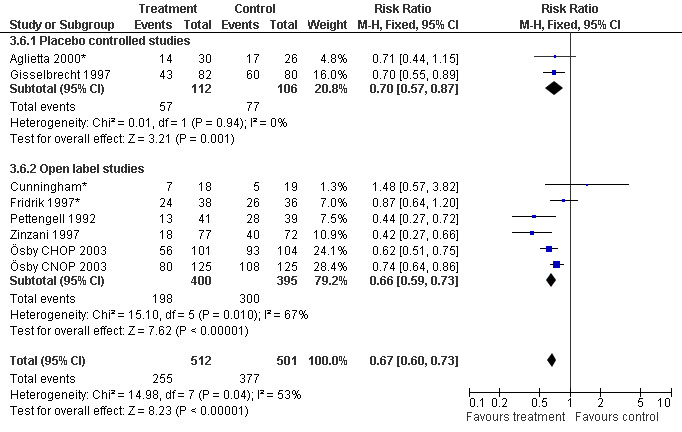
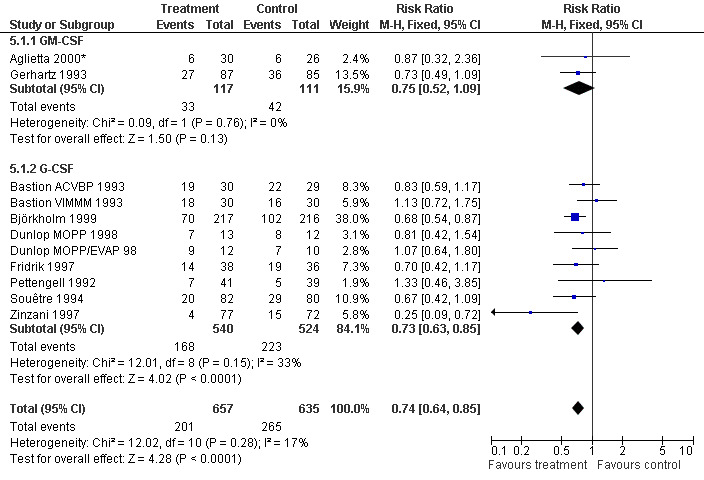
Seven studies with 1013 patients were included in this analysis (Cunningham*; Pettengell 1992; Fridrik 1997*; Gisselbrecht 1997; Zinzani 1997; Aglietta 2000*; Ösby 2003). Ösby 2003 was analysed by chemotherapy regimen ( Ösby CHOP 2003 , Ösby CNOP 2003 ). The risk of suffering from neutropenia, defined as absolute neutrophil count (ANC) below 0.5 x 10⁹/litre, was reduced by 33% for patients treated with G‐CSF or GM‐CSF (RR 0.67; 95% CI 0.60 to 0.73) (Figure 11). There was significant statistical heterogeneity among the trials (chi squared = 14.98, df = 7, P = 0.04), indicating that the variation in the effect of G‐CSF and GM‐CSF was larger than would be expected to result from chance alone. Sensitivity analyses (see comparison 3) revealed significant between group heterogeneity for prophylactic administration of antibiotic treatment during chemotherapy (P = 0.0022). A stronger treatment effect was observed in trials with antibiotic prophylaxis (RR 0.43; 95% CI 0.31 to 0.60, 2 trials with N = 229) compared to trials without antibiotic prophylaxis (RR 0.72; 95% CI 0.65 to 0.79, 5 trials with N =784), P value for difference between subgroups: 0.0042); see Figure 12. Other sensitivity analyses showed no significant differences with respect to G‐CSF versus GM‐CSF, HD versus NHL, age, haemato‐toxicity, blinded versus open label, concealment of allocation, quality and size of study and publication type (Figure 13; Figure 14; Figure 15; Figure 16; Figure 17; Figure 18; Figure 19; Figure 20; Figure 21). There was no indication of bias in the meta‐analysis.
11.
Forest plot of comparison: 1 G‐CSF/GM‐CSF versus control, outcome: 1.1 Neutropenia.
12.
Forest plot of comparison: 2 Sensitivity analysis: Neutropenia, outcome: 2.5 Use of antibiotic prophylaxis.
13.
Forest plot of comparison: 2 Sensitivity analysis: Neutropenia, outcome: 2.1 G‐CSF versus GM‐CSF.
14.
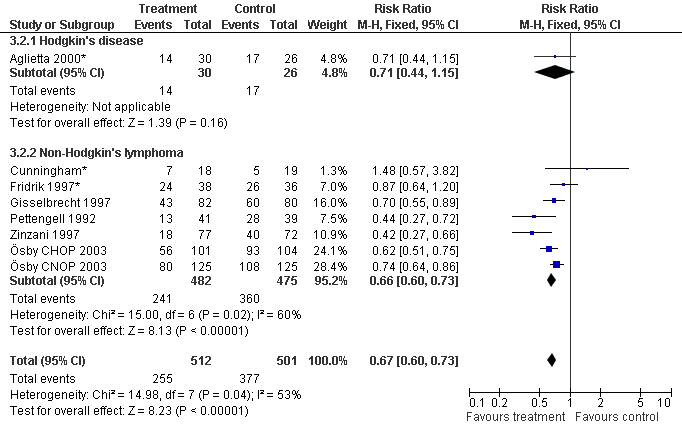
Forest plot of comparison: 2 Sensitivity analysis: Neutropenia, outcome: 2.2 HD versus NHL.
15.
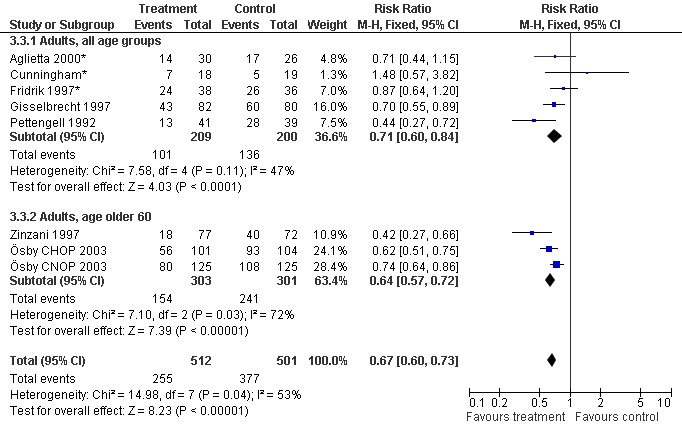
Forest plot of comparison: 2 Sensitivity analysis: Neutropenia, outcome: 2.3 Age.
16.
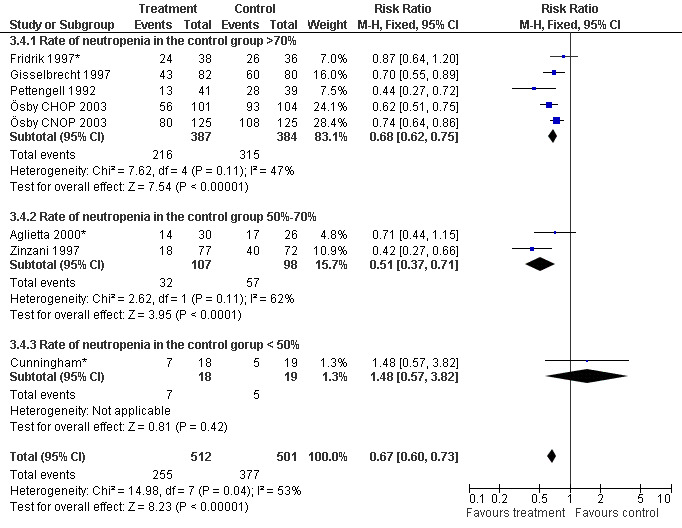
Forest plot of comparison: 2 Sensitivity analysis: Neutropenia, outcome: 2.4 Haematotoxicity.
17.
Forest plot of comparison: 2 Sensitivity analysis: Neutropenia, outcome: 2.6 Blinded versus openlabel studies.
18.
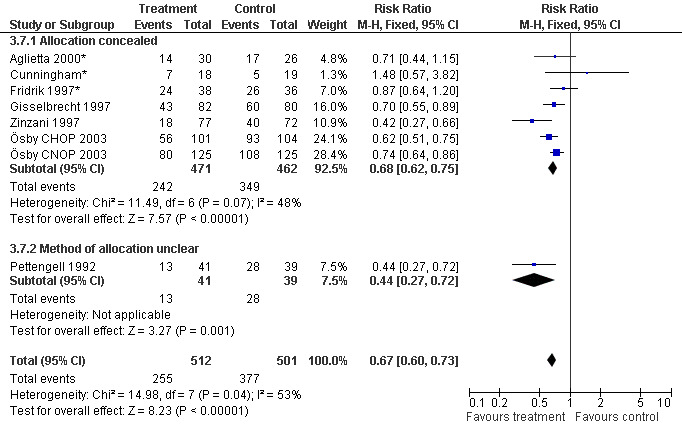
Forest plot of comparison: 2 Sensitivity analysis: Neutropenia, outcome: 2.7 Concealed versus unclear method of allocation.
19.
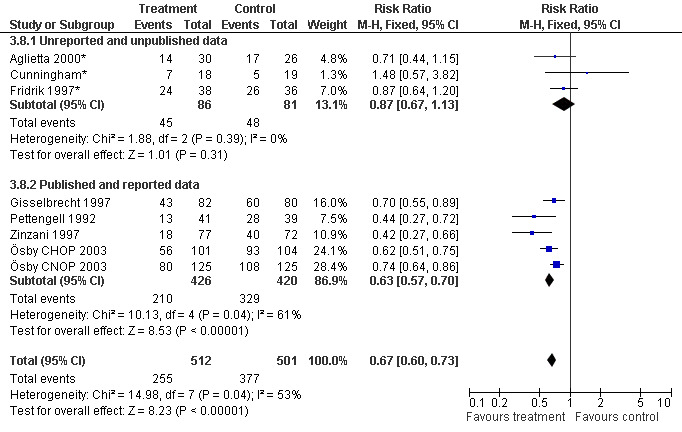
Forest plot of comparison: 2 Sensitivity analysis: Neutropenia, outcome: 2.8 Published and reported data versus unpublished or unreported data.
20.
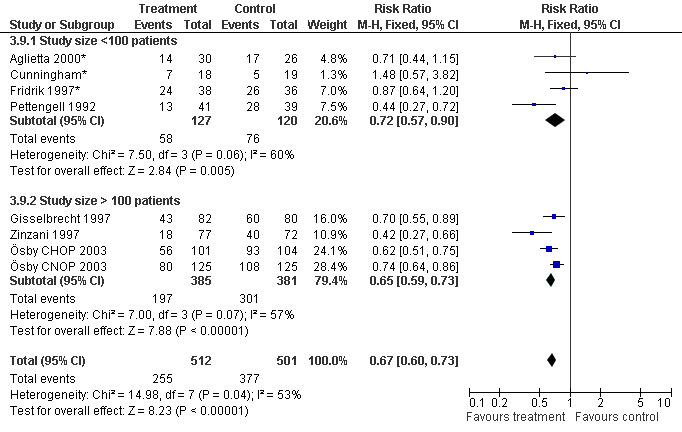
Forest plot of comparison: 2 Sensitivity analysis: Neutropenia, outcome: 2.9 Size of study.
21.
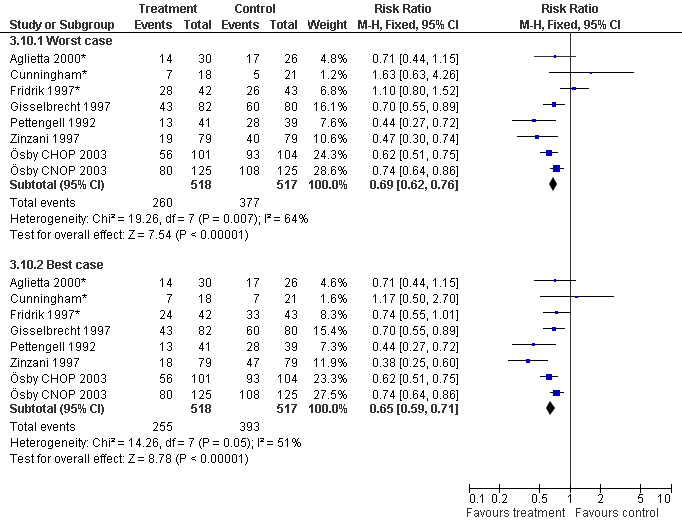
Forest plot of comparison: 2 Sensitivity analysis: Neutropenia, outcome: 2.10 Worst case‐best case.
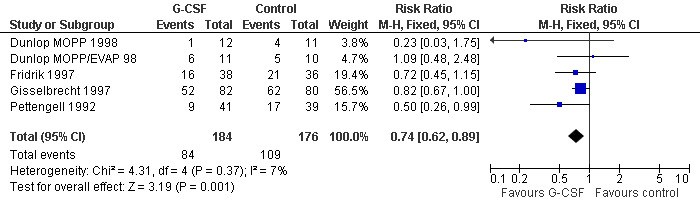
Febrile neutropenia, ANC < 1.0 x 10⁹/litre and febrile temperatures
Four studies including 360 patients were analysed (Pettengell 1992; Fridrik 1997; Gisselbrecht 1997; Dunlop 1998). Dunlop 1998 was analysed by chemotherapy regimen ( Dunlop MOPP 1998 ; Dunlop MOPP/EVAP 98 ). The risk of febrile neutropenia, defined as ANC below 1.0 x 10⁹/litre and febrile temperatures, was reduced by 26% (RR 0.74; 95% CI 0.62 to 0.89); see Figure 22. There was no obvious statistical heterogeneity among the trials (chi squared = 4.31, df = 4, P = 0.37). All included studies evaluated G‐CSF and had an underlying risk to develop febrile neutropenia of at least 36% in the control group. Data for GM‐CSF were not available. Sensitivity analyses (tumour entity, antibiotic prophylaxis, quality and size of study; comparison 4) did not show significant differences (Figure 23; Figure 24; Figure 25; Figure 26; Figure 27; Figure 28). These data suggest that G‐CSF significantly reduces the risk for febrile neutropenia.
22.
Forest plot of comparison: 1 G‐CSF/GM‐CSF versus control, outcome: 1.2 Febrile Neutropenia, ANC < 1000.
23.
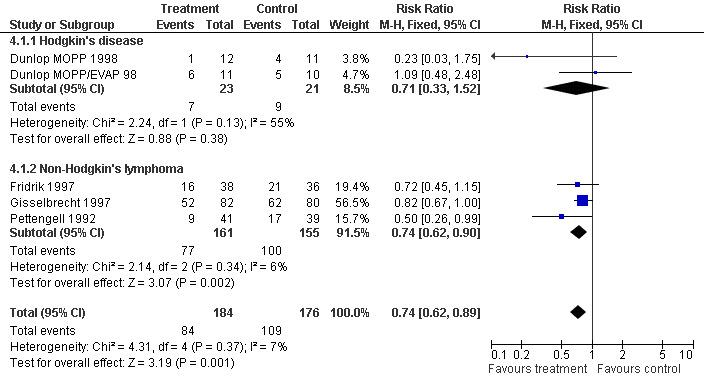
Forest plot of comparison: 3 Sensitivity analysis: Febrile Neutropenia, outcome: 3.1 HD versus NHL.
24.
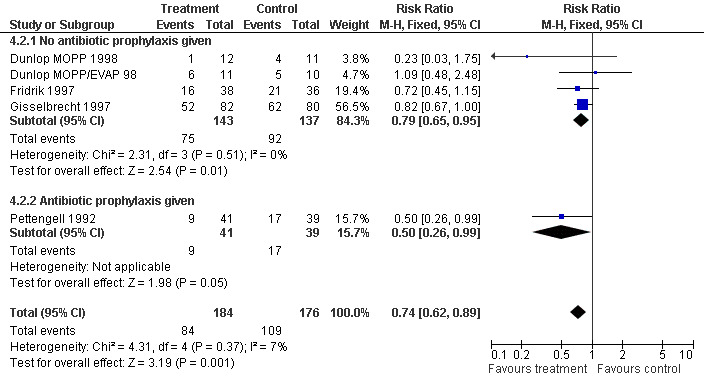
Forest plot of comparison: 3 Sensitivity analysis: Febrile Neutropenia, outcome: 3.2 Use of antibiotic prophylaxis.
25.
Forest plot of comparison: 3 Sensitivity analysis: Febrile Neutropenia, outcome: 3.3 Blinded versus open label studies.
26.
Forest plot of comparison: 3 Sensitivity analysis: Febrile Neutropenia, outcome: 3.4 Concealed versus unclear method of allocation.
27.
Forest plot of comparison: 3 Sensitivity analysis: Febrile Neutropenia, outcome: 3.5 Size of study.
28.
Forest plot of comparison: 3 Sensitivity analysis: Febrile Neutropenia, outcome: 3.6 Worst case‐best case.
Febrile neutropenia, ANC < 0.5 x 10⁹/litre and febrile temperatures Two studies, one with two chemotherapy regimens, including 604 patients were analysed. Febrile neutropenia was defined as ANC below 0.5 x 10⁹/litre and febrile temperatures (Zinzani 1997*; Ösby 2003). The risk for febrile neutropenia was reduced by 41% (RR 0.59; 95% CI 0.48 to 0.72); see Figure 29. There was no statistical heterogeneity among the trials (chi squared = 2.94, df = 2, P = 0.23). All included studies evaluated G‐CSF and had an underlying risk to develop febrile neutropenia of at least 50% in the control group. Data for GM‐CSF were not available. A sensitivity analysis was not done. These data suggest that G‐CSF significantly reduces the risk for febrile neutropenia.
29.
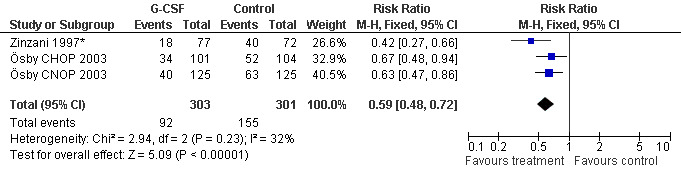
Forest plot of comparison: 1 G‐CSF/GM‐CSF versus control, outcome: 1.3 Febrile Neutropenia, ANC < 500.
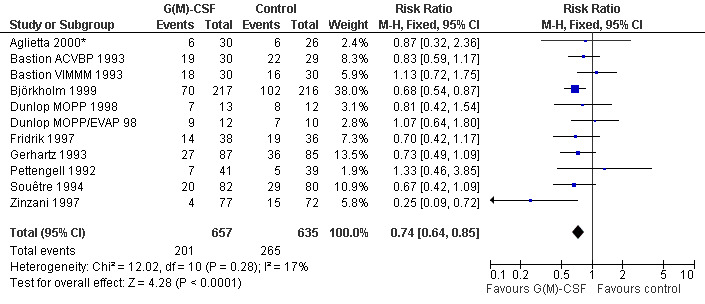
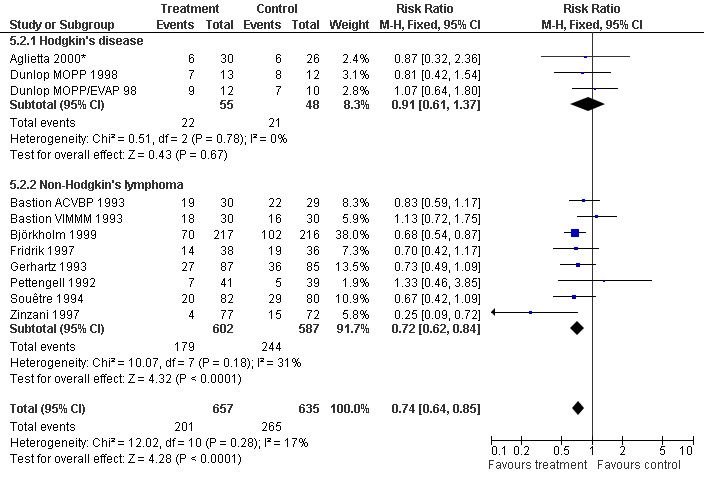
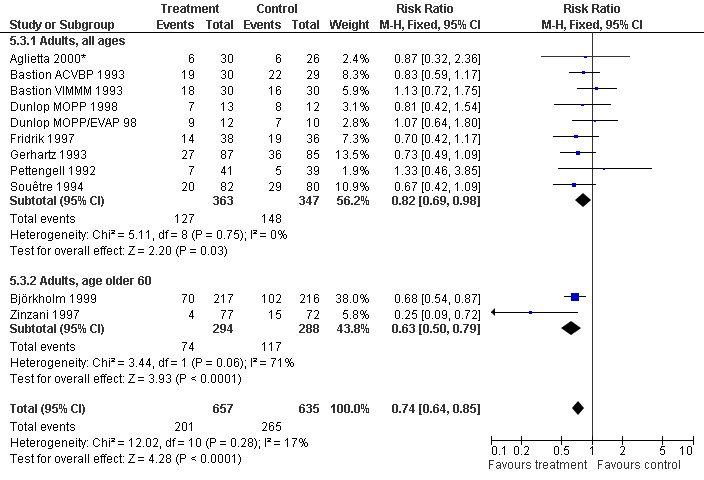
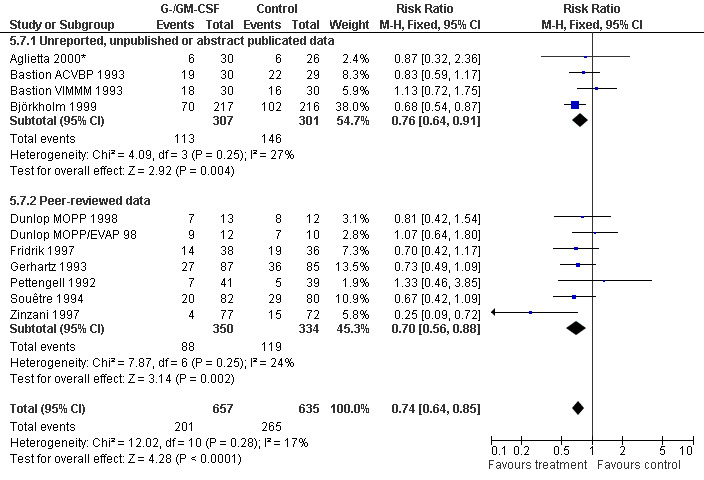
Infection Nine studies, two with two different chemotherapy regimens, with 1292 patients reporting microbiologically or clinically documented infection were included in the analysis (Pettengell 1992; Bastion 1993; Gerhartz 1993; Souêtre 1994; Fridrik 1997; Zinzani 1997; Dunlop 1998; Björkholm 1999; Aglietta 2000*). When infections were documented by both microbiological and clinical methods, only the microbiologically documented infections were included as these are less prone to bias (Souêtre 1994; Gisselbrecht 1997). The risk of developing an infection was reduced by 26% (RR 0.74; 95% CI 0.64 to 0.85); see Figure 30. Inclusion of either microbiological or clinical data did change the result (data not shown). There was no significant statistical heterogeneity among the trials (chi squared = 12.02, df = 10, P = 0.28). Sensitivity analyses (tumour entity, antibiotic prophylaxis, quality and size of study; comparison 5) did not show significant differences (Figure 31; Figure 32; Figure 33; Figure 34; Figure 35; Figure 36; Figure 37; Figure 38; Figure 39). These data suggest that G‐CSF and GM‐CSF significantly reduce the risk of infection.
30.
Forest plot of comparison: 1 G‐CSF/GM‐CSF versus control, outcome: 1.4 Infection.
31.
Forest plot of comparison: 4 Sensitivity analysis: Infection, outcome: 4.1 G‐CSF versus GM‐CSF.
32.
Forest plot of comparison: 4 Sensitivity analysis: Infection, outcome: 4.2 HD versus NHL.
33.
Forest plot of comparison: 4 Sensitivity analysis: Infection, outcome: 4.3 Age.
34.
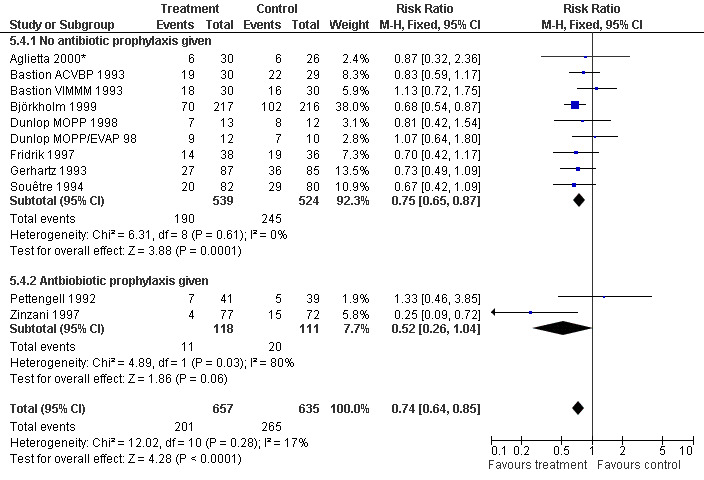
Forest plot of comparison: 4 Sensitivity analysis: Infection, outcome: 4.4 Use of antibiotic prophylaxis.
35.
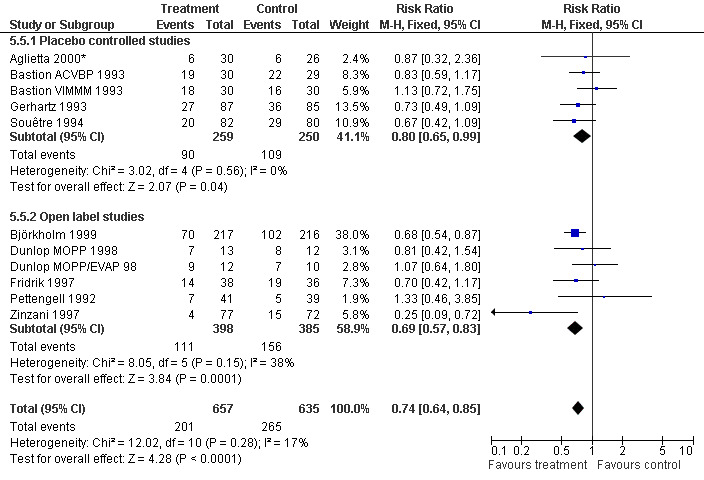
Forest plot of comparison: 4 Sensitivity analysis: Infection, outcome: 4.5 Blinded versus open label studies.
36.
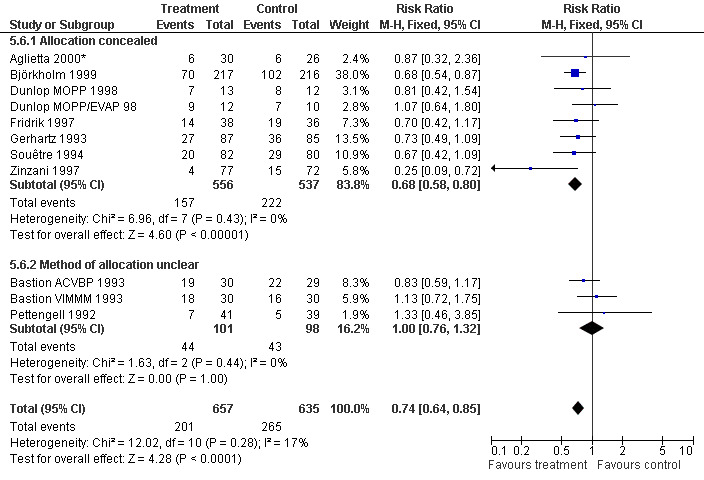
Forest plot of comparison: 4 Sensitivity analysis: Infection, outcome: 4.6 Concealed versus unclear method of allocation.
37.
Forest plot of comparison: 4 Sensitivity analysis: Infection, outcome: 4.7 Published and reported data versus unpublished, unreported or abstract publications only.
38.
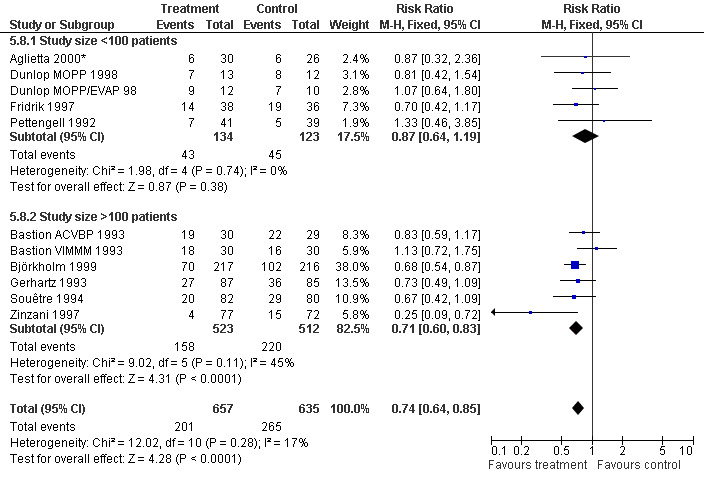
Forest plot of comparison: 4 Sensitivity analysis: Infection, outcome: 4.8 Size of study.
39.
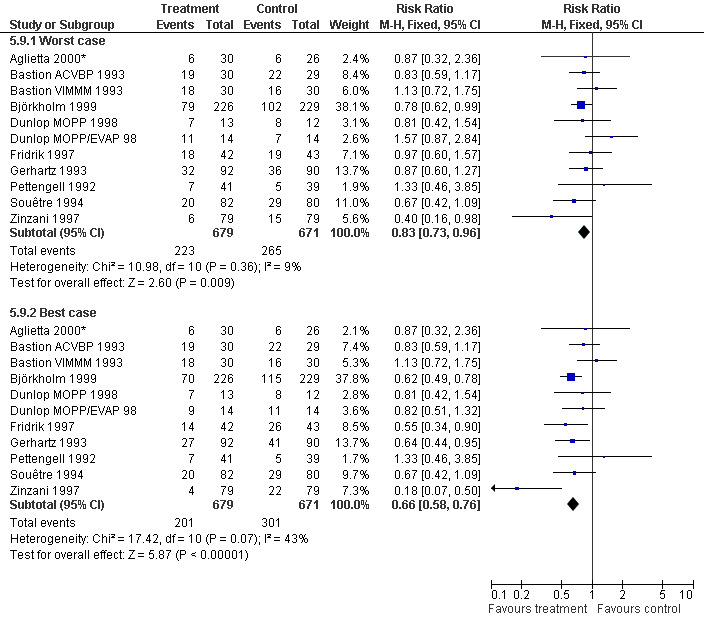
Forest plot of comparison: 4 Sensitivity analysis: Infection, outcome: 4.9 Worst case‐best case.
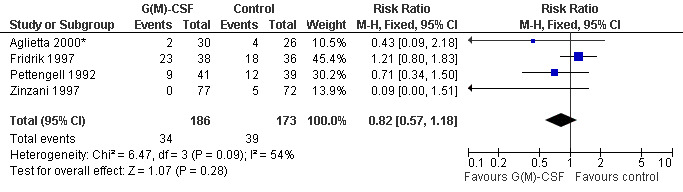
Parenteral antibiotic treatment Data from four studies including 359 patients were pooled in this analysis (Pettengell 1992; Fridrik 1997; Zinzani 1997; Aglietta 2000*). The risk of requiring parenteral antibiotic treatment was reduced by 18% in the G‐CSF and GM‐CSF treated groups (RR 0.82; 95 % CI 0.57 to 1.18), but this was not statistically significant; see Figure 40. There was no significant statistical heterogeneity among the trials (chi squared = 9.12, df = 4, P = 0.058). A test for publication bias (P = 0.026) indicated that both the RR and its 95% CI may be overestimated.
40.
Forest plot of comparison: 1 G‐CSF/GM‐CSF versus control, outcome: 1.5 Parenteral antibiotic treatment.
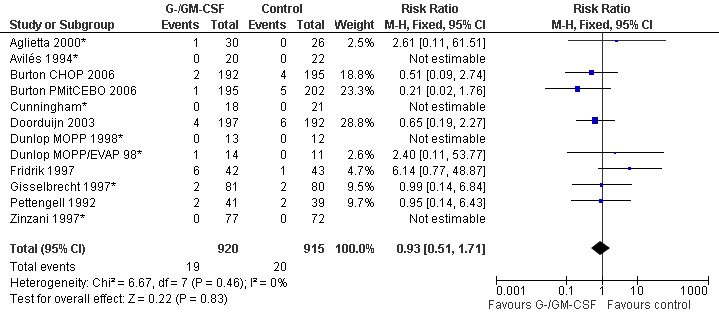
Mortality during chemotherapy Ten studies (one with two chemotherapy regimens) with 1170 patients were included in the analysis. Overall, 36 out of 592 patients treated with G‐CSF or GM‐CSF and 38 out of 975 patients in the control group died during chemotherapy (RR 0.93; 95% CI 0.60 to 1.43) (Cunningham*; Pettengell 1992; Bastion 1993; Avilés 1994*; Fridrik 1997*; Gisselbrecht 1997; Zinzani 1997; Dunlop MOPP/EVAP 98*; Dunlop MOPP 1998 ; Aglietta 2000; Doorduijn 2003; Burton 2006). There was no significant statistical heterogeneity among the trials (chi squared = 5.92, df = 8 , P = 0.66); see Figure 41.
41.
Forest plot of comparison: 1 G‐CSF/GM‐CSF versus control, outcome: 1.6 Overall mortality during chemotherapy.
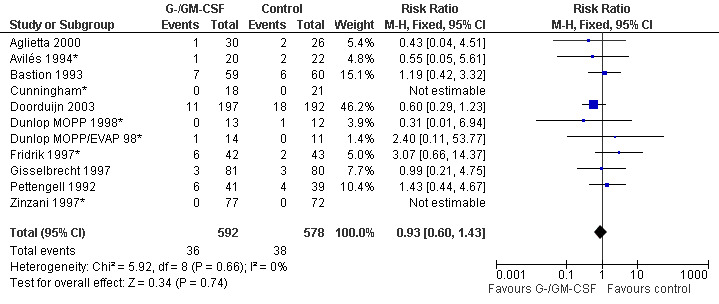
Infection related mortality during chemotherapy Ten studies (one with two chemotherapy regimens) with 1835 patients were included in the analysis of infection related mortality during chemotherapy. Nineteen out of 920 patients treated with G‐CSF or GM‐CSF and twenty out of 915patients in the control group died of infection during treatment (RR 0.93; 95% CI 0.51 to 1.71) (Cunningham*; Pettengell 1992; Avilés 1994*; Fridrik 1997; Gisselbrecht 1997*; Zinzani 1997*; Dunlop MOPP 1998*; Dunlop MOPP/EVAP 98*; Aglietta 2000*; Doorduijn 2003; Burton 2006), but this was not statistically significant. There was no significant statistical heterogeneity among the trials (chi squared = 6.67, df = 7, P = 0.46); see Figure 42. Overall, there is no evidence that G‐CSF or GM‐CSF affect overall mortality and infection related mortality during chemotherapy.
42.
Forest plot of comparison: 1 G‐CSF/GM‐CSF versus control, outcome: 1.7 Infection related mortality during chemotherapy.
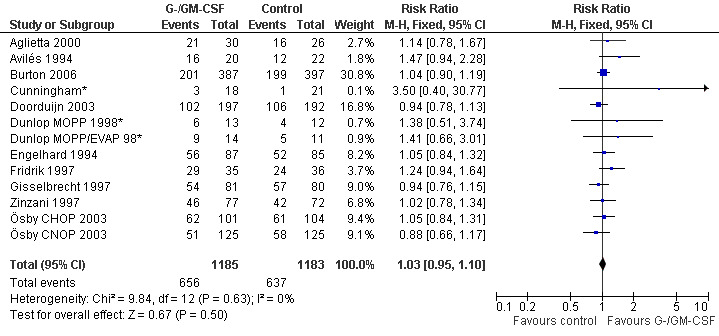
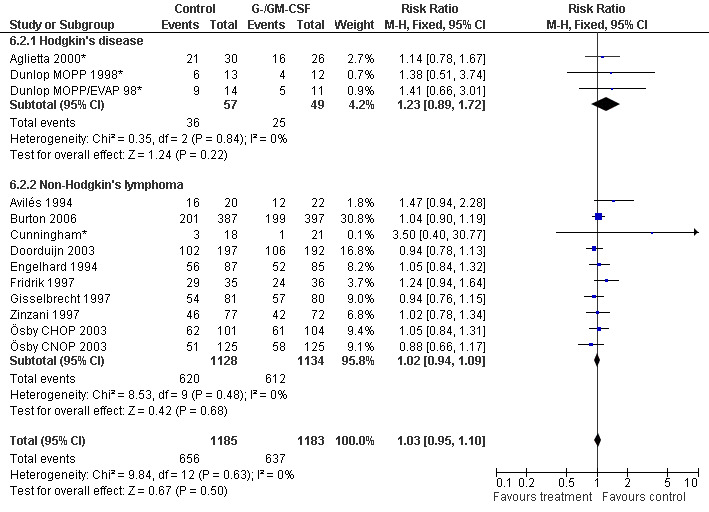
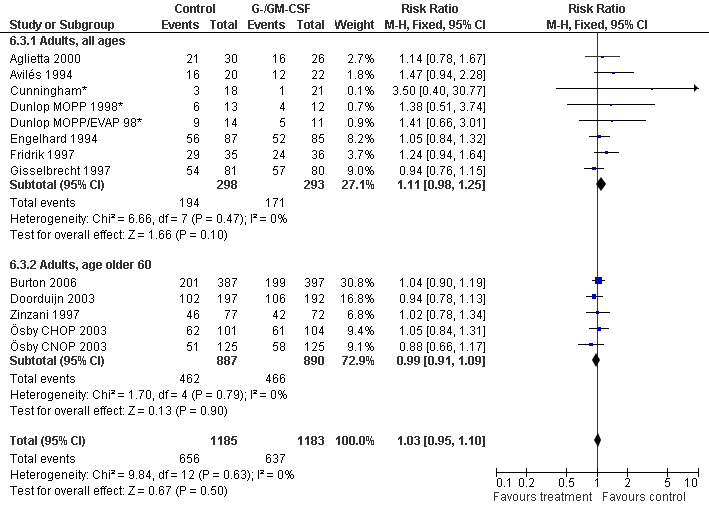
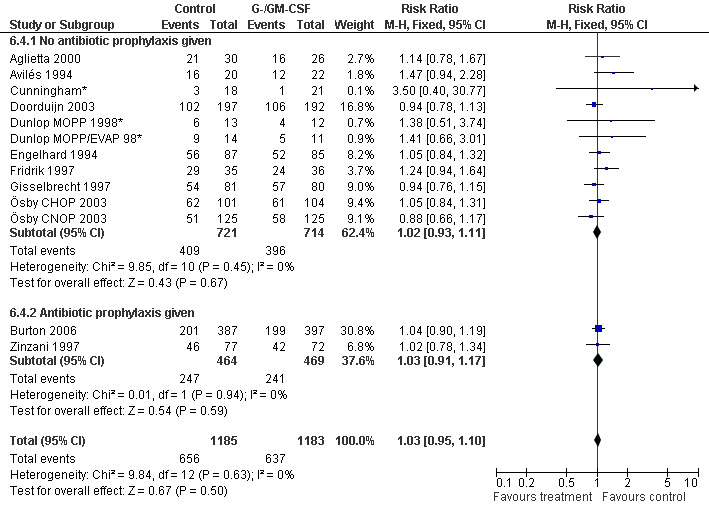
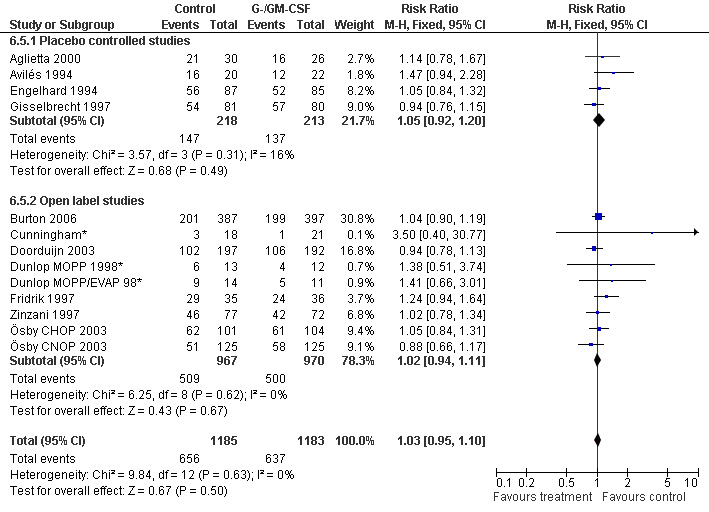
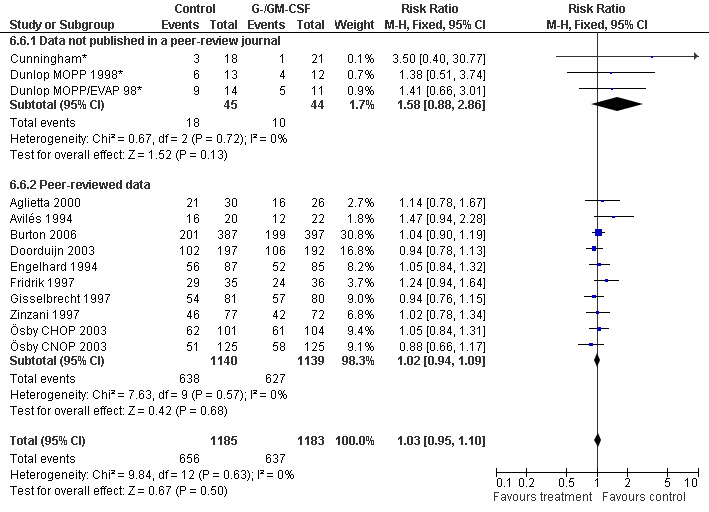
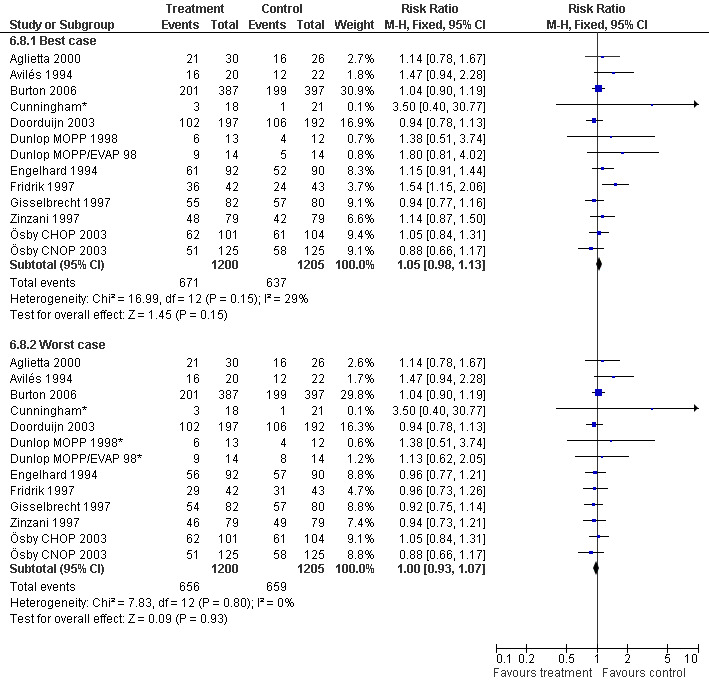
Complete response Analysis of complete tumour response was based on 11 trials including 2368 patients (Cunningham*; Avilés 1994; Engelhard 1994; Fridrik 1997; Gisselbrecht 1997; Zinzani 1997; Dunlop MOPP 1998*; Dunlop MOPP/EVAP 98*; Aglietta 2000; Ösby 2003; Doorduijn 2003;Burton 2006). Two trials, Dunlop 1998 and Ösby 2003 , were analysed by chemotherapy regimen. The overall risk of achieving complete response for patients treated with G‐CSF or GM‐CSF was increased by 3% (RR 1.03; 95% CI 0.95 to 1.10), but this was not statistically significant; see Figure 43. There was no significant heterogeneity among the trials (chi squared = 9.84, df = 12, P = 0.63). The test for small study bias was significant (P = 0.02624), indicating that the effect of G‐CSF or GM‐CSF may be overestimated (see Figure 44) . A subgroup analysis of study size showed a bigger treatment effect in small studies (RR 1.31; 95% CI 1.08 to 1.60) compared to large studies (RR 0.99; 95% CI 0.92 to 1.07), P value for difference between subgroups: 0.0154; see Figure 45, comparison 6.7. Other sensitivity analyses (type of drug, tumour entity, patient age, antibiotic prophylaxis, quality of study and publication type; comparison 6) did not show any significant differences (Figure 46; Figure 47; Figure 48; Figure 49; Figure 50; Figure 51).
43.
Forest plot of comparison: 1 G‐CSF/GM‐CSF versus control, outcome: 1.8 Complete response.
44.
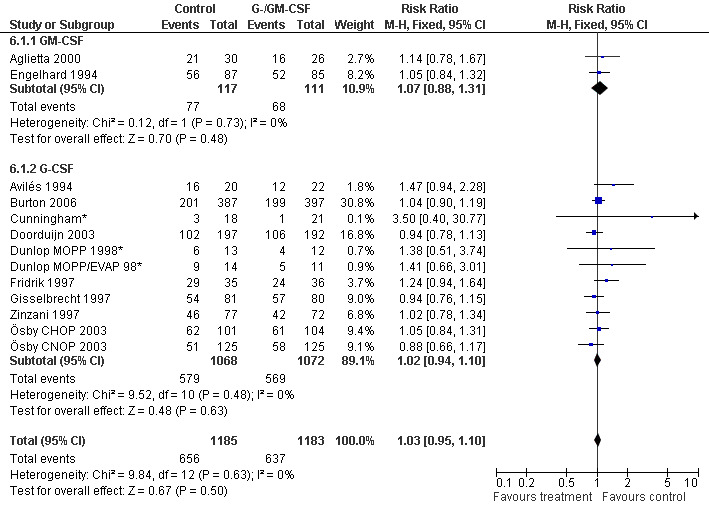
Forest plot of comparison: 5 Sensitivity analysis: Complete response, outcome: 5.1 GM‐CSF versus G‐CSF.
45.
Forest plot of comparison: 5 Sensitivity analysis: Complete response, outcome: 5.7 Size of studies.
46.
Forest plot of comparison: 5 Sensitivity analysis: Complete response, outcome: 5.2 HD versus NHL.
47.
Forest plot of comparison: 5 Sensitivity analysis: Complete response, outcome: 5.3 Age.
48.
Forest plot of comparison: 5 Sensitivity analysis: Complete response, outcome: 5.4 Use of antibiotic prophylaxis.
49.
Forest plot of comparison: 5 Sensitivity analysis: Complete response, outcome: 5.5 Blinded versus open label studies.
50.
Forest plot of comparison: 5 Sensitivity analysis: Complete response, outcome: 5.6 Published and reported data versus unpublished or unreported data.
51.
Forest plot of comparison: 5 Sensitivity analysis: Complete response, outcome: 5.8 Worst case ‐ best case.
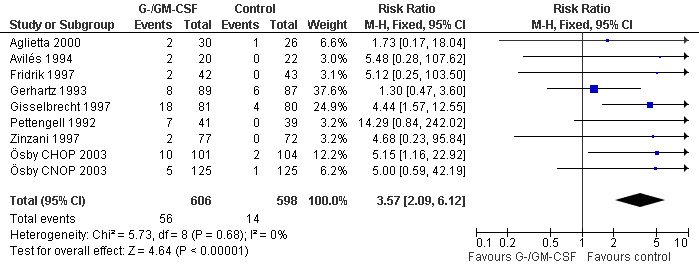
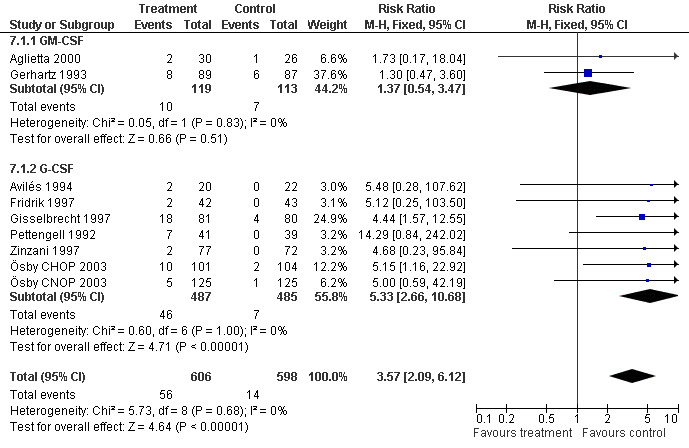
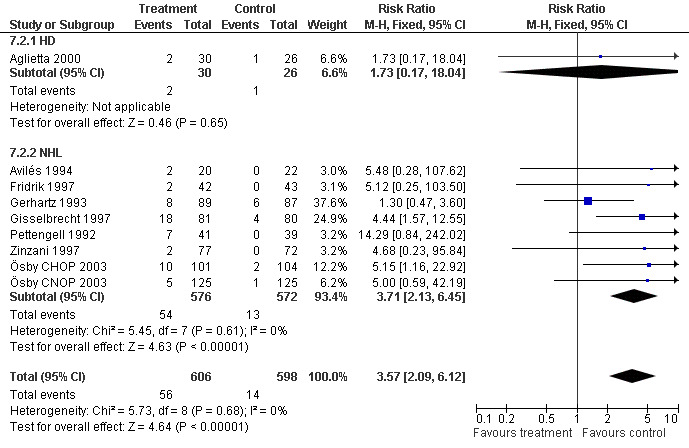
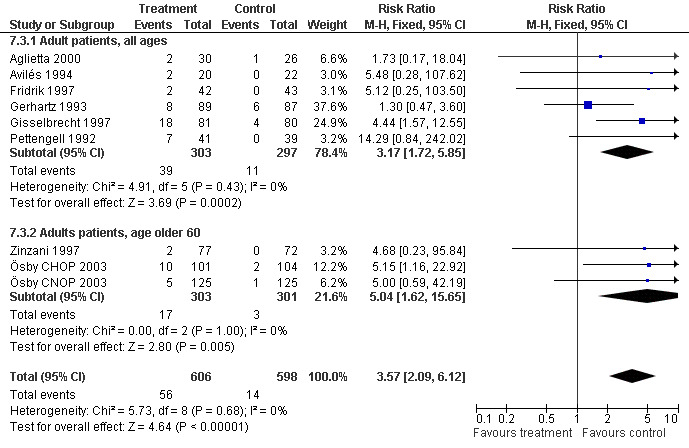
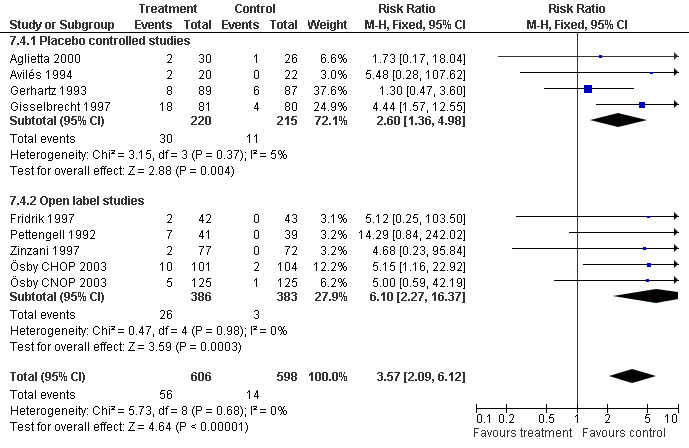
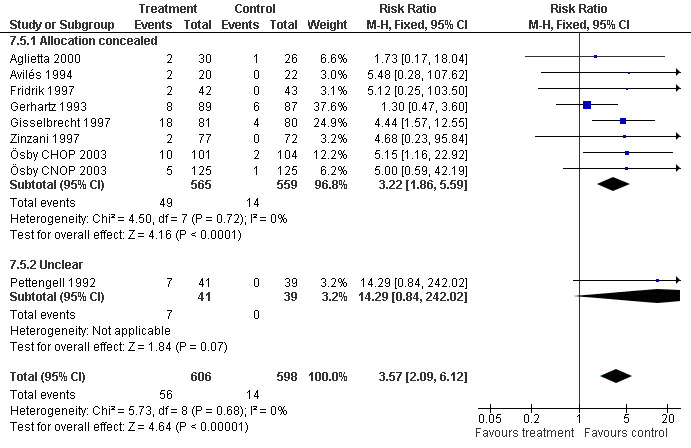
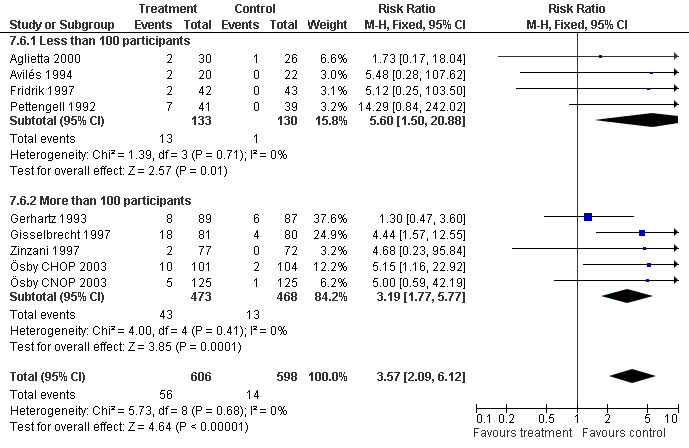
Adverse effects Bone pain Based on eight studies with 1204 patients, the risk of bone pain for patients treated with G‐CSF or GM‐CSF was more than doubled, compared to the control group (RR 3.57; 95% CI 2.09 to 6.12) (Pettengell 1992; Gerhartz 1993; Avilés 1994; Fridrik 1997; Gisselbrecht 1997; Zinzani 1997; Aglietta 2000; Ösby 2003). However, no patient withdrew from the study because of bone pain. There was no significant statistical heterogeneity among the trials (chi squared = 5.73, df = 8, P = 0.68); see Figure 52. Subgroup analysis (comparison 7) demonstrated a significantly (P = 0.026) smaller risk of bone pain for patients treated with GM‐CSF (RR 1.37; 95% CI 0.54 to 3.47, 2 studies of N = 232), compared to patients receiving G‐CSF (RR 5.33; 95% CI 2.66 to 10.68, 6 studies of N = 972); see Figure 53. However, this observation is based on indirect comparison. Sensitivity analysis for placebo‐controlled or open studies, tumour entity, age of patients, quality and size of study did not show significant differences (Figure 54; Figure 55; Figure 56; Figure 57; Figure 58).
52.
Forest plot of comparison: 1 G‐CSF/GM‐CSF versus control, outcome: 1.11 Adverse events: bone pain.
53.
Forest plot of comparison: 7 Sensitivity analysis: Bone Pain, outcome: 7.1 GM‐CSF versus G‐CSF.
54.
Forest plot of comparison: 7 Sensitivity analysis: Bone Pain, outcome: 7.2 HD versus NHL.
55.
Forest plot of comparison: 7 Sensitivity analysis: Bone Pain, outcome: 7.3 Age.
56.
Forest plot of comparison: 7 Sensitivity analysis: Bone Pain, outcome: 7.4 Blinding.
57.
Forest plot of comparison: 7 Sensitivity analysis: Bone Pain, outcome: 7.5 Concealment of allocation.
58.
Forest plot of comparison: 7 Sensitivity analysis: Bone Pain, outcome: 7.6 Study size.
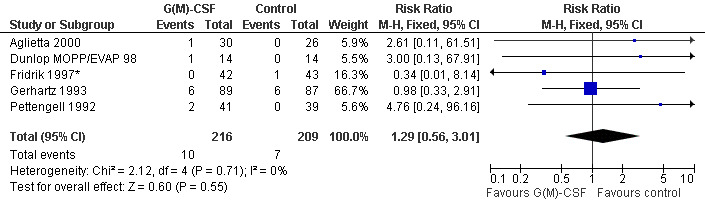
Thromboembolic complications Based on 425 patients in 5 trials, a total of 17 thromboembolic complications were observed (RR 1.29; 95% CI 0.56 to 3.01) (Pettengell 1992; Gerhartz 1993; Fridrik 1997*; Dunlop MOPP/EVAP 98; Aglietta 2000); see Figure 59. There was no significant statistical heterogeneity among the trials (chi squared = 2.12, df = 4, P = 0.71). Thus, there is no evidence that G‐CSF or GM‐CSF increase the risk of thrombosis or related haemodynamic vascular complications such as transient ischaemic attacks, stroke or myocardial infarction.
59.
Forest plot of comparison: 1 G‐CSF/GM‐CSF versus control, outcome: 1.12 Adverse events: thrombosis and related complications (TIA, MI, cerebral non‐hemorhagic infarction).
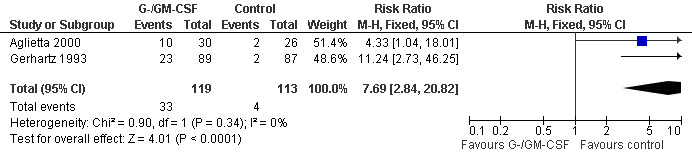
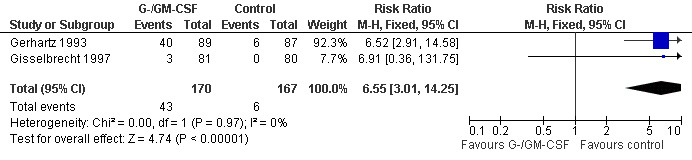
Skin rash and injection site reaction Two trials including 232 patients reported 33 cases of skin rash in the GM‐CSF group and four in the control group (RR 7.69; 95% CI 2.84 to 20.82) (Gerhartz 1993; Aglietta 2000); see Figure 60. There was no significant statistical heterogeneity among the trials (chi squared = 0.90, df = 1, P = 0.34). Data for G‐CSF were not reported. Injection site reactions were reported in two trials with 337 patients. Based on 43 observed events in the treatment group and six in the control group, the risk of an injection site reaction was increased more than fivefold (RR 6.55; 95% CI 3.01 to 14.25) (Gerhartz 1993; Gisselbrecht 1997); see Figure 61. There was no significant statistical heterogeneity among the trials (chi squared = 0.00, df = 1, P = 0.97). However, the wide confidence intervals indicate that these results should be interpreted with caution.
60.
Forest plot of comparison: 1 G‐CSF/GM‐CSF versus control, outcome: 1.13 Adverse events: skin rash.
61.
Forest plot of comparison: 1 G‐CSF/GM‐CSF versus control, outcome: 1.14 Adverse events: injection site reaction.
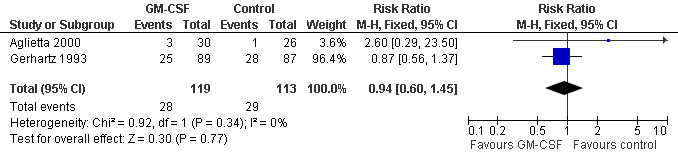
Myalgia Two studies including 232 patients failed to detect a significant effect (RR 0.95; 95% CI 0.60 to 1.45) (Gerhartz 1993; Aglietta 2000); see Figure 62. There was no significant statistical heterogeneity among the trials (chi squared = 0.92, df = 1, P = 0.34). No other studies could be analysed for this outcome, so the data must be interpreted cautiously.
62.
Forest plot of comparison: 1 G‐CSF/GM‐CSF versus control, outcome: 1.15 Adverse events: myalgia.
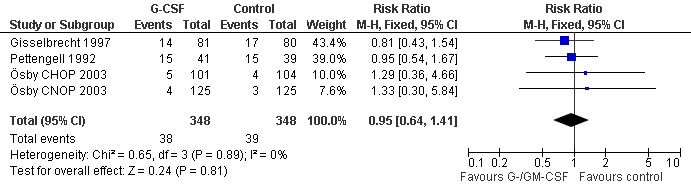
Mucositis Three studies (one examining two chemotherapy regimens) including 696 patients did not show a significant effect (RR 0.95; 95% CI 0.64 to 1.41) (Pettengell 1992; Gisselbrecht 1997; Ösby 2003); see Figure 63. There was no significant heterogeneity among the trials (chi squared = 0.65, df = 3 P = 0.89).
63.
Forest plot of comparison: 1 G‐CSF/GM‐CSF versus control, outcome: 1.16 Adverse events: mucositis.
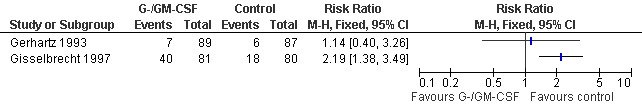
Headache
Two studies reported the incidence of headache (Gisselbrecht 1997; Gerhartz 1993); see Figure 64.
64.
Forest plot of comparison: 1 G‐CSF/GM‐CSF versus control, outcome: 1.17 Adverse events: headache.
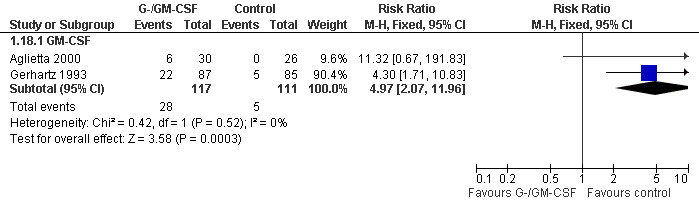
Withdrawal from treatment Eight studies reported rates of withdrawal from treatment (Pettengell 1992; Gerhartz 1993; Avilés 1994; Fridrik 1997; Gisselbrecht 1997; Dunlop 1998; Aglietta 2000; Doorduijn 2003). Overall, 113 of 531 patients in the G‐/GM‐CSF group and 122 of 518 patients in the control group withdrew from treatment. In the GM‐CSF treated groups, 28 of 117 patients and 5 of 111 patients in the control group left the study due to adverse events attributable to the study medication; see Figure 65. None of the withdrawals in the G‐CSF group were related to the study drug.
65.
Forest plot of comparison: 1 G‐CSF/GM‐CSF versus control, outcome: 1.18 Withdrawals due to adverse events.
The likelihood of experiencing chemotherapy‐related adverse events such as nausea, vomiting, peripheral polyneuropathy and alopecia was similar between the G‐CSF and GM‐CSF treatment groups (Pettengell 1992; Gerhartz 1993; Avilés 1994; Fridrik 1997; Doorduijn 2003; Ösby 2003).
Continuous outcome data Insufficient reporting of continuous data precluded analysis of the duration of neutropenia and febrile neutropenia, received dose intensity, duration of antibiotic therapy and length of hospital stay.
Duration of neutropenia Two studies (Gisselbrecht 1997; Aglietta 2000) reported a shortened duration of severe neutropenia (ANC < 500), which was statistically significant in one trial (Gisselbrecht 1997). Other trials reported the duration of neutropenia (ANC <1000) with inconclusive results. Thus, there is no conclusive evidence that G‐CSF or GM‐CSF shorten the duration of neutropenia. Refer to Table 9 for an overview of how trials reported the duration of neutropenia and of reported results.
2. Duration of neutropenia.
| Author | Outcome | G‐/GM‐CSF | Control | P value | Comments |
| Aglietta 2000 | mean duraction of neutropenia in days, ANC < 500 | 9.77, SD = 14.87, N = 30 | 11.85, SD = 12.79, N = 26 | not significant | |
| Avilés 1994 | mean duration of neutropenia in days (ANC < 1000) | 2.1, number of neutropenic episodes:7 | 15.4, number of neutropenic episodes: 41 | ? | P value not stated |
| median duration of neutropenia in days (ANC < 1000) | 2.1, SD = 0.5, number of neutropenic episodes:7 | 8.3, SD = 1.6, number of neutropenic episodes: 41 | ? | P value not stated | |
| Gisselbrecht 1997 | 1. cycle, median duration of neutropenia in days (ANC <500) | 1 (range 0‐8), N = 80 | 4 (range 0‐3), N = 80 | P < 0.001 | similar dataset available for ANC < 1000 |
| 2. cycle, median duration of neutropenia in days (ANC <500) | 1 (range 0‐6), N = 79 | 4 (range 0‐15), N = 73 | P < 0.001 | ||
| 3. cycle, median duration of neutropenia in days (ANC <500) | 0 (range 0‐5), N = 76 | 3 (range 0‐14), N = 67 | P < 0.001 | ||
| 4. cycle, median duration of neutropenia in days (ANC <500) | 1 (range 0‐9), N = 74 | 2 (range 0‐10), N = 63 | P < 0.001 | ||
| Dunlop MOPP 1998 | median duration of leucopenia (days/cycle with WBC <1x10⁹/L | 0.0 (range 0.0‐4.3) | 2.9 (range 0.0‐8.6) | P = 0.007 | |
| Dunlop MOPP/EVAP 98 | median duration of leucopenia (days/cycle with WBC <1x10⁹/L | 1.5 (range 0.0‐6.2) | 0.8 (range 0.0‐9.1) | P = 0.26 |
Duration of febrile neutropenia Two studies reported equal lengths of febrile neutropenia for the two treatment groups (Fridrik 1997; Dunlop MOPP 1998), while two other studies observed a longer duration of febrile neutropenia in the control group (Avilés 1994; Doorduijn 2003). Due to the very limited data available there is no conclusive evidence that G‐CSF or GM‐CSF reduce the duration of febrile neutropenia (see Table 10).
3. Duration of febrile neutropenia.
| Author | Outcome | G‐/GM‐CSF | Control | P value | Comments |
| Avilés 1994 | median duration of febrile episodes in days, ANC < 500, T: 38.5°C | 2.1, SD = 0.5, N =7 | 8.3, SD = 1.6, N = 41 (number of febrile episodes) | ? | P value not stated |
| Dunlop MOPP 1998 | median duration in days, ANC < 1000, T: > 38.2°C | 1 patient had FN of unknown duration | 4 pts had FN, duration 1,2 , 3, 7 days | ||
| Dunlop MOPP/EVAP 98 | median duration in days, ANC < 1000, T: > 38.2°C | 6 patients had FN, duration: 1, 1, 2, 2, 5, 9 days | 5 pts had FN, duration 1, 1, 2, 3.5, 20 days | ||
| Fridrik 1997 | median duration in days, ANC < 1000, T: > 37.5°C twice or > 38°C once | 0, range 0‐14, N = 36 | 1, range 0‐14, N = 36 | ||
| Doorduijn 2003 | median duration in days | 2, range 1‐14, N = 197 | 3, range 1‐32, N = 192 | 0.04 |
Hospital stay Six studies reported data on the duration of hospitalisation. Only one study reported the overall number of days in hospital (Doorduijn 2003). There was no significant difference between the study groups (5 days in the G‐CSF group, 6 days in the control group, P = 0.4). Most studies reported effectiveness and efficacy parameters on related measurements, e.g. chemotherapy‐related and chemotherapy‐unrelated services (Souêtre 1994), hospitalised days per cycle (Dunlop 1998), total number of hospitalised days (Avilés 1994), hospitalised days because of febrile neutropenia (Fridrik 1997) or number of patients hospitalised for more than 3 days for infection (Pettengell 1992). The data reported were too divergent to draw meaningful conclusions (see Table 11).
4. Stay in hospital.
| Author | Outcome | G‐CSF/GM‐CSF | Control | P value | Comments |
| Avilés 1994 | number of hospitalised days | 67 days (N = 20) | 389 days (N = 22) | range or standard deviation not stated, P values not specified | |
| Dunlop MOPP 1998 | median number of days of inpatient hospitalisation per cycle of chemotherapy | 0.2 days (range 0.0‐14.6, N = 13) | 2.21 days (range 0.0‐14.6, N = 12) | not significant | P values not specified |
| Dunlop MOPP/EVAP 98 | median number of days of inpatient hospitalisation per cycle of chemotherapy | 2.7 days (range 0.2‐8.3, N = 12) | 1.2 days (range 0.08‐8.4, N = 10) | not significant | P values not specified |
| Gerhartz 1993 | mean number of days in hospital for infection | 3.5 days (N = 59) | 8.0 days (N = 66) | P = 0.01 | range or standard deviation has not been stated |
| Pettengell 1992 | number of patients hospitalised for more than 3 days for infection | 20/41 | 20/39 | not significant | P values not specified |
| Souêtre 1994 | mean number of days, chemotherapy‐related services | 11.9 days (SD: 7.1, N = 82) | 11.4 days (SD:6.8, N = 80) | 0.61 | |
| mean number of days, chemotherapy‐unrelated services | 14.4 days (SD:10.5, N = 82) | 18.5 days (SD:12.6, N = 80) | 0.04 | ||
| Doorduijn 2003 | median overall number of days in hospital | 5 days (range: 0‐157, N =197) | 6 days (range 0‐111, N =192) | 0.40 |
Duration of parenteral antibiotic treatment In three studies (Souêtre 1994; Aglietta 2000; Doorduijn 2003) the duration of parenteral antibiotic treatment was shorter in the G‐/GM‐CSF treated group, but this was not statistically significant. A met‐analysis was not performed since the data did not appear to be normally distributed (see Table 12).
5. Duration of antibiotic use.
| Author | Outcome | G‐/GM‐CSF | Control | P value | Comments |
| Aglietta 2000 | mean duration of antibiotic treatment | 14.9, SD = 61.50, N = 30 | 18.4, SD = 47.70, N = 26 | P = 0.8 | antibiotic use is not differentiated for iv and po medication |
| Souêtre 1994 | mean duration of iv antibiotic treatment | 5.30, SD = 7.80, N = 82 | 8.90, SD = 8.80, N = 80 | P = 0.006 | same patient population as Gisselbrecht 1997 |
| Doorduijn 2003 | median duration of antibiotic treatment | 0 days (range 0‐126, N = 197) | 6 days (range 0‐180, N = 192) | P = 0.006 |
Relative Dose Intensity Relative dose intensity was reported in 9 out of 13 studies. In all but one study (Dunlop MOPP/EVAP 98), the G‐CSF or GM‐CSF treated group received a higher dose intensity than the control group. In three studies, the overall differences were statistically significant (Pettengell 1992; Fridrik 1997; Gisselbrecht 1997). Other studies found differences for single substances, but the data were not analysed as the required standard deviation was reported in only two studies (Gisselbrecht 1997; Doorduijn 2003) (see Table 13).
6. Relative Dose Intensity.
| Author | Dose Intensity | Substance | G‐/GM‐CSF | Control | P value | comments |
| Avilés 1994 | defined as by Hryniuk | Cyclophosphamide | 73%, N =20 | 61%, N =22 | ‐ | P values were not specified. Overall more chemotherapeutic substances were used, but RDI not calculated by the study author. Not stated whether mean or median values. |
| Epirubicin | 82% | 51% | ‐ | |||
| Etoposide | 83% | 67% | ‐ | |||
| Cytosine arabinoside | 79% | 53% | ‐ | |||
| Mitoxantrone | 87% | 49% | ‐ | |||
| Procarbazine | 89% | 60% | ‐ | |||
| Ösby 2003 | mean cumulative received dose intensity in cycle 8 | Doxorubicin, Mitoxantrone, Cyclophosphamide | CHOP: 92.6, SD = 9.4, CNOP: 92.3, SD = 8.68 | CHOP: 88.8, SD = 10.09, CNOP: 89.8, SD = 10.17 | not significant | |
| Dunlop MOPP 1998 | median received dose intensity | MOPP | 84%, range 59‐103%, N =1 3 | 82%, range 57‐99%, N = 12 | P = 0.57 | |
| Dunlop MOPP/EVAP 98 | median received dose intensity | MOPP/EVAP | 96%, range 67‐105%, N = 12 | 97%, range 71‐104%, N = 10 | P = 0.53 | |
| Fridrik 1997 | defined as by Hryniuk | CEOP‐IMVP‐Dexa | 82.3%, N = 38 | 76.2%, N = 36 | P = 0.041 | not stated whether mean or median |
| Gerhartz 1993 | defined as by Hryniuk; median received dose intensity | COP‐BLAM | median =85%, mean = 85% | median = 84%, mean = 81% | ‐ | efficiency analysis: based only on patients, that received more than 70% of the study drug, 137 of 172 pts evaluated |
| Gisselbrecht 1997 | defined as by Hryniuk, mean received dose intensity | adriamycin and cyclophosphamide | 93.3%, SD = 13.5, N = 73 | 80.1%, SD = 13, N = 63 | P = 0.0001 | evaluable for this analysis, more different substances were administered, but not calculated for RDI, only 136 of 162 pts evaluated |
| Pettengell 1992 | defined as by Hryniuk, median received dose intensity | Adriamycin | 96%, N = 39 | 85%, N = 41 | P = 0.0004 | |
| Cyclophosphamide | 96% | 83% | P = 0.0001 | |||
| Etoposide | 94% | 82% | P = 0.02 | |||
| Zinzani 1997 | defined as by Hryniuk | VNCOP‐B | 95%, N = 77 | 85%, N = 72 | not significant | not stated whether mean or median |
| Doorduijn 2003 | median received dose intensity | Cyclophosphamide | 96.3% | 93.9% | P = 0.01 | |
| Doxorubicin | 95.4% | 93.3% | P = 0.04 | |||
| overall CHOP | 95.1% | 93.4% | not significant |
Other outcomes Thrombocytopenia The rate or the degree of thrombocytopenia was reported in 6 out of 13 trials (Pettengell 1992; Gerhartz 1993; Fridrik 1997; Zinzani 1997; Dunlop 1998; Aglietta 2000). As the available data were measured in different, non‐convertible units, it was not possible to conduct a meta‐analysis. Overall, Fridrik 1997 showed a significant difference in the mean platelet nadir for thrombocytopenia in favour of the control group. Some studies showed inconsistent and statistically non‐significant results in favour of the G‐/GM‐CSF group (Dunlop MOPP 1998; Aglietta 2000). Others favoured the control group (Gerhartz 1993; Dunlop MOPP/EVAP 98) or reported similar results for both treatment groups (Pettengell 1992; Zinzani 1997). Overall, there is no conclusive evidence that G‐CSF or GM‐CSF influence the rate or the degree of thrombocytopenia (see Table 14).
7. Thrombocytopenia.
| Author | outcome | G‐CSF/GM‐CSF | control | P value | comments |
| Dunlop MOPP 1998 | median platelets nadir [ /µl] | 41, range 6‐193, N =13 | 30, range 7‐253, N = 12 | not significant | P values not specified |
| Dunlop MOPP/EVAP 98 | median platelets nadir [ /µl] | 14, range1‐76, N = 12 | 65, range 6‐168, N = 10 | not significant | P values not specified |
| Fridrik 1997 | mean platelet nadir [ /µl] | 95, N = 38 | 152, N = 36 | P = 0.000004 | range or standard deviation not specified |
| Gerhartz 1993 | incidence of thrombocytopenia < 25/µl | 8/89 | 4/87 | not significant | P values not specified |
| Aglietta 2000 | incidence of thrombocytopenia < 50 /µl | 0/30 | 2/26 | not significant | P values not specified |
| Pettengell 1992 | incidence of thrombocytopenia and platelets transfusion requirements | similar in both groups | similar in both groups | no numerical data specified | |
| Zinzani 1997 | incidence of thrombocytopenia | similar in both groups | similar in both groups | no numerical data specified |
Anaemia The rate or the degree of anaemia was reported in 4 out of 13 trials (Pettengell 1992; Fridrik 1997; Zinzani 1997; Dunlop 1998). As the available data were measured in different, non‐convertible units it was not possible to conduct a meta‐analysis. Fridrik 1997 showed a statistically significant difference in the haemoglobin level in favour of the control group. The other studies found no significant difference in effect between the two treatment groups. There is no conclusive evidence that G‐CSF or GM‐CSF influence the incidence or degree of anaemia (see Table 15).
8. Anaemia.
| Author | Outcome | G‐CSF/GM‐CSF | Control | P value | comments |
| Dunlop MOPP 1998 | median haemoglobin nadir [g/dl] | 8.1, range 6.3‐10.1, N = 13 | 7.4, range 4.9‐11.3, N = 12 | not significant | P values not specified |
| Dunlop MOPP/EVAP 98 | median haemoglobin nadir [g/dl] | 7.2, range 4.6‐8.5, N = 12 | 8.6, range 7.3‐9.7, N = 10 | not significant | P values not specified |
| Fridrik 1997 | mean haemoglobin nadir [g/dl] | 8.395, N = 38 | 9.278, N = 36 | P = 0.00558 | range or standard deviation not specified |
| Pettengell 1992 | incidence of anaemia and transfusion requirements | similar in both groups | similar in both groups | no numerical data specified | |
| Zinzani 1997 | incidence of anaemia | similar in both groups | similar in both groups | no numerical data specified |
Potential biases To assess potential biases, previously specified sensitivity and subgroup analysis were performed. Selection bias Information on the method of allocation concealment was not available in three studies (Pettengell 1992; Bastion 1993; Burton 2006), but concealment of allocation was adequate in all the other studies. However, inclusion or exclusion of these three studies did not significantly affect any of the outcomes analysed (neutropenia, febrile neutropenia, infection, overall survival, bone pain).
Performance bias Five of the included studies were placebo‐controlled (Bastion 1993; Gerhartz 1993; Avilés 1994; Gisselbrecht 1997; Aglietta 2000). However, sensitivity analysis for placebo‐controlled and open label studies did not show significant differences for objective outcome measures, such as neutropenia, febrile neutropenia, infection, tumour response and overall survival, or for subjective outcome measures such as bone pain.
Attrition bias Seven studies (Cunningham*; Pettengell 1992; Avilés 1994; Gisselbrecht 1997; Aglietta 2000; Doorduijn 2003; Ösby 2003) and one substudy (Dunlop MOPP 1998) were based on an intention‐to‐treat analysis and included all patients who were initially assigned to treatment in the final analysis. The other studies were based on full set analysis and excluded patients who did not meet the eligibility criteria, had major protocol violation or did not receive any study medication. To assess the influence of the excluded data we performed a worst case‐best case scenario analysis. None of the results analysed differed markedly from the pooled data reported. One study reported an additional per protocol analysis of patients who received at least 70% of the study medication (Gerhartz 1993). Inclusion of these data resulted in a significantly reduced risk of parenteral antibiotic treatment in the fixed effect model (RR 0.72; 95% CI 0.54 to 0.97). However, this result was not robust in the random effects model, where more weight is given to smaller studies (RR 0.72; 95% CI 0.42 to 1.22). We excluded these data from the final analysis as we consider per protocol analysis to be less reliable than intention‐to‐treat.
Publication bias The funnel plot analysis of the data for complete response and parenteral antibiotic treatment showed an imbalance of positive and negative results, indicating that studies with negative findings might be under‐represented. Taking this into consideration, the estimated benefit of G‐CSF and GM‐CSF in improving complete response and reducing the need for antibiotic treatment may be overestimated.
Reporting bias Overall, none of the outcomes showed a significant difference between published and unpublished or unreported data.
In addition, subgroup analyses were performed to investigate the influence of clinical diversity of the included trials. Use of antibiotic prophylaxis showed a difference between the analysed subsets only for neutropenia, as mentioned before. Other results such as OS, complete response, febrile neutropenia, infection and bone pain were not influenced. Use of G‐CSF or GM‐CSF resulted in a significant difference only for the rate of bone pain. Different disease entities (HD and NHL) did not show significant differences in any of the results analysed.
Discussion
The results of this meta‐analysis are as follows.
There is no evidence that G‐CSF and GM‐CSF improve overall survival or freedom from treatment failure when used as an adjunct in conventional chemotherapy regimens.
Granulopoiesis‐stimulating factors (G‐CSF and GM‐CSF) reduce the risk of neutropenia, febrile neutropenia and infection in patients undergoing conventional chemotherapy for malignant lymphoma.
Our review is the first comprehensive meta‐analysis evaluating the effects of G‐CSF or GM‐CSF in patients with malignant lymphoma undergoing conventional chemotherapy. Other analyses included either studies with smaller numbers of patients or have heterogeneous populations which include solid tumours and haematological malignancies (ASCO Guidelines 1994; ASCO Guidelines 1996; Rusthoven 1998; ASCO Guidelines 2000; Lyman 2002; ASCO Guidelines 2006; Kuderer 2007; Sung 2007). The current, updated review includes thirteen prospectively randomised studies with 2607 patients. In addition, we included previously unreported data on outcome, patient characteristics and study design provided on request by the authors of the original publications. One previously unpublished study was also included. The robustness of all results was tested by sensitivity and subgroup analysis based on prospectively defined parameters.
The most convincing effects of G‐CSF and GM‐CSF were on neutropenia. G‐CSF and GM‐CSF reduced the risk of lymphoma patients having neutrophil counts below 0.5 x 10⁹/litre by 33%. G‐CSF reduced the risk of febrile neutropenia (ANC below 1.0 x 10⁹/litre) by 26% and by 41% when ANC was defined as < 0.5 x 10⁹/litre. The risk of acquiring infection when given G‐CSF or GM‐CSF was also reduced by 26%. However, there is no evidence that G‐CSF and GM‐CSF decrease overall or infection related mortality during chemotherapy.
Data presented in this analysis suggest smaller effects than previously reported (ASCO Guidelines 1994; ASCO Guidelines 1996; Rusthoven 1998; ASCO Guidelines 2000; Hackshaw 2004; ASCO Guidelines 2006; Kuderer 2007). Our results are comparable to the most comprehensive meta‐analysis in all cancer patients by Sung 2007, where the subgroup of patients with solid tumours or lymphoma has a relative risk reduction for febrile neutropenia of 36% (RR 0.64; 95% CI 0.53 to 0.76).
Publication bias due to under‐reporting of unexpected or negative data is one of the major obstacles in conducting meta‐analyses. Comprehensive literature searching and detection of unreported data can minimise this bias. The funnel plot analysis of the data for complete response showed an imbalance of positive and negative results, indicating that studies with negative findings might be under‐represented. We identified two studies on GM‐CSF that were never published and were not included in this review (Liberati 1991; Unpublished trial). Taking this into consideration, the true effect of G‐CSF and GM‐CSF on complete response may be even less than indicated by our analysis.
According to Deeks 2001, meta‐analysis of continuous outcome data, e.g. duration of neutropenia and number of days in hospital, requires a normal distribution as well as the mean response and the standard deviation. However, most of the included studies did not report these parameters, rendering a meta‐analysis impossible. Single studies in malignant lymphoma (Gisselbrecht 1997; Dunlop 1998) and solid tumours (Crawford 1991; Bui 1995; Chevallier 1995; Mayordomo 1995) documented a significantly shorter time to neutrophil recovery in patients treated with G‐CSF. In contrast, there is no convincing evidence that G‐CSF and GM‐CSF decrease the length of febrile neutropenia in patients with both malignant lymphoma (Fridrik 1997; Dunlop 1998) and solid tumours (Crawford 1991; Bui 1995; Chevallier 1995) who are undergoing moderately myelosuppressive chemotherapy.
Apart from reducing infections and related complications, G‐CSF and GM‐CSF are used in clinical practice to maintain dose intensities. Retrospective analysis indicated that a higher relative dose intensity may translate into better tumour control (DeVita 1987; Lepage 1993). A significantly higher received dose intensity in patients receiving G‐/GM‐CSF was demonstrated in patients with small cell lung cancer (Trillet‐Lenoir 1993; Woll 1995; Fukuoka 1997), breast cancer (de Graaf 1996) and malignant lymphoma (Pettengell 1992; Fridrik 1997; Gisselbrecht 1997; Doorduijn 2003). However, we were unable to quantify the received dose intensity described in the included studies. Most of the G‐/GM‐CSF treated groups received more chemotherapy compared with the corresponding control groups; four studies demonstrated a statistically significant difference for the main components (Pettengell 1992; Fridrik 1997; Gisselbrecht 1997; Doorduijn 2003).
There was no evidence that the addition of G‐CSF or GM‐CSF to standard chemotherapy improves tumour response, FFTF or OS in lymphoma patients. The most likely explanation for the very similar complete response rates in patients receiving or not receiving G‐/GM‐CSF is that the studies focused on the prevention of neutropenia and neutropenia‐related events. Studies comparing dose escalated or time intensified chemotherapy regimens with a standard chemotherapy regimen were explicitly excluded from the present analysis.
Adverse effects attributable to G‐CSF and GM‐CSF, such as bone pain and skin reactions, were more frequently reported in patients treated with G‐CSF and GM‐CSF than the control group. There was no evidence that thrombosis or related complications occur more frequently in the G‐CSF and GM‐CSF treated groups than in the control group (odds ratio 1.31; 95% CI 0.54 to 3.19). These findings are consistent with a previous meta‐analysis of thrombosis in patients with various malignancies treated with haematopoietic growth factors (odds ratio 1.67; 95% CI 0.92 to 3.04, N = 838) (Barbui 1996). Overall, more patients receiving GM‐CSF (24/117) discontinued the study due to adverse effects compared with patients receiving G‐CSF. Based on these data, G‐CSF seems to be superior to GM‐CSF in terms of tolerability. However, it should be taken into consideration that this result is based on an indirect comparison, and that data for G‐CSF may simply not have been reported. Similarly, subgroup analysis suggests that patients receiving G‐CSF are more likely to develop bone pain than patients receiving GM‐CSF. However, results from single studies, comparing directly G‐CSF and GM‐CSF, do not support this hypothesis (Beveridge 1998; Alvarado Ibarra 1999).
Although G‐CSF and GM‐CSF are cost intensive drugs, economic evaluations have demonstrated an overall cost reduction of treatment due to fewer and shorter hospital admissions (Lyman 1995; Lyman 1998). These calculations were based on the assumption that G‐CSF would reduce the risk of febrile neutropenia by 50%. However, this figure relates to a randomised controlled study including 211 patients with small cell lung cancer (Crawford 1991). In our updated analysis, the relative risk reduction for febrile neutropenia with ANC below 1.0 x 10⁹ per litre was 26% and for ANC below 0.5 x 10⁹ per litre 41% in lymphoma patients. A threshold risk for febrile neutropenia in a given cancer population of 40% was estimated at which the added costs of G‐CSF would be counterbalanced by the reduced direct hospital costs for febrile neutropenia (Lyman 1995). An updated analysis added the indirect institutional costs of care for patients with febrile neutropenia to the direct costs, reducing the potential break‐even point to a febrile neutropenia risk of 20% (Lyman 1998). In addition, this threshold was swon to be effective in breast cancer patients receiving chemotherapy (Vogel 2005) and it now recommended in current guidelines (EORTC Guidelines 2006; ASCO Guidelines 2006).
In addition to the prevention of neutropenia and related effects, growth factors are currently used in high dose chemotherapy settings to help generate haematopoietic stem cells and to support recovery after myeloablative treatment (de Witte 1992; Pettengell 1993). More recently, growth factors have been used to not only facilitate not only the administration of the planned chemotherapy in dose and time but also to assist haematopoietic recovery in time‐ or dose‐intensified regimen. There are strong arguments for this notion stemming from three large prospectively randomised trials in patients with HD (Diehl 2003) and NHL Preundschuh 2004a; Preundschuh 2004b). Thus, a further meta‐analysis to prove the assumed role of haematopoietic growth factors in dose escalation is warranted.
Authors' conclusions
Implications for practice.
There is no evidence that G‐CSF or GM‐CSF improve OS or FFTF. We demonstrated that G‐CSF and GM‐CSF significantly reduce the risk for neutropenia, febrile neutropenia and infections in patients undergoing conventional chemotherapy for malignant lymphoma. .
Implications for research.
Clinical studies and meta‐analyses to prove the effectiveness of growth factors in assisting haematopoietic recovery in time‐ or dose‐intensified regimen are warranted.
What's new
| Date | Event | Description |
|---|---|---|
| 8 June 2008 | New search has been performed | Review updated |
| 7 June 2008 | New citation required but conclusions have not changed | A new search was done in April 2008, with one additional study identified. A total of 13 randomized controlled trials were included in this review update. |
History
Protocol first published: Issue 3, 2001 Review first published: Issue 2, 2002
| Date | Event | Description |
|---|---|---|
| 22 April 2004 | New citation required and conclusions have changed | Substantive amendment. We identified one full text publication (Ösby 2003) to a study which was previously included on the basis of an abstract publication (Björkholm 1999). Additionally we identified one study which has been recently published (Doorduijn 2003). Of these publications we included only reported data. Updating the review we include now 12 trials with 1.823 patients. Compared to the old version with 11 studies and 1.434 patients none of the results changed significantly. We now include results on Quality of Life. |
Acknowledgements
We thank all authors and coworkers of primary studies who provided us with additional study data: M. Aglietta, Luis Agustin Aviles, Lorraine Bishop, Magnus Björkholm, D. Cunningham, Jeanette K. Doorduijn, D.J. Dunlop, Michael A. Fridrik, Christian Gisselbrecht, Filippo Montemurro, Jim Paul and Pier Luigi Zinzani. Special thanks to the CHMG editors, affiliated consumers and members of the CHMG editorial base for critical advice and strong support: Lia Alewijnse‐Poelman, Benjamin Djulbegovic, Céline Fournier, Alexander Greb, Gail Higgins, Sabine Kluge, Thilo Kober, Lena Specht, Ralph Meyer, Sue Richards, Keith Wheatley. We also would like to thank Douglas Altman, Christine Clar, Otávio Clark, Jeremy Franklin, Guido Grass, Atsuko Hasegawa‐Rahnenführer, Dirk Hasenclever, Allison Hirst, Carol Lefebvre, Mark Lodge, Bernd Richter, Beate Pfistner, Stefan Sauerland, Nicole Skoetz, Sven Trelle and Chugai Pharma (see Potential conflict of interest).
The editorial base of the Cochrane Haematological Malignancies Group is funded, as part of the Competence Network Malignant Lymphomas, by the German Ministry of Education and Research (BMBF).
Appendices
Appendix 1. MEDLINE search strategy
#1 the highly sensitive strategy for identifying reports of randomised controlled trials (Dickersin 1994) #2 G?CSF* #3 GM?CSF* #4 CSF* #5 RHUG?CSF* #6 RHUGM?CSF* #7 RHG?CSF* #8 RHGM?CSF* #9 R?METHUG?CSF* #10 (H?EMATO* near GROWTH* near FACTOR*) #11 ((COLON* near STIMULAT*) near FACTOR*) #12 (GRANULO?YT* near FA?TOR*) #13 (MA?ROPHAG* near FA?TOR*) #14 FILGRASTIM* #15 LENOGRASTIM* #16 REGRARMOSTIM* #17 ECOGRARMOSTIM* #18 MOLGRARMOSTIM* #19 SARGRARMOSTIM* #20 NEUPOGEN* #21 LEUKINE #22 LEUCOMAX #23 GRANOCYTE #24 COLONY‐STIMULATING‐FACTORS*:ME #25 (#2 or #3 or #4 or #5 or #6 or #7 or #8 or #9 or #10 or #11 or #12 or #13 or #14 or #15 or #16 or #17 or #18 or #19 or #20 or #21 or #22 or #23 or #24) #26 LYMPHOMA*:ME #27 HEMATOLOGIC‐NEOPLASMS*:ME #28 LYMPHOM* #29 HODGKIN* #30 NON‐HODGKIN* #31 NONHODGKIN* #32 IMMUNO?YTOM* #33 ((HAIR* next CELL*) near Leu*) #34 BURKIT* #35 SEZARY* #36 (MYCOS* next FUNGO*) #37 (HEMATO* near MALIGN*) #38 (HAEMATO* near MALIGN*) #39 (HEMATO* near NEOPLAS*) #40 (HAEMATO* near NEOPLAS*) #41 (#26 or #27 or #28 or #29 or #30 or #31or #32 or #33 or #34 or #35 or #36 or #37or #38 or #39 or #40) #42 ( #1 and #25 and #41)
Data and analyses
Comparison 1. G‐CSF/GM‐CSF versus control.
| Outcome or subgroup title | No. of studies | No. of participants | Statistical method | Effect size |
|---|---|---|---|---|
| 1 Overall survival | 11 | 2221 | Peto Odds Ratio (95% CI) | 0.97 [0.87, 1.09] |
| 2 Freedom from treatment failure | 6 | 718 | Peto Odds Ratio (95% CI) | 1.11 [0.91, 1.35] |
| 3 Neutropenia | 8 | 1013 | Risk Ratio (M‐H, Fixed, 95% CI) | 0.67 [0.60, 0.73] |
| 4 Febrile Neutropenia, ANC < 1000 | 5 | 360 | Risk Ratio (M‐H, Fixed, 95% CI) | 0.74 [0.62, 0.89] |
| 5 Febrile Neutropenia, ANC < 500 | 3 | 604 | Risk Ratio (M‐H, Fixed, 95% CI) | 0.59 [0.48, 0.72] |
| 6 Infection | 11 | 1292 | Risk Ratio (M‐H, Fixed, 95% CI) | 0.74 [0.64, 0.85] |
| 7 Parenteral antibiotic treatment | 4 | 359 | Risk Ratio (M‐H, Fixed, 95% CI) | 0.82 [0.57, 1.18] |
| 8 Overall mortality during chemotherapy | 11 | 1170 | Risk Ratio (M‐H, Fixed, 95% CI) | 0.93 [0.60, 1.43] |
| 9 Infection related mortality during chemotherapy | 12 | 1835 | Risk Ratio (M‐H, Fixed, 95% CI) | 0.93 [0.51, 1.71] |
| 10 Complete response | 13 | 2368 | Risk Ratio (M‐H, Fixed, 95% CI) | 1.03 [0.95, 1.10] |
| 11 Adverse events: bone pain | 9 | 1204 | Risk Ratio (M‐H, Fixed, 95% CI) | 3.57 [2.09, 6.12] |
| 12 Adverse events: thrombosis and related complications (TIA, MI, cerebral non‐hemorhagic infarction) | 5 | 425 | Risk Ratio (M‐H, Fixed, 95% CI) | 1.29 [0.56, 3.01] |
| 13 Adverse events: skin rash | 2 | 232 | Risk Ratio (M‐H, Fixed, 95% CI) | 7.69 [2.84, 20.82] |
| 14 Adverse events: injection site reaction | 2 | 337 | Risk Ratio (M‐H, Fixed, 95% CI) | 6.55 [3.01, 14.25] |
| 15 Adverse events: myalgia | 2 | 232 | Risk Ratio (M‐H, Fixed, 95% CI) | 0.94 [0.60, 1.45] |
| 16 Adverse events: mucositis | 4 | 696 | Risk Ratio (M‐H, Fixed, 95% CI) | 0.95 [0.64, 1.41] |
| 17 Adverse events: headache | 2 | Risk Ratio (M‐H, Fixed, 95% CI) | Totals not selected | |
| 18 Withdrawals due to adverse events | 2 | Risk Ratio (M‐H, Fixed, 95% CI) | Subtotals only | |
| 18.1 GM‐CSF | 2 | 228 | Risk Ratio (M‐H, Fixed, 95% CI) | 4.97 [2.07, 11.96] |
1.1. Analysis.
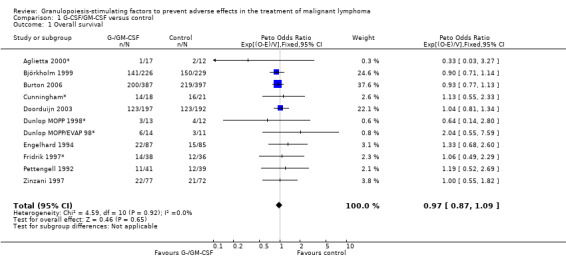
Comparison 1 G‐CSF/GM‐CSF versus control, Outcome 1 Overall survival.
1.2. Analysis.
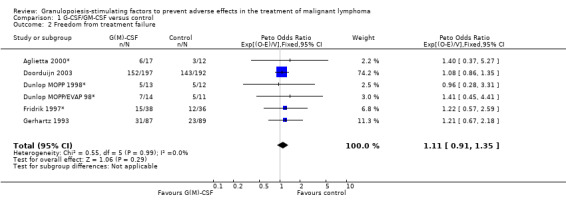
Comparison 1 G‐CSF/GM‐CSF versus control, Outcome 2 Freedom from treatment failure.
1.3. Analysis.
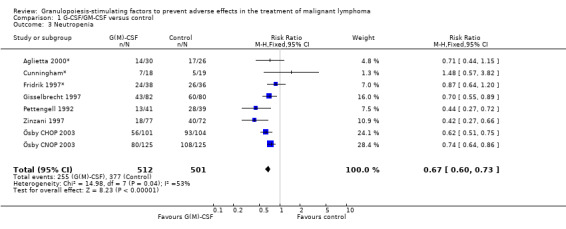
Comparison 1 G‐CSF/GM‐CSF versus control, Outcome 3 Neutropenia.
1.4. Analysis.
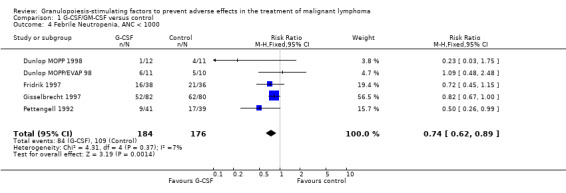
Comparison 1 G‐CSF/GM‐CSF versus control, Outcome 4 Febrile Neutropenia, ANC < 1000.
1.5. Analysis.
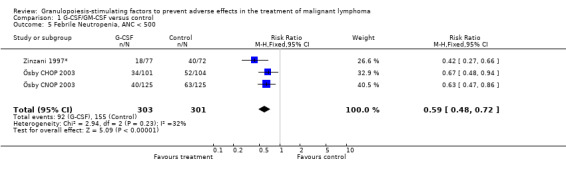
Comparison 1 G‐CSF/GM‐CSF versus control, Outcome 5 Febrile Neutropenia, ANC < 500.
1.6. Analysis.
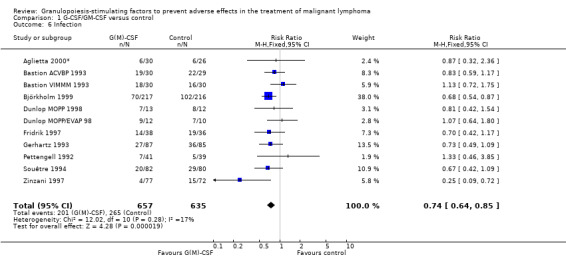
Comparison 1 G‐CSF/GM‐CSF versus control, Outcome 6 Infection.
1.7. Analysis.
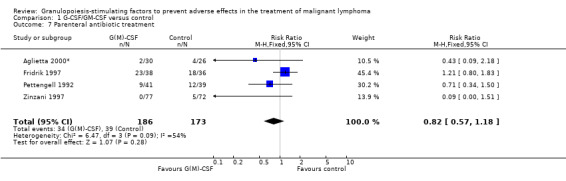
Comparison 1 G‐CSF/GM‐CSF versus control, Outcome 7 Parenteral antibiotic treatment.
1.8. Analysis.
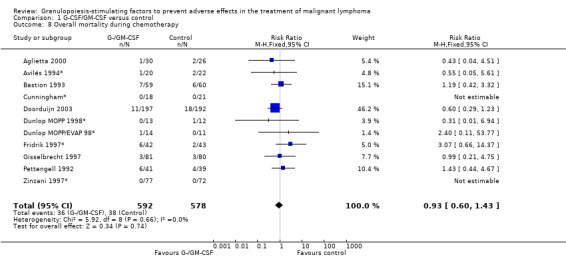
Comparison 1 G‐CSF/GM‐CSF versus control, Outcome 8 Overall mortality during chemotherapy.
1.9. Analysis.
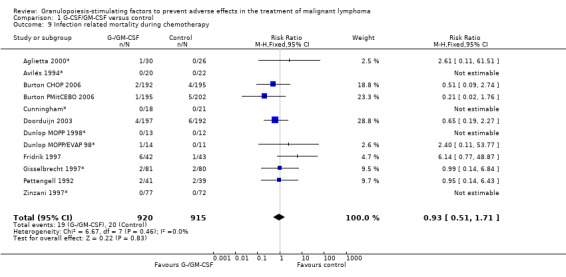
Comparison 1 G‐CSF/GM‐CSF versus control, Outcome 9 Infection related mortality during chemotherapy.
1.10. Analysis.
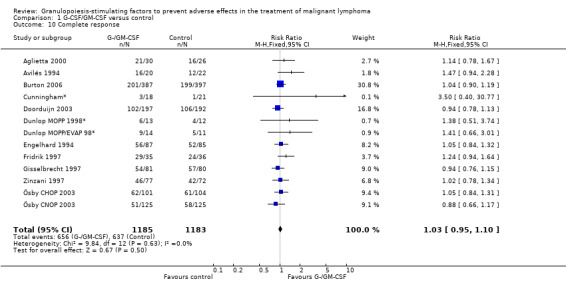
Comparison 1 G‐CSF/GM‐CSF versus control, Outcome 10 Complete response.
1.11. Analysis.
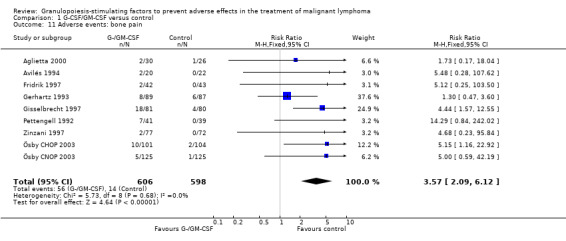
Comparison 1 G‐CSF/GM‐CSF versus control, Outcome 11 Adverse events: bone pain.
1.12. Analysis.
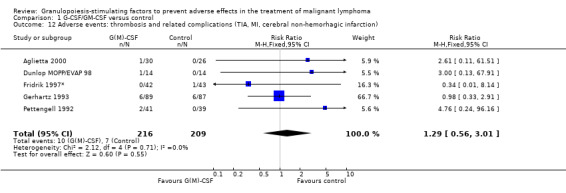
Comparison 1 G‐CSF/GM‐CSF versus control, Outcome 12 Adverse events: thrombosis and related complications (TIA, MI, cerebral non‐hemorhagic infarction).
1.13. Analysis.
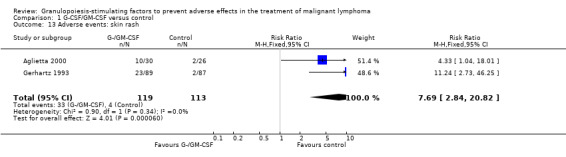
Comparison 1 G‐CSF/GM‐CSF versus control, Outcome 13 Adverse events: skin rash.
1.14. Analysis.
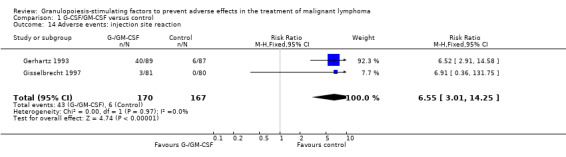
Comparison 1 G‐CSF/GM‐CSF versus control, Outcome 14 Adverse events: injection site reaction.
1.15. Analysis.
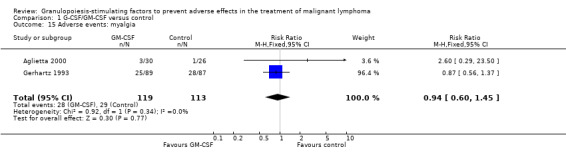
Comparison 1 G‐CSF/GM‐CSF versus control, Outcome 15 Adverse events: myalgia.
1.16. Analysis.
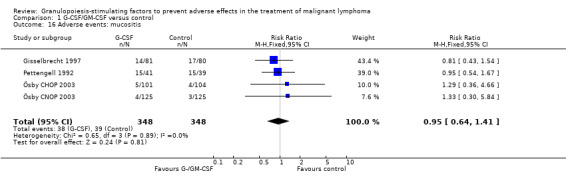
Comparison 1 G‐CSF/GM‐CSF versus control, Outcome 16 Adverse events: mucositis.
1.17. Analysis.
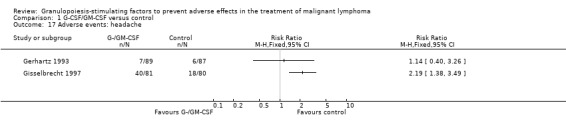
Comparison 1 G‐CSF/GM‐CSF versus control, Outcome 17 Adverse events: headache.
1.18. Analysis.
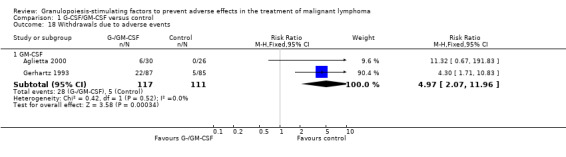
Comparison 1 G‐CSF/GM‐CSF versus control, Outcome 18 Withdrawals due to adverse events.
Comparison 2. Sensitivity analysis: Overall survival.
| Outcome or subgroup title | No. of studies | No. of participants | Statistical method | Effect size |
|---|---|---|---|---|
| 1 GM‐CSF versus G‐CSF | 11 | 2221 | Hazard Ratio (95% CI) | 0.97 [0.86, 1.09] |
| 1.1 GM‐CSF | 2 | 201 | Hazard Ratio (95% CI) | 1.19 [0.63, 2.27] |
| 1.2 G‐CSF | 9 | 2020 | Hazard Ratio (95% CI) | 0.96 [0.85, 1.09] |
| 2 HD versus NHL | 11 | 2221 | Hazard Ratio (95% CI) | 0.97 [0.86, 1.09] |
| 2.1 Hodgkin's disease | 3 | 79 | Hazard Ratio (95% CI) | 1.00 [0.40, 2.46] |
| 2.2 Non‐Hodgkin's lymphoma | 8 | 2142 | Hazard Ratio (95% CI) | 0.97 [0.86, 1.09] |
| 3 Age | 11 | 2221 | Hazard Ratio (95% CI) | 0.97 [0.86, 1.09] |
| 3.1 Adults, all ages | 7 | 444 | Hazard Ratio (95% CI) | 1.13 [0.80, 1.59] |
| 3.2 Adults, age older 60 | 4 | 1777 | Hazard Ratio (95% CI) | 0.95 [0.84, 1.08] |
| 4 Antibiotic prophylaxis | 11 | 2221 | Hazard Ratio (95% CI) | 0.97 [0.86, 1.09] |
| 4.1 No antibiotic prophylaxis given | 8 | 1208 | Hazard Ratio (95% CI) | 0.99 [0.85, 1.16] |
| 4.2 Antibiotic prophylaxis given | 3 | 1013 | Hazard Ratio (95% CI) | 0.95 [0.79, 1.13] |
| 5 Blinded versus open label studies | 11 | 2221 | Hazard Ratio (95% CI) | 0.97 [0.86, 1.09] |
| 5.1 Placebo controlled studies | 2 | 201 | Hazard Ratio (95% CI) | 1.19 [0.63, 2.27] |
| 5.2 Open label studies | 9 | 2020 | Hazard Ratio (95% CI) | 0.96 [0.85, 1.09] |
| 6 Concealed allocation versus concealment of allocation unclear | 11 | 2221 | Hazard Ratio (95% CI) | 0.97 [0.86, 1.09] |
| 6.1 Allocation concealed | 9 | 1357 | Hazard Ratio (95% CI) | 0.99 [0.85, 1.15] |
| 6.2 Method of allocation unclear | 2 | 864 | Hazard Ratio (95% CI) | 0.94 [0.78, 1.14] |
| 7 Size of studies | 11 | 2221 | Hazard Ratio (95% CI) | 0.97 [0.86, 1.09] |
| 7.1 Study size <100 | 6 | 272 | Hazard Ratio (95% CI) | 1.06 [0.71, 1.58] |
| 7.2 Study size >100 | 5 | 1949 | Hazard Ratio (95% CI) | 0.96 [0.85, 1.09] |
| 8 Duration of follow‐up | 11 | 2221 | Hazard Ratio (95% CI) | 0.97 [0.86, 1.09] |
| 8.1 Follow‐up 1‐2 years | 3 | 401 | Hazard Ratio (95% CI) | 1.15 [0.78, 1.70] |
| 8.2 Follow‐up 2‐5 years | 4 | 1702 | Hazard Ratio (95% CI) | 0.95 [0.84, 1.08] |
| 8.3 Follow‐up 5‐8 years | 4 | 118 | Hazard Ratio (95% CI) | 1.08 [0.61, 1.89] |
2.1. Analysis.
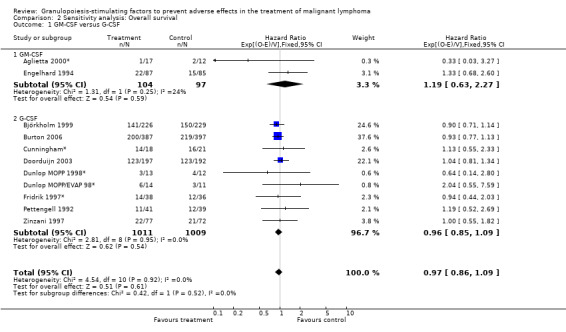
Comparison 2 Sensitivity analysis: Overall survival, Outcome 1 GM‐CSF versus G‐CSF.
2.2. Analysis.
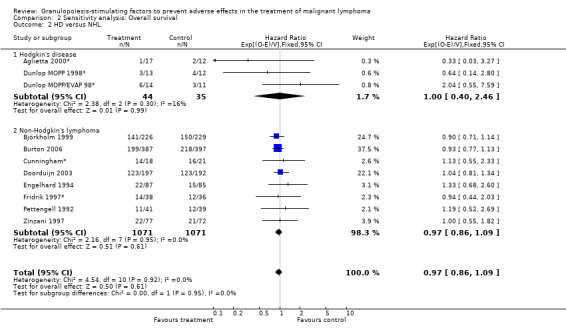
Comparison 2 Sensitivity analysis: Overall survival, Outcome 2 HD versus NHL.
2.3. Analysis.
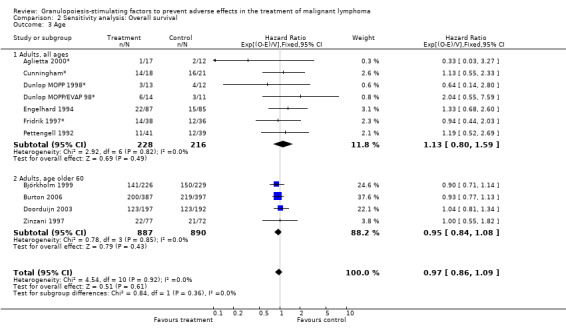
Comparison 2 Sensitivity analysis: Overall survival, Outcome 3 Age.
2.4. Analysis.
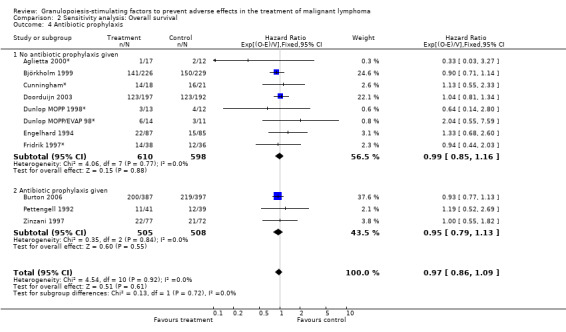
Comparison 2 Sensitivity analysis: Overall survival, Outcome 4 Antibiotic prophylaxis.
2.5. Analysis.
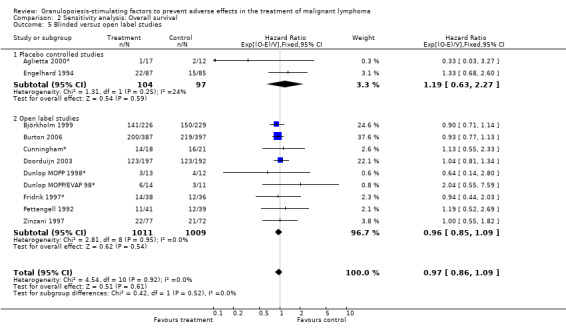
Comparison 2 Sensitivity analysis: Overall survival, Outcome 5 Blinded versus open label studies.
2.6. Analysis.
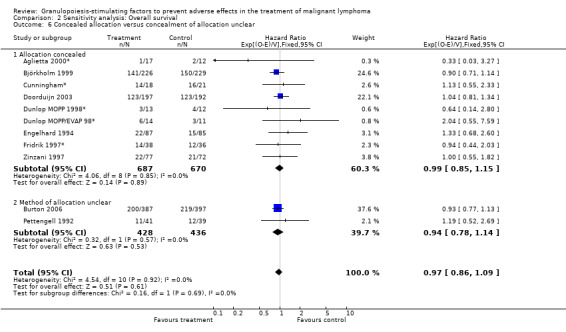
Comparison 2 Sensitivity analysis: Overall survival, Outcome 6 Concealed allocation versus concealment of allocation unclear.
2.7. Analysis.
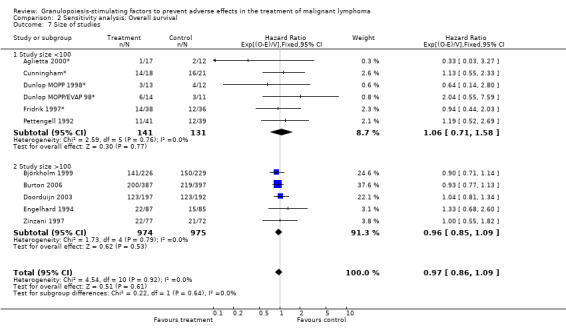
Comparison 2 Sensitivity analysis: Overall survival, Outcome 7 Size of studies.
2.8. Analysis.
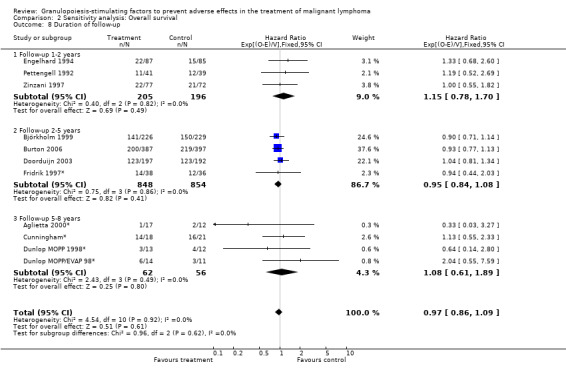
Comparison 2 Sensitivity analysis: Overall survival, Outcome 8 Duration of follow‐up.
Comparison 3. Sensitivity analysis: Neutropenia.
| Outcome or subgroup title | No. of studies | No. of participants | Statistical method | Effect size |
|---|---|---|---|---|
| 1 G‐CSF versus GM‐CSF | 8 | 1013 | Risk Ratio (M‐H, Fixed, 95% CI) | 0.67 [0.60, 0.73] |
| 1.1 GM‐CSF | 1 | 56 | Risk Ratio (M‐H, Fixed, 95% CI) | 0.71 [0.44, 1.15] |
| 1.2 G‐CSF | 7 | 957 | Risk Ratio (M‐H, Fixed, 95% CI) | 0.66 [0.60, 0.73] |
| 2 HD versus NHL | 8 | 1013 | Risk Ratio (M‐H, Fixed, 95% CI) | 0.67 [0.60, 0.73] |
| 2.1 Hodgkin's disease | 1 | 56 | Risk Ratio (M‐H, Fixed, 95% CI) | 0.71 [0.44, 1.15] |
| 2.2 Non‐Hodgkin's lymphoma | 7 | 957 | Risk Ratio (M‐H, Fixed, 95% CI) | 0.66 [0.60, 0.73] |
| 3 Age | 8 | 1013 | Risk Ratio (M‐H, Fixed, 95% CI) | 0.67 [0.60, 0.73] |
| 3.1 Adults, all age groups | 5 | 409 | Risk Ratio (M‐H, Fixed, 95% CI) | 0.71 [0.60, 0.84] |
| 3.2 Adults, age older 60 | 3 | 604 | Risk Ratio (M‐H, Fixed, 95% CI) | 0.64 [0.57, 0.72] |
| 4 Haematotoxicity | 8 | 1013 | Risk Ratio (M‐H, Fixed, 95% CI) | 0.67 [0.60, 0.73] |
| 4.1 Rate of neutropenia in the control group >70% | 5 | 771 | Risk Ratio (M‐H, Fixed, 95% CI) | 0.68 [0.62, 0.75] |
| 4.2 Rate of neutropenia in the control group 50%‐70% | 2 | 205 | Risk Ratio (M‐H, Fixed, 95% CI) | 0.51 [0.37, 0.71] |
| 4.3 Rate of neutropenia in the control gorup < 50% | 1 | 37 | Risk Ratio (M‐H, Fixed, 95% CI) | 1.48 [0.57, 3.82] |
| 5 Use of antibiotic prophylaxis | 8 | 1013 | Risk Ratio (M‐H, Fixed, 95% CI) | 0.67 [0.60, 0.73] |
| 5.1 No antibiotic prophylaxis given | 6 | 784 | Risk Ratio (M‐H, Fixed, 95% CI) | 0.72 [0.65, 0.79] |
| 5.2 Antibiotic prophylaxis given | 2 | 229 | Risk Ratio (M‐H, Fixed, 95% CI) | 0.43 [0.31, 0.60] |
| 6 Blinded versus openlabel studies | 8 | 1013 | Risk Ratio (M‐H, Fixed, 95% CI) | 0.67 [0.60, 0.73] |
| 6.1 Placebo controlled studies | 2 | 218 | Risk Ratio (M‐H, Fixed, 95% CI) | 0.70 [0.57, 0.87] |
| 6.2 Open label studies | 6 | 795 | Risk Ratio (M‐H, Fixed, 95% CI) | 0.66 [0.59, 0.73] |
| 7 Concealed versus unclear method of allocation | 8 | 1013 | Risk Ratio (M‐H, Fixed, 95% CI) | 0.67 [0.60, 0.73] |
| 7.1 Allocation concealed | 7 | 933 | Risk Ratio (M‐H, Fixed, 95% CI) | 0.68 [0.62, 0.75] |
| 7.2 Method of allocation unclear | 1 | 80 | Risk Ratio (M‐H, Fixed, 95% CI) | 0.44 [0.27, 0.72] |
| 8 Published and reported data versus unpublished or unreported data | 8 | 1013 | Risk Ratio (M‐H, Fixed, 95% CI) | 0.67 [0.60, 0.73] |
| 8.1 Unreported and unpublished data | 3 | 167 | Risk Ratio (M‐H, Fixed, 95% CI) | 0.87 [0.67, 1.13] |
| 8.2 Published and reported data | 5 | 846 | Risk Ratio (M‐H, Fixed, 95% CI) | 0.63 [0.57, 0.70] |
| 9 Size of study | 8 | 1013 | Risk Ratio (M‐H, Fixed, 95% CI) | 0.67 [0.60, 0.73] |
| 9.1 Study size <100 patients | 4 | 247 | Risk Ratio (M‐H, Fixed, 95% CI) | 0.72 [0.57, 0.90] |
| 9.2 Study size > 100 patients | 4 | 766 | Risk Ratio (M‐H, Fixed, 95% CI) | 0.65 [0.59, 0.73] |
| 10 Worst case‐best case | 8 | Risk Ratio (M‐H, Fixed, 95% CI) | Subtotals only | |
| 10.1 Worst case | 8 | 1035 | Risk Ratio (M‐H, Fixed, 95% CI) | 0.69 [0.62, 0.76] |
| 10.2 Best case | 8 | 1035 | Risk Ratio (M‐H, Fixed, 95% CI) | 0.65 [0.59, 0.71] |
3.1. Analysis.
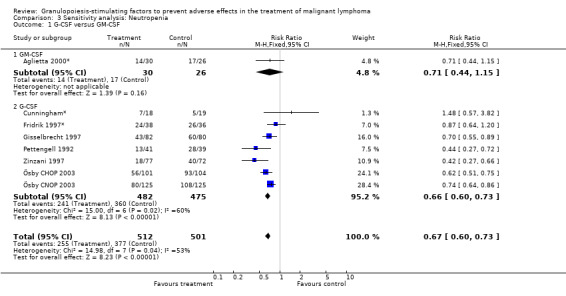
Comparison 3 Sensitivity analysis: Neutropenia, Outcome 1 G‐CSF versus GM‐CSF.
3.2. Analysis.

Comparison 3 Sensitivity analysis: Neutropenia, Outcome 2 HD versus NHL.
3.3. Analysis.
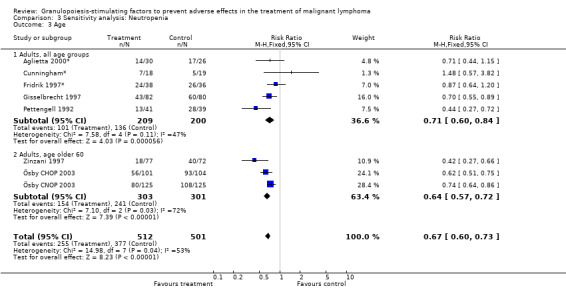
Comparison 3 Sensitivity analysis: Neutropenia, Outcome 3 Age.
3.4. Analysis.
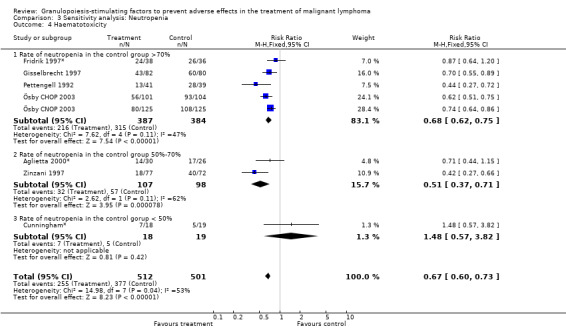
Comparison 3 Sensitivity analysis: Neutropenia, Outcome 4 Haematotoxicity.
3.5. Analysis.
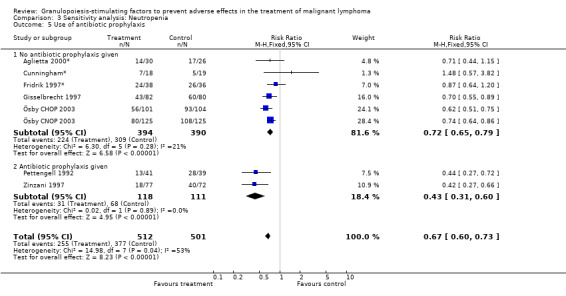
Comparison 3 Sensitivity analysis: Neutropenia, Outcome 5 Use of antibiotic prophylaxis.
3.6. Analysis.
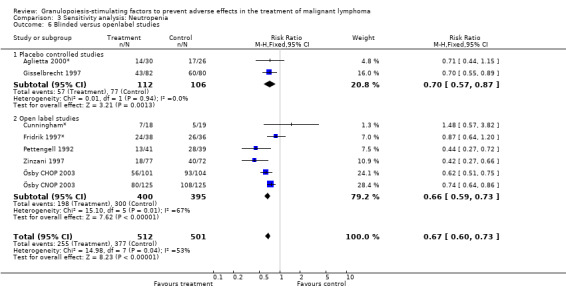
Comparison 3 Sensitivity analysis: Neutropenia, Outcome 6 Blinded versus openlabel studies.
3.7. Analysis.
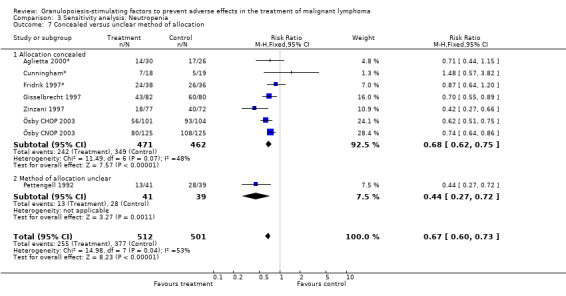
Comparison 3 Sensitivity analysis: Neutropenia, Outcome 7 Concealed versus unclear method of allocation.
3.8. Analysis.
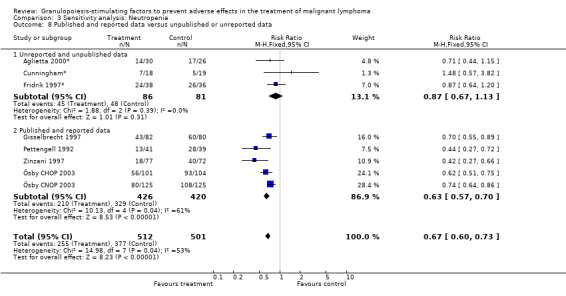
Comparison 3 Sensitivity analysis: Neutropenia, Outcome 8 Published and reported data versus unpublished or unreported data.
3.9. Analysis.
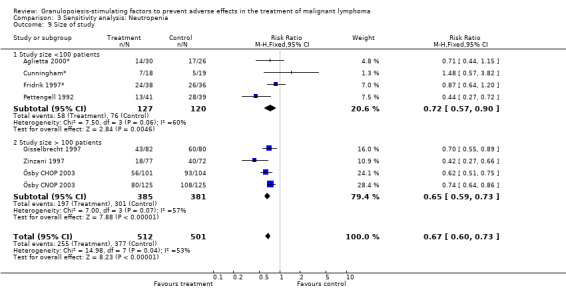
Comparison 3 Sensitivity analysis: Neutropenia, Outcome 9 Size of study.
3.10. Analysis.
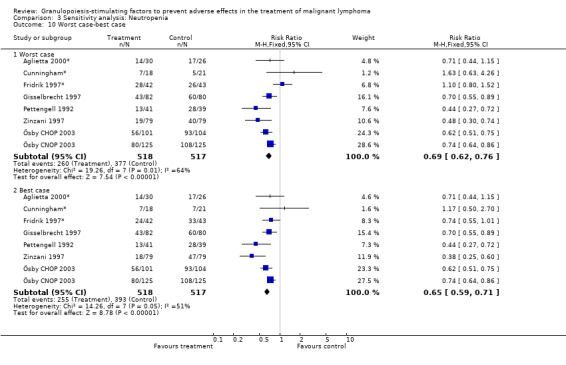
Comparison 3 Sensitivity analysis: Neutropenia, Outcome 10 Worst case‐best case.
Comparison 4. Sensitivity analysis: Febrile Neutropenia.
| Outcome or subgroup title | No. of studies | No. of participants | Statistical method | Effect size |
|---|---|---|---|---|
| 1 HD versus NHL | 5 | 360 | Risk Ratio (M‐H, Fixed, 95% CI) | 0.74 [0.62, 0.89] |
| 1.1 Hodgkin's disease | 2 | 44 | Risk Ratio (M‐H, Fixed, 95% CI) | 0.71 [0.33, 1.52] |
| 1.2 Non‐Hodgkin's lymphoma | 3 | 316 | Risk Ratio (M‐H, Fixed, 95% CI) | 0.74 [0.62, 0.90] |
| 2 Use of antibiotic prophylaxis | 5 | 360 | Risk Ratio (M‐H, Fixed, 95% CI) | 0.74 [0.62, 0.89] |
| 2.1 No antibiotic prophylaxis given | 4 | 280 | Risk Ratio (M‐H, Fixed, 95% CI) | 0.79 [0.65, 0.95] |
| 2.2 Antibiotic prophylaxis given | 1 | 80 | Risk Ratio (M‐H, Fixed, 95% CI) | 0.50 [0.26, 0.99] |
| 3 Blinded versus open label studies | 5 | 360 | Risk Ratio (M‐H, Fixed, 95% CI) | 0.74 [0.62, 0.89] |
| 3.1 placebo controlled studies | 1 | 80 | Risk Ratio (M‐H, Fixed, 95% CI) | 0.50 [0.26, 0.99] |
| 3.2 open label studies | 4 | 280 | Risk Ratio (M‐H, Fixed, 95% CI) | 0.79 [0.65, 0.95] |
| 4 Concealed versus unclear method of allocation | 5 | 360 | Risk Ratio (M‐H, Fixed, 95% CI) | 0.74 [0.62, 0.89] |
| 4.1 allocation concealed | 4 | 280 | Risk Ratio (M‐H, Fixed, 95% CI) | 0.79 [0.65, 0.95] |
| 4.2 method of allocation unclear | 1 | 80 | Risk Ratio (M‐H, Fixed, 95% CI) | 0.50 [0.26, 0.99] |
| 5 Size of study | 5 | Risk Ratio (IV, Fixed, 95% CI) | Subtotals only | |
| 5.1 Study size <100 patients | 4 | 198 | Risk Ratio (IV, Fixed, 95% CI) | 0.68 [0.49, 0.96] |
| 5.2 Study size >100 patients | 1 | 162 | Risk Ratio (IV, Fixed, 95% CI) | 0.82 [0.67, 1.00] |
| 6 Worst case‐best case | 5 | Risk Ratio (M‐H, Fixed, 95% CI) | Subtotals only | |
| 6.1 Worst case | 5 | 380 | Risk Ratio (M‐H, Fixed, 95% CI) | 0.83 [0.69, 0.99] |
| 6.2 Best case | 5 | 380 | Risk Ratio (M‐H, Fixed, 95% CI) | 0.68 [0.57, 0.82] |
4.1. Analysis.
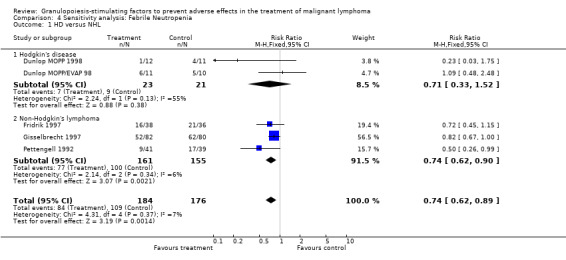
Comparison 4 Sensitivity analysis: Febrile Neutropenia, Outcome 1 HD versus NHL.
4.2. Analysis.
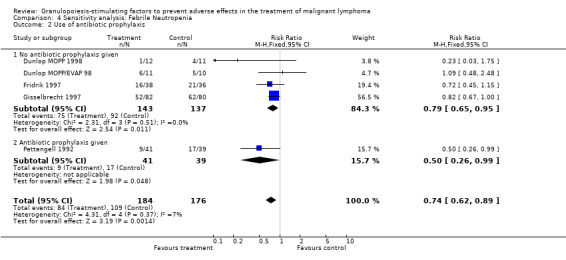
Comparison 4 Sensitivity analysis: Febrile Neutropenia, Outcome 2 Use of antibiotic prophylaxis.
4.3. Analysis.
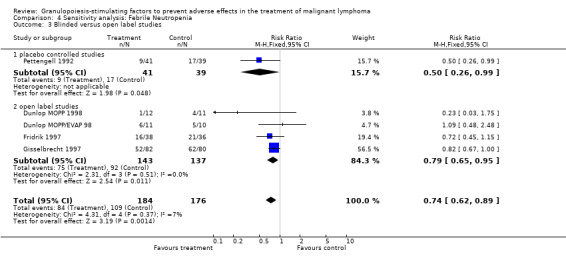
Comparison 4 Sensitivity analysis: Febrile Neutropenia, Outcome 3 Blinded versus open label studies.
4.4. Analysis.
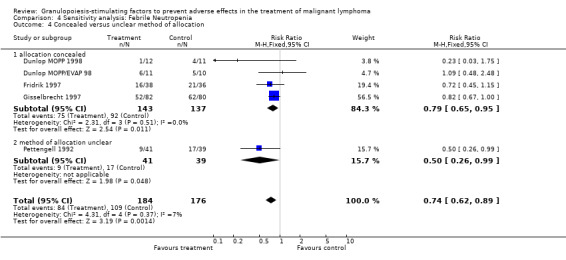
Comparison 4 Sensitivity analysis: Febrile Neutropenia, Outcome 4 Concealed versus unclear method of allocation.
4.5. Analysis.
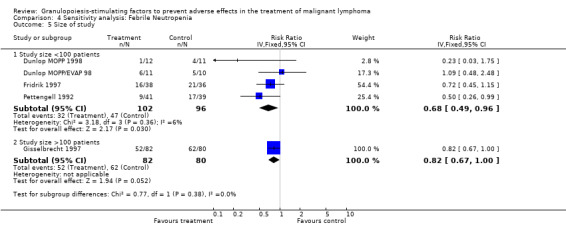
Comparison 4 Sensitivity analysis: Febrile Neutropenia, Outcome 5 Size of study.
4.6. Analysis.
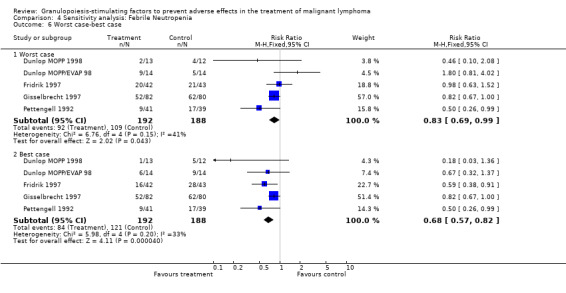
Comparison 4 Sensitivity analysis: Febrile Neutropenia, Outcome 6 Worst case‐best case.
Comparison 5. Sensitivity analysis: Infection.
| Outcome or subgroup title | No. of studies | No. of participants | Statistical method | Effect size |
|---|---|---|---|---|
| 1 G‐CSF versus GM‐CSF | 11 | 1292 | Risk Ratio (M‐H, Fixed, 95% CI) | 0.74 [0.64, 0.85] |
| 1.1 GM‐CSF | 2 | 228 | Risk Ratio (M‐H, Fixed, 95% CI) | 0.75 [0.52, 1.09] |
| 1.2 G‐CSF | 9 | 1064 | Risk Ratio (M‐H, Fixed, 95% CI) | 0.73 [0.63, 0.85] |
| 2 HD versus NHL | 11 | 1292 | Risk Ratio (M‐H, Fixed, 95% CI) | 0.74 [0.64, 0.85] |
| 2.1 Hodgkin's disease | 3 | 103 | Risk Ratio (M‐H, Fixed, 95% CI) | 0.91 [0.61, 1.37] |
| 2.2 Non‐Hodgkin's lymphoma | 8 | 1189 | Risk Ratio (M‐H, Fixed, 95% CI) | 0.72 [0.62, 0.84] |
| 3 Age | 11 | 1292 | Risk Ratio (M‐H, Fixed, 95% CI) | 0.74 [0.64, 0.85] |
| 3.1 Adults, all ages | 9 | 710 | Risk Ratio (M‐H, Fixed, 95% CI) | 0.82 [0.69, 0.98] |
| 3.2 Adults, age older 60 | 2 | 582 | Risk Ratio (M‐H, Fixed, 95% CI) | 0.63 [0.50, 0.79] |
| 4 Use of antibiotic prophylaxis | 11 | 1292 | Risk Ratio (M‐H, Fixed, 95% CI) | 0.74 [0.64, 0.85] |
| 4.1 No antibiotic prophylaxis given | 9 | 1063 | Risk Ratio (M‐H, Fixed, 95% CI) | 0.75 [0.65, 0.87] |
| 4.2 Antbiobiotic prophylaxis given | 2 | 229 | Risk Ratio (M‐H, Fixed, 95% CI) | 0.52 [0.26, 1.04] |
| 5 Blinded versus open label studies | 11 | 1292 | Risk Ratio (M‐H, Fixed, 95% CI) | 0.74 [0.64, 0.85] |
| 5.1 Placebo controlled studies | 5 | 509 | Risk Ratio (M‐H, Fixed, 95% CI) | 0.80 [0.65, 0.99] |
| 5.2 Open label studies | 6 | 783 | Risk Ratio (M‐H, Fixed, 95% CI) | 0.69 [0.57, 0.83] |
| 6 Concealed versus unclear method of allocation | 11 | 1292 | Risk Ratio (M‐H, Fixed, 95% CI) | 0.74 [0.64, 0.85] |
| 6.1 Allocation concealed | 8 | 1093 | Risk Ratio (M‐H, Fixed, 95% CI) | 0.68 [0.58, 0.80] |
| 6.2 Method of allocation unclear | 3 | 199 | Risk Ratio (M‐H, Fixed, 95% CI) | 1.00 [0.76, 1.32] |
| 7 Published and reported data versus unpublished, unreported or abstract publications only | 11 | 1292 | Risk Ratio (M‐H, Fixed, 95% CI) | 0.74 [0.64, 0.85] |
| 7.1 Unreported, unpublished or abstract publicated data | 4 | 608 | Risk Ratio (M‐H, Fixed, 95% CI) | 0.76 [0.64, 0.91] |
| 7.2 Peer‐reviewed data | 7 | 684 | Risk Ratio (M‐H, Fixed, 95% CI) | 0.70 [0.56, 0.88] |
| 8 Size of study | 11 | 1292 | Risk Ratio (M‐H, Fixed, 95% CI) | 0.74 [0.64, 0.85] |
| 8.1 Study size <100 patients | 5 | 257 | Risk Ratio (M‐H, Fixed, 95% CI) | 0.87 [0.64, 1.19] |
| 8.2 Study size >100 patients | 6 | 1035 | Risk Ratio (M‐H, Fixed, 95% CI) | 0.71 [0.60, 0.83] |
| 9 Worst case‐best case | 11 | Risk Ratio (M‐H, Fixed, 95% CI) | Subtotals only | |
| 9.1 Worst case | 11 | 1350 | Risk Ratio (M‐H, Fixed, 95% CI) | 0.83 [0.73, 0.96] |
| 9.2 Best case | 11 | 1350 | Risk Ratio (M‐H, Fixed, 95% CI) | 0.66 [0.58, 0.76] |
5.1. Analysis.
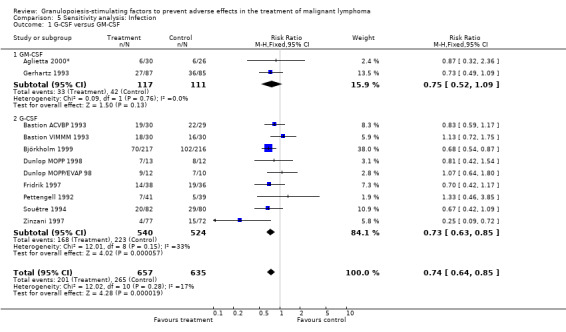
Comparison 5 Sensitivity analysis: Infection, Outcome 1 G‐CSF versus GM‐CSF.
5.2. Analysis.
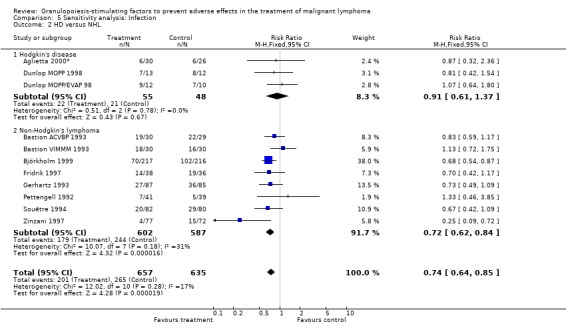
Comparison 5 Sensitivity analysis: Infection, Outcome 2 HD versus NHL.
5.3. Analysis.
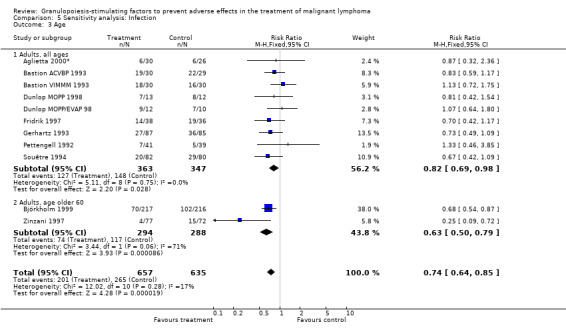
Comparison 5 Sensitivity analysis: Infection, Outcome 3 Age.
5.4. Analysis.
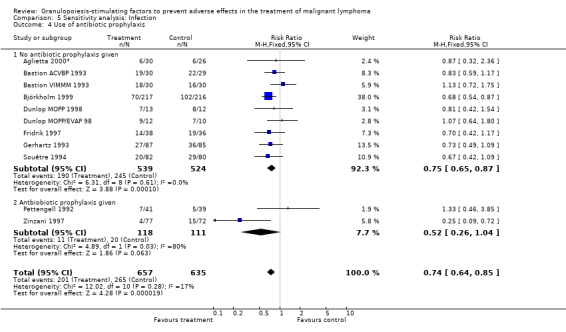
Comparison 5 Sensitivity analysis: Infection, Outcome 4 Use of antibiotic prophylaxis.
5.5. Analysis.
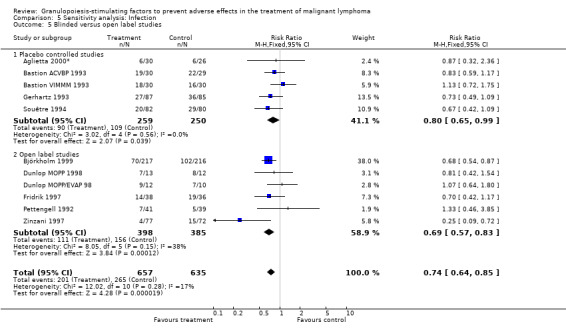
Comparison 5 Sensitivity analysis: Infection, Outcome 5 Blinded versus open label studies.
5.6. Analysis.
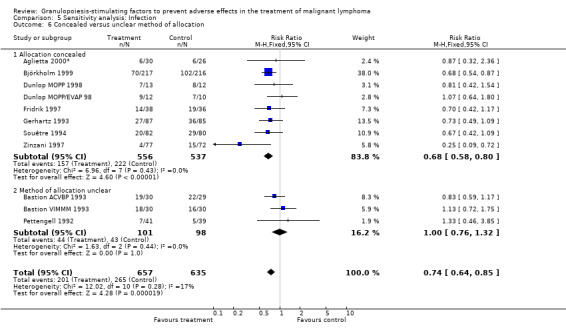
Comparison 5 Sensitivity analysis: Infection, Outcome 6 Concealed versus unclear method of allocation.
5.7. Analysis.
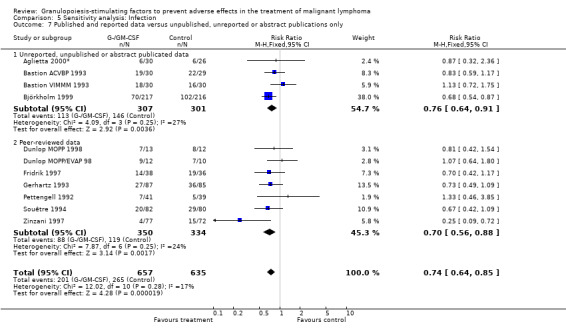
Comparison 5 Sensitivity analysis: Infection, Outcome 7 Published and reported data versus unpublished, unreported or abstract publications only.
5.8. Analysis.
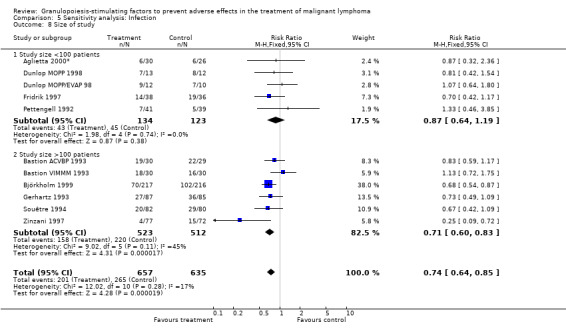
Comparison 5 Sensitivity analysis: Infection, Outcome 8 Size of study.
5.9. Analysis.
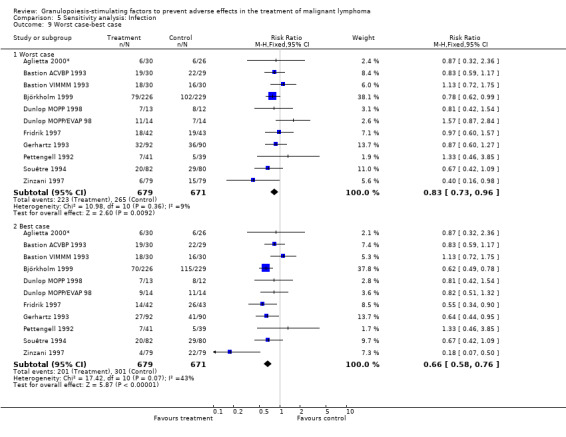
Comparison 5 Sensitivity analysis: Infection, Outcome 9 Worst case‐best case.
Comparison 6. Sensitivity analysis: Complete response.
| Outcome or subgroup title | No. of studies | No. of participants | Statistical method | Effect size |
|---|---|---|---|---|
| 1 GM‐CSF versus G‐CSF | 13 | 2368 | Risk Ratio (M‐H, Fixed, 95% CI) | 1.03 [0.95, 1.10] |
| 1.1 GM‐CSF | 2 | 228 | Risk Ratio (M‐H, Fixed, 95% CI) | 1.07 [0.88, 1.31] |
| 1.2 G‐CSF | 11 | 2140 | Risk Ratio (M‐H, Fixed, 95% CI) | 1.02 [0.94, 1.10] |
| 2 HD versus NHL | 13 | 2368 | Risk Ratio (M‐H, Fixed, 95% CI) | 1.03 [0.95, 1.10] |
| 2.1 Hodgkin's disease | 3 | 106 | Risk Ratio (M‐H, Fixed, 95% CI) | 1.23 [0.89, 1.72] |
| 2.2 Non‐Hodgkin's lymphoma | 10 | 2262 | Risk Ratio (M‐H, Fixed, 95% CI) | 1.02 [0.94, 1.09] |
| 3 Age | 13 | 2368 | Risk Ratio (M‐H, Fixed, 95% CI) | 1.03 [0.95, 1.10] |
| 3.1 Adults, all ages | 8 | 591 | Risk Ratio (M‐H, Fixed, 95% CI) | 1.11 [0.98, 1.25] |
| 3.2 Adults, age older 60 | 5 | 1777 | Risk Ratio (M‐H, Fixed, 95% CI) | 0.99 [0.91, 1.09] |
| 4 Use of antibiotic prophylaxis | 13 | 2368 | Risk Ratio (M‐H, Fixed, 95% CI) | 1.03 [0.95, 1.10] |
| 4.1 No antibiotic prophylaxis given | 11 | 1435 | Risk Ratio (M‐H, Fixed, 95% CI) | 1.02 [0.93, 1.11] |
| 4.2 Antibiotic prophylaxis given | 2 | 933 | Risk Ratio (M‐H, Fixed, 95% CI) | 1.03 [0.91, 1.17] |
| 5 Blinded versus open label studies | 13 | 2368 | Risk Ratio (M‐H, Fixed, 95% CI) | 1.03 [0.95, 1.10] |
| 5.1 Placebo controlled studies | 4 | 431 | Risk Ratio (M‐H, Fixed, 95% CI) | 1.05 [0.92, 1.20] |
| 5.2 Open label studies | 9 | 1937 | Risk Ratio (M‐H, Fixed, 95% CI) | 1.02 [0.94, 1.11] |
| 6 Published and reported data versus unpublished or unreported data | 13 | 2368 | Risk Ratio (M‐H, Fixed, 95% CI) | 1.03 [0.95, 1.10] |
| 6.1 Data not published in a peer‐review journal | 3 | 89 | Risk Ratio (M‐H, Fixed, 95% CI) | 1.58 [0.88, 2.86] |
| 6.2 Peer‐reviewed data | 10 | 2279 | Risk Ratio (M‐H, Fixed, 95% CI) | 1.02 [0.94, 1.09] |
| 7 Size of studies | 13 | 2368 | Risk Ratio (M‐H, Fixed, 95% CI) | 1.03 [0.95, 1.10] |
| 7.1 Study size n<100 | 6 | 258 | Risk Ratio (M‐H, Fixed, 95% CI) | 1.31 [1.08, 1.60] |
| 7.2 Study size n>100 | 7 | 2110 | Risk Ratio (M‐H, Fixed, 95% CI) | 0.99 [0.92, 1.07] |
| 8 Worst case ‐ best case | 15 | Risk Ratio (M‐H, Fixed, 95% CI) | Subtotals only | |
| 8.1 Best case | 13 | 2405 | Risk Ratio (M‐H, Fixed, 95% CI) | 1.05 [0.98, 1.13] |
| 8.2 Worst case | 13 | 2405 | Risk Ratio (M‐H, Fixed, 95% CI) | 1.00 [0.93, 1.07] |
6.1. Analysis.
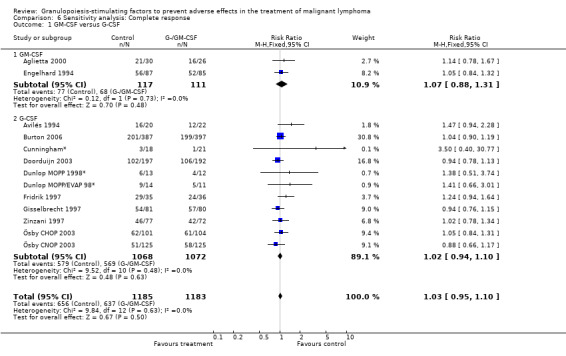
Comparison 6 Sensitivity analysis: Complete response, Outcome 1 GM‐CSF versus G‐CSF.
6.2. Analysis.
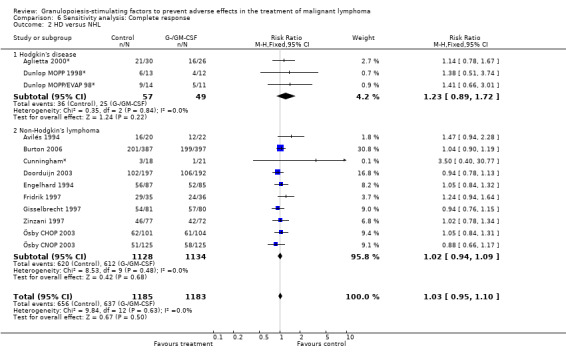
Comparison 6 Sensitivity analysis: Complete response, Outcome 2 HD versus NHL.
6.3. Analysis.
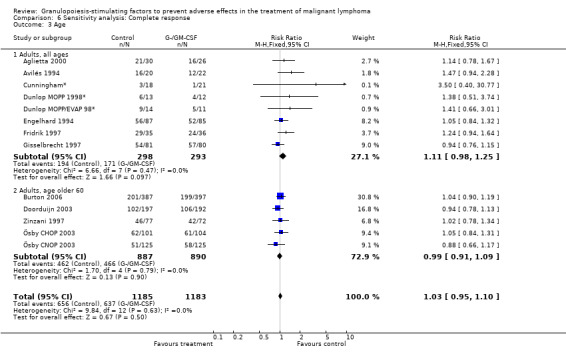
Comparison 6 Sensitivity analysis: Complete response, Outcome 3 Age.
6.4. Analysis.
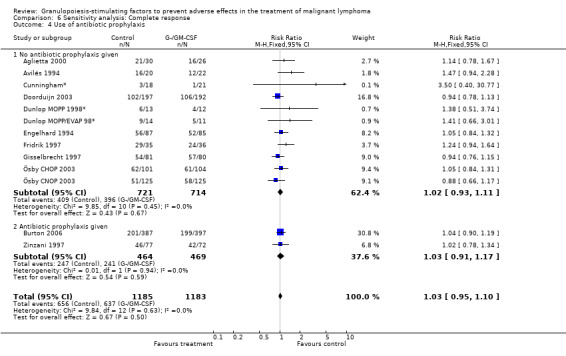
Comparison 6 Sensitivity analysis: Complete response, Outcome 4 Use of antibiotic prophylaxis.
6.5. Analysis.
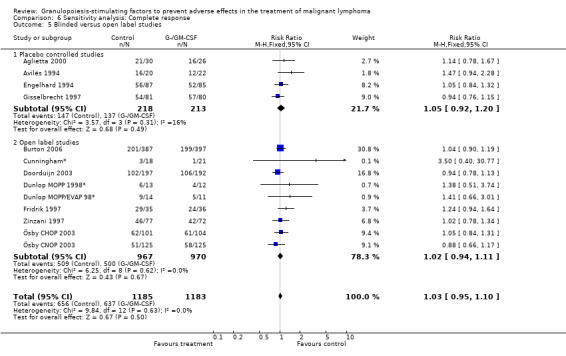
Comparison 6 Sensitivity analysis: Complete response, Outcome 5 Blinded versus open label studies.
6.6. Analysis.
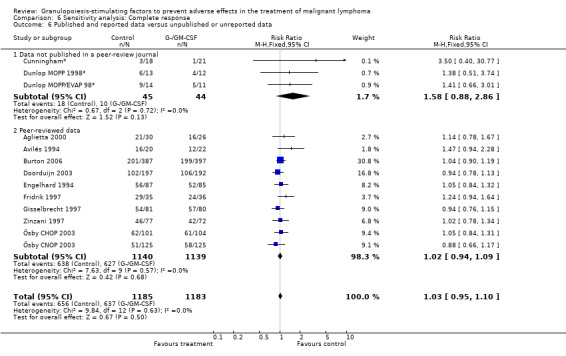
Comparison 6 Sensitivity analysis: Complete response, Outcome 6 Published and reported data versus unpublished or unreported data.
6.7. Analysis.
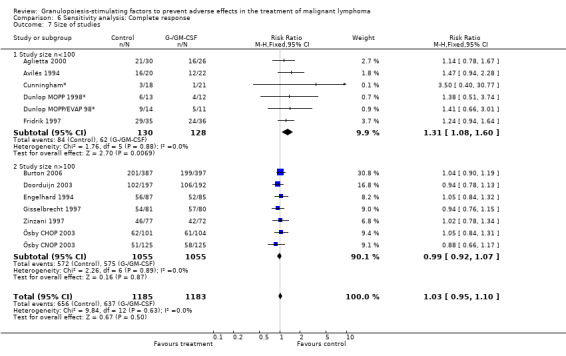
Comparison 6 Sensitivity analysis: Complete response, Outcome 7 Size of studies.
6.8. Analysis.
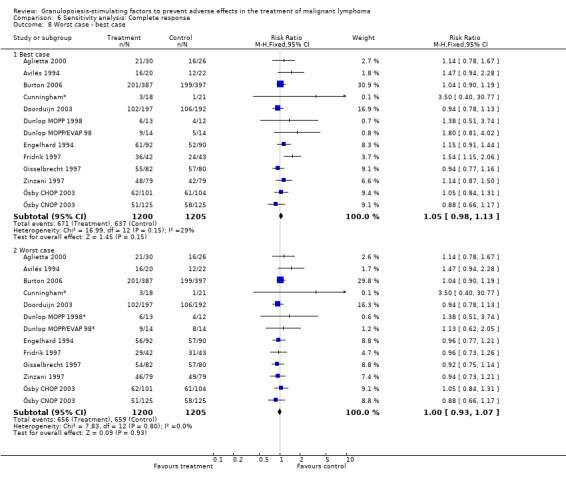
Comparison 6 Sensitivity analysis: Complete response, Outcome 8 Worst case ‐ best case.
Comparison 7. Sensitivity analysis: Bone Pain.
| Outcome or subgroup title | No. of studies | No. of participants | Statistical method | Effect size |
|---|---|---|---|---|
| 1 GM‐CSF versus G‐CSF | 9 | 1204 | Risk Ratio (M‐H, Fixed, 95% CI) | 3.57 [2.09, 6.12] |
| 1.1 GM‐CSF | 2 | 232 | Risk Ratio (M‐H, Fixed, 95% CI) | 1.37 [0.54, 3.47] |
| 1.2 G‐CSF | 7 | 972 | Risk Ratio (M‐H, Fixed, 95% CI) | 5.33 [2.66, 10.68] |
| 2 HD versus NHL | 9 | 1204 | Risk Ratio (M‐H, Fixed, 95% CI) | 3.57 [2.09, 6.12] |
| 2.1 HD | 1 | 56 | Risk Ratio (M‐H, Fixed, 95% CI) | 1.73 [0.17, 18.04] |
| 2.2 NHL | 8 | 1148 | Risk Ratio (M‐H, Fixed, 95% CI) | 3.71 [2.13, 6.45] |
| 3 Age | 9 | 1204 | Risk Ratio (M‐H, Fixed, 95% CI) | 3.57 [2.09, 6.12] |
| 3.1 Adult patients, all ages | 6 | 600 | Risk Ratio (M‐H, Fixed, 95% CI) | 3.17 [1.72, 5.85] |
| 3.2 Adults patients, age older 60 | 3 | 604 | Risk Ratio (M‐H, Fixed, 95% CI) | 5.04 [1.62, 15.65] |
| 4 Blinding | 9 | 1204 | Risk Ratio (M‐H, Fixed, 95% CI) | 3.57 [2.09, 6.12] |
| 4.1 Placebo controlled studies | 4 | 435 | Risk Ratio (M‐H, Fixed, 95% CI) | 2.60 [1.36, 4.98] |
| 4.2 Open label studies | 5 | 769 | Risk Ratio (M‐H, Fixed, 95% CI) | 6.10 [2.27, 16.37] |
| 5 Concealment of allocation | 9 | 1204 | Risk Ratio (M‐H, Fixed, 95% CI) | 3.57 [2.09, 6.12] |
| 5.1 Allocation concealed | 8 | 1124 | Risk Ratio (M‐H, Fixed, 95% CI) | 3.22 [1.86, 5.59] |
| 5.2 Unclear | 1 | 80 | Risk Ratio (M‐H, Fixed, 95% CI) | 14.29 [0.84, 242.02] |
| 6 Study size | 9 | 1204 | Risk Ratio (M‐H, Fixed, 95% CI) | 3.57 [2.09, 6.12] |
| 6.1 Less than 100 participants | 4 | 263 | Risk Ratio (M‐H, Fixed, 95% CI) | 5.60 [1.50, 20.88] |
| 6.2 More than 100 participants | 5 | 941 | Risk Ratio (M‐H, Fixed, 95% CI) | 3.19 [1.77, 5.77] |
7.1. Analysis.
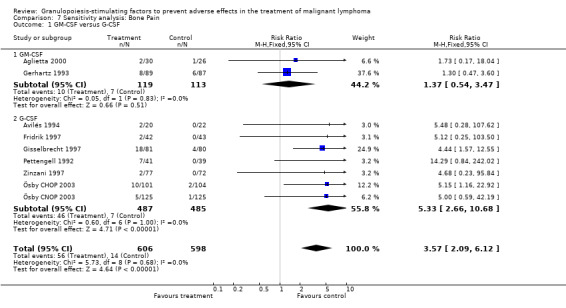
Comparison 7 Sensitivity analysis: Bone Pain, Outcome 1 GM‐CSF versus G‐CSF.
7.2. Analysis.
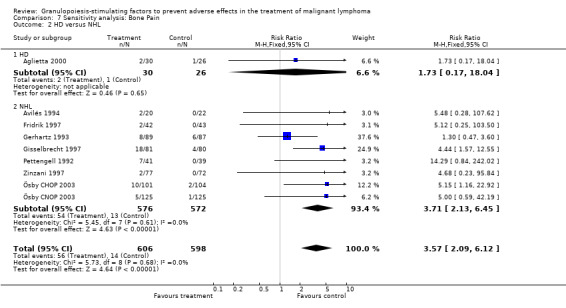
Comparison 7 Sensitivity analysis: Bone Pain, Outcome 2 HD versus NHL.
7.3. Analysis.
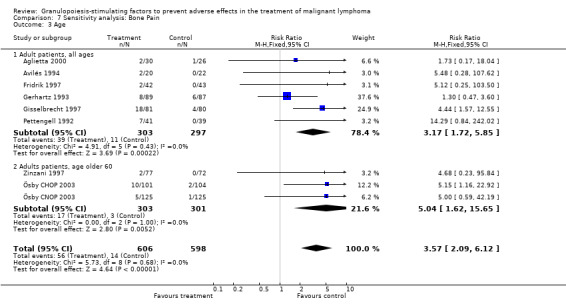
Comparison 7 Sensitivity analysis: Bone Pain, Outcome 3 Age.
7.4. Analysis.
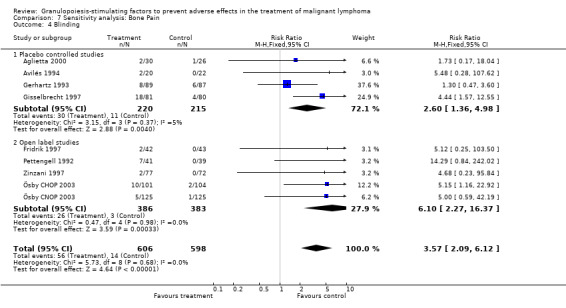
Comparison 7 Sensitivity analysis: Bone Pain, Outcome 4 Blinding.
7.5. Analysis.
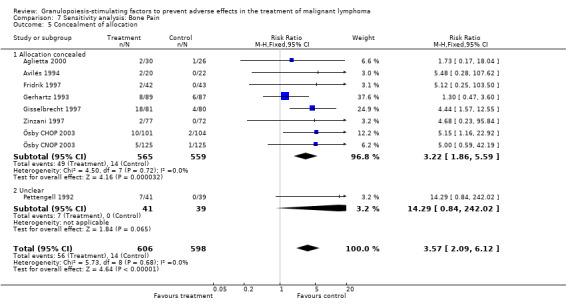
Comparison 7 Sensitivity analysis: Bone Pain, Outcome 5 Concealment of allocation.
7.6. Analysis.
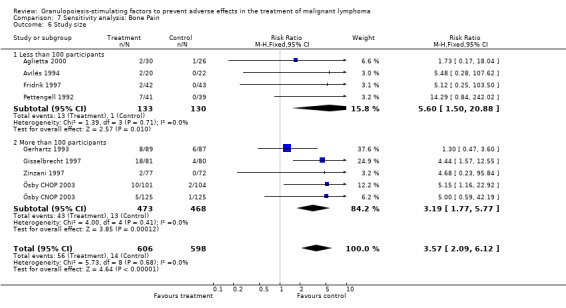
Comparison 7 Sensitivity analysis: Bone Pain, Outcome 6 Study size.
Characteristics of studies
Characteristics of included studies [ordered by study ID]
Aglietta 2000.
| Methods | RCT, 1991‐94, allocation concealed* | |
| Participants | 56 patients randomised, age 18‐77, gender m/f: 33/23, country: Italy Hodgkin's disease, biopsy proven*, untreated, stage II‐IV | |
| Interventions | 1. CT Mechlorethamine 6 mg/m², iv, d1 Vincristine 1.4 mg/m², max 2.0 mg/m², iv, d1 Procarbazine 100 mg/m², po, d1‐7 Prednisone 40 mg/m², po, d1‐7 Doxorubicin 25 mg/m², iv, d15 Bleomycin 10 mg/m², iv, d15 Vinblastine 6 mg/m², iv, d15 Dacarbazine 375 mg/m², iv, d15 this regimen was repeated every 28 days times 6 2. GM‐CSF (5 µg /kg/day s.c. prior to each chemotherapy cycle), used d7‐4 before first cycle, d8‐11 and d22‐25 each subsequent cycle 3. no placebo given 4. no AB prophylaxis given* |
|
| Outcomes | primary endpoints: adherence to the planned delivery rate of planned CT secondary endpoints: nadir neutrophil counts, total duration of neutropenia, total number of days of antibiotic or antifungal treatment, additional outcomes: adverse effects, tumour response | |
| Notes | funding: Italian Association for Cancer Research and Novartis Farma, S.p.A., Italy | |
| Risk of bias | ||
| Bias | Authors' judgement | Support for judgement |
| Allocation concealment? | Low risk | A ‐ Adequate |
Aglietta 2000*.
| Methods | Additional information obtained by personal communication with the study author. | |
| Participants | see Aglietta 2000 | |
| Interventions | see Aglietta 2000 | |
| Outcomes | see Aglietta 2000 | |
| Notes | see Aglietta 2000 | |
| Risk of bias | ||
| Bias | Authors' judgement | Support for judgement |
| Allocation concealment? | Low risk | A ‐ Adequate |
Avilés 1994.
| Methods | RCT, 3/1992‐9/1992*, computer generated numbers, allocation concealed | |
| Participants | 42 patients randomised age: 34‐63*, mean age 51 gender: m/f: 18/24 country: Mexico NHL diffuse large cell lymphoma, intermediate and high grade, untreated; stage: IV* | |
| Interventions | 1. alternating ESAP, m‐BECOD, MVPP‐Bleo by 9 cycles details of CT: Etoposide 40 mg/m², iv, d1‐4 Methylprednisolone 350 mg/m², iv, d1‐5 Ara‐C 2 g/m², iv, d5 Cis‐Platin 25 mg/m², iv, d1‐4 Bleomycin 10 mg/m², iv, d1 Epirubicin 70 mg/m², iv, d1 Cyclophosphamide 600 mg/m², iv, d1 Vincristine 1.4 mg/m², iv, d1 Dexamethasone 20 mg/m², po, d1‐5 Methotrexate 120 mg/m², iv, d14 Mitoxantrone 10 mg/m², iv, d1 Vincristine 1.4 mg/m², iv, d1 Prednisone 50 mg/m², iv, d1‐14 Procarbazine 100 mg/m², po, d1‐14 2. G‐CSF (5 µg/kg/day, sc, d6‐15) 3. placebo given* 4. no AB prophylaxis | |
| Outcomes | duration of leucopenia and granulocytopenia, frequency and severity of infections, hospitalisation, deaths, tumour response, dose intensity, treatment delay, antibiotic use | |
| Notes | funding: Roche Mexcio* | |
| Risk of bias | ||
| Bias | Authors' judgement | Support for judgement |
| Allocation concealment? | Low risk | A ‐ Adequate |
Avilés 1994*.
| Methods | additional information obtained by personal communication with the study author | |
| Participants | see Avilés 1994 | |
| Interventions | see Avilés 1994 | |
| Outcomes | see Avilés 1994 | |
| Notes | see Avilés 1994 | |
| Risk of bias | ||
| Bias | Authors' judgement | Support for judgement |
| Allocation concealment? | Low risk | A ‐ Adequate |
Bastion 1993.
| Methods | RCT, 1990‐1992, allocation unclear | |
| Participants | 119 patients no details available | |
| Interventions | 1. CT A: 3‐4 courses ACVBP, 21 days B: 2 ACVBP alternat. 2x VIMMM, 21 days ACVBP: Adriamycin 75 mg/m², d1 Cyclophsophamide 1200 mg/m², d1 Vindesine 2 mg/m², d1 and 5 Bleomycin 10 mg, d1 and 5 Prednisolone 60 mg/m², d1‐5 Methotrexate 12 mg intrathecal 1‐2 /week VIMMM: VP 16 100 mg/m², d1 and 5 Ifosfamide 1000 mg/m², d1‐5 Mitoxantrone 10 mg/m², d1 Methyl GAG 300 mg/m², d1 and 5 Methotrexate 1500 mg/m², d15 Methylprednison 60 mg/m², d1‐5 2. G‐CSF: 5 µg/kg/day, sc, d6‐max d19) 3. placebo given 4. no AB prophylaxis | |
| Outcomes | risk of febrile neutropenia and documented infection, duration of neutropenia, mortality during induction, dose‐intensity | |
| Notes | funding: Amgen | |
| Risk of bias | ||
| Bias | Authors' judgement | Support for judgement |
| Allocation concealment? | Unclear risk | B ‐ Unclear |
Bastion ACVBP 1993.
| Methods | see Bastion 1993, arm A | |
| Participants | see Bastion 1993, arm A | |
| Interventions | see Bastion 1993, arm A | |
| Outcomes | see Bastion 1993, arm A | |
| Notes | see Bastion 1993, arm A | |
| Risk of bias | ||
| Bias | Authors' judgement | Support for judgement |
| Allocation concealment? | Unclear risk | B ‐ Unclear |
Bastion VIMMM 1993.
| Methods | see Bastion 1993, arm B | |
| Participants | see Bastion 1993, arm B | |
| Interventions | see Bastion 1993, arm B | |
| Outcomes | see Bastion 1993, arm B | |
| Notes | see Bastion 1993, arm B | |
| Risk of bias | ||
| Bias | Authors' judgement | Support for judgement |
| Allocation concealment? | Unclear risk | B ‐ Unclear |
Björkholm 1999.
| Methods | This is the abstract publication to Ösby 2003. Apart from G‐CSF randomisation this study included 2 different treatment arms. See Björkholm CHOP 1999 and Björkholm CNOP 1999. | |
| Participants | ||
| Interventions | ||
| Outcomes | ||
| Notes | ||
| Risk of bias | ||
| Bias | Authors' judgement | Support for judgement |
| Allocation concealment? | Low risk | A ‐ Adequate |
Björkholm CHOP 1999.
| Methods | RCT, 1992‐97, concealed allocation | |
| Participants | 205 patients randomised, age >60 stage II‐IV high‐grade NHL, untreated | |
| Interventions | CHOP with G‐CSF versus CHOP without G‐CSF 1. CT: Cyclophosphamide 750 mg/m², iv, d1 Vincristine 1.4 mg/m², iv, d1 Doxorubicin 50 mg/m², iv, d1 Prednisone 100 mg/m², po, d1‐5 2. G‐CSF (5 µg/kg/day, sc, d2‐d10/14) 3. no placebo given* 4. no AB prophylaxis given* | |
| Outcomes | toxicity (severe neutropenia, infections), tumour response, survival | |
| Notes | funding: Roche, Amgen, Wyeth Lederle and the Swedish Cancer Society | |
| Risk of bias | ||
| Bias | Authors' judgement | Support for judgement |
| Allocation concealment? | Low risk | A ‐ Adequate |
Björkholm CNOP 1999.
| Methods | RCT, 1992‐97, concealed allocation | |
| Participants | 250 patients randomised, age >60 stage II‐IV high‐grade NHL, untreated | |
| Interventions | CNOP with G‐CSF versus CNOP without G‐CSF 1. CT: Cyclophosphamide 750 mg/m², iv, d1 Mitoxantrone 10 mg/m², iv, d1 Vincristine 1.4 mg/m², iv, d1 Prednisone 100 mg/m², po, d1‐5 2. G‐CSF (5 µg/kg/day, sc, d2‐d10/14) 3. no placebo given* 4. no AB prophylaxis given* | |
| Outcomes | toxicity (severe neutropenia, infections), tumour response, survival | |
| Notes | funding: Roche, Amgen, Wyeth Lederle and the Swedish Cancer Society | |
| Risk of bias | ||
| Bias | Authors' judgement | Support for judgement |
| Allocation concealment? | Low risk | A ‐ Adequate |
Burton 2006.
| Methods | Apart from the G‐CSF randomisation, the trial also randomised to CHOp or PMitCEBO see Burton CHOP and Burton PMitCEBO. Overall survival reported only for the full group. RCT, 1997‐2003, allocation concealment unclear |
|
| Participants | 784 patients randomised, previously untreated, age >= 60 years Stage Ia bulky or Ib to IV aggressive NHL (diffuse mixed cell, diffuse large cell, diffuse immunoblastic and after 2000 diffuse large B‐cell lymphoma) |
|
| Interventions | CHOP or PMitCEBO | |
| Outcomes | Overall survival, on treatment mortality, infection related mortality, overall response rate, toxicity (but not for G‐CSF vs. control except for the incidence of neutropenia) | |
| Notes | public funding acknowledged | |
| Risk of bias | ||
| Bias | Authors' judgement | Support for judgement |
| Allocation concealment? | Unclear risk | No information provided |
Burton CHOP 2006.
| Methods | RCT, 1997‐2003, allocation concealment not reported | |
| Participants | 784 patients randomised, previously untreated, age >= 60 years 397 randomised to PMitCEBO Stage Ia bulky or Ib to IV aggressive NHL (diffuse mixed cell, diffuse large cell, diffuse immunoblastic and after 2000 diffuse large B‐cell lymphoma) |
|
| Interventions | 1. CT: Cyclophosphamide 300mg/m2 d1 Mitoxantrone 7mg/m2 d1 Etopside 150mg/m2 d1 Prednisolone 50mg daily week 1‐4, 50mg alternating days weeks 5 to treatment end Vincristine 1.4 mg/m2 d8 Bleomycin 10mg/m2 d8 2. G‐CSF: 263µg/day lenograstim d 6‐12 3. no placebo given 4. cotrimoxazole given week one to treatment end plus two weeks |
|
| Outcomes | On treatment mortality, infection related mortality, overall response rate, toxicity (but not for G‐CSF vs. control except for the incidence of neutropenia) | |
| Notes | Subgroup of Burton 2006, with patients randomised to treatment with PMitCEBO | |
Burton PMitCEBO 2006.
| Methods | RCT, 1997‐2003, allocation concealment not reported | |
| Participants | 784 patients randomised, previously untreated, age >= 60 years 397 randomised to PMitCEBO Stage Ia bulky or Ib to IV aggressive NHL (diffuse mixed cell, diffuse large cell, diffuse immunoblastic and after 2000 diffuse large B‐cell lymphoma) |
|
| Interventions | 1. CT: Cyclophosphamide 750mg/m2 d1 Doxorubicin 50mg/m2 d1 Vincristine 1.4 mg/m2 d8 Prednisolone 100mg d1‐5 2. G‐CSF: 263µg/day lenograstim d 8‐14 3. no placebo given 4. cotrimoxazole given week one to treatment end plus two weeks |
|
| Outcomes | On treatment mortality, infection related mortality, overall response rate, toxicity (but not for G‐CSF vs. control except for the incidence of neutropenia) | |
| Notes | Subgroup of Burton 2006 with patients randomised to CHOP | |
Cunningham*.
| Methods | RCT, 1993‐1995*, concealed allocation* | |
| Participants | 39 patients randomised, age 23‐68, gender m/f: 22/17 country: UK relapsed NHL (N = 38) relapsed HD (N = 1) stage I‐IV, biopsy proven | |
| Interventions | ECP +/‐ G‐CSF 1. CT Etoposide 50 mg/m², po, d1‐10 Cisplatin 60 mg/m², iv, d1 Prednisolone 100 mg, po, d1‐5 2. G‐CSF 5 µg/kg/day, sc, d11‐17 3. no placebo given* 4. AB prophylaxis given | |
| Outcomes | toxicity, response rate, duration of response, survival | |
| Notes | funding: ?? This study was never published. All data presented in this review were kindly provided by Dr. Cunningham. | |
| Risk of bias | ||
| Bias | Authors' judgement | Support for judgement |
| Allocation concealment? | Low risk | A ‐ Adequate |
Doorduijn 2003.
| Methods | RCT, 1994‐2000, concealed allocation* | |
| Participants | 389 patients randomised, age 65‐90, median 72, gender m/f: 216/173 country: Netherlands, Belgium stage II‐IV high‐grade NHL, untreated | |
| Interventions | CHOP with G‐CSF versus CHOP without G‐CSF 1. CT: Cyclophosphamide 750 mg/m², iv, d1 Doxorubicin 50 mg/m², iv, d1 Vincristine 1.4 mg/m², iv, d1 Prednisone 50 mg/m², po, d1‐5 2. G‐CSF 300 µg/day sc, d2‐d11 3. no placebo given 4. no AB prophylaxis given | |
| Outcomes | received dose intensity, severe neutropenia and infections, tumour response, survival, QoL, costs | |
| Notes | supported by the Dutch National Health Council | |
| Risk of bias | ||
| Bias | Authors' judgement | Support for judgement |
| Allocation concealment? | Low risk | A ‐ Adequate |
Dunlop 1998.
| Methods | Apart from G‐CSF randomisation this study included 2 different treatment arms. See Dunlop MOPP 1998 and Dunlop MOPP/EVAP 98. | |
| Participants | ||
| Interventions | ||
| Outcomes | ||
| Notes | ||
| Risk of bias | ||
| Bias | Authors' judgement | Support for judgement |
| Allocation concealment? | Low risk | A ‐ Adequate |
Dunlop MOPP 1998.
| Methods | RCT, 1/1991‐6/1993*, allocation by phoning central AMGEN Data Centre | |
| Participants | 25 patients randomised and evaluated, age 19‐41, gender m/f: 15/10, country: UK Hodgkin's disease, biopsy proven*, untreated, stage IB‐IV | |
| Interventions | 1. CT Mustine 6 mg/m², iv, d1and 8 Vincristine 1.4 mg/m², iv, d1 and 8 Procarbazine 100 mg/m², po, d1‐14 Prednisolone 25 mg/m², po, d1‐14 2. G‐CSF (rmetHuG‐CSF [Amgen] 5 microgram/kg/d sc d15‐d28 of each cycle) 3. no placebo used 4. no prophylactic antibiosis allowed. | |
| Outcomes | dose intensity, toxicity (duration and nadir leucopenia, febrile neutropenia, incidence, grade and duration of infections), hospitalisation | |
| Notes | funding: Amgen, Thousand Oaks, CA | |
| Risk of bias | ||
| Bias | Authors' judgement | Support for judgement |
| Allocation concealment? | Low risk | A ‐ Adequate |
Dunlop MOPP 1998*.
| Methods | Additional information obtained by personal communication with the study author. | |
| Participants | see Dunlop MOPP 1998 | |
| Interventions | see Dunlop MOPP 1998 | |
| Outcomes | see Dunlop MOPP 1998 | |
| Notes | see Dunlop MOPP 1998 | |
| Risk of bias | ||
| Bias | Authors' judgement | Support for judgement |
| Allocation concealment? | Low risk | A ‐ Adequate |
Dunlop MOPP/EVAP 98.
| Methods | RCT, 1/1991‐6/1993*, allocation by phoning central AMGEN Data Centre | |
| Participants | 28 patients randomised, 22 evaluated, age 19‐41, gender m/f: 15/7, country: UK, Hodgkin's disease,biopsy proven*, untreated, stage IB‐IV Hodgkin's disease | |
| Interventions | 1. CT Mustine 6 mg/m², iv, d1and 8 Vincristine 1.4 mg/m², iv, d1 Procarbazine 100 mg/m², po, d1‐7 Prednisolone 25 mg/m², po, d1‐14 Etoposide 75 mg/m², iv, d8‐10 Adriamycin 25 mg/m², iv, d8 Vinblastine 6mg/m², iv, d8 2. G‐CSF (5 microgram/kg/d sc d11‐d28 of each cycle rmetHuG‐CSF by Amgen) 3. no placebo used 4. no prophylactic antibiosis allowed | |
| Outcomes | dose intensity, toxicity (duration and nadir leucopenia, febrile neutropenia, incidence, grade and duration of infections), hospitalisation | |
| Notes | funding: Amgen, Thousand Oaks, CA | |
| Risk of bias | ||
| Bias | Authors' judgement | Support for judgement |
| Allocation concealment? | Low risk | A ‐ Adequate |
Dunlop MOPP/EVAP 98*.
| Methods | Additional information obtained by personal communication with the study author. | |
| Participants | see Dunlop MOPP/EVAP 98 | |
| Interventions | see Dunlop MOPP/EVAP 98 | |
| Outcomes | see Dunlop MOPP/EVAP 98 | |
| Notes | see Dunlop MOPP/EVAP 98 | |
| Risk of bias | ||
| Bias | Authors' judgement | Support for judgement |
| Allocation concealment? | Low risk | A ‐ Adequate |
Engelhard 1994.
| Methods | see Gerhartz 1993c | |
| Participants | see Gerhartz 1993c | |
| Interventions | see Gerhartz 1993c | |
| Outcomes | probability of survival, duration of CR | |
| Notes | see Gerhartz 1993 | |
| Risk of bias | ||
| Bias | Authors' judgement | Support for judgement |
| Allocation concealment? | Low risk | A ‐ Adequate |
Fridrik 1997.
| Methods | RCT, 1991‐95, central allocation* | |
| Participants | 85 patients randomised, 74 pts evaluated, age: 19‐72*, median age 52, gender m/f: 43/31, country: Austria, high grade NHL, untreated, stage I‐IV | |
| Interventions | 1. CT Cyclophosphamide 750 mg/m², iv, d1 Epirubicin 70 mg/m², iv, d1 Vincristine 1.4 mg/m², iv, d1 and 8 Prednisolone 100 mg po, d1‐5 Ifosfamide 2000 mg/m2, iv, d15‐17 Uromitexane 400 mg/m², iv, d15‐17 VP16 100 mg/m², iv, d15‐17 Dexamethasone 40 mg/m², po, d15‐19 Methotrexate 800 mg/m², iv, d22 Ca‐folinate 15 mg/m², po, d23‐25 2. G‐CSF (E.coli derived, Amgen) was given in a dose of 5 µg/kg on d2‐7, d9‐14, d18‐21 and d23‐27. After 10 G‐CSF receiving patients entered the study, the dose was modulated, and instead of d9‐14 G‐CSF was given 2 days less, thus d9‐12 3. no placebo used 4. no AB prophylaxis given* | |
| Outcomes | incidence of febrile neutropenia, febrile episodes, number of documented infections, use of iv antibiotics, number of days in hospital due to febrile neutropenia, dose intensity, tumour response, time to first febrile neutropenia, time to relapse, time to treatment failure, survival, adverse effects | |
| Notes | funding: Roche Austria, later AMGEN* | |
| Risk of bias | ||
| Bias | Authors' judgement | Support for judgement |
| Allocation concealment? | Low risk | A ‐ Adequate |
Fridrik 1997*.
| Methods | Additional information obtained by personal communication with the study author. | |
| Participants | see Fridrik 1997 | |
| Interventions | see Fridrik 1997 | |
| Outcomes | see Fridrik 1997 | |
| Notes | see Fridrik 1997 | |
| Risk of bias | ||
| Bias | Authors' judgement | Support for judgement |
| Allocation concealment? | Low risk | A ‐ Adequate |
Gerhartz 1993.
| Methods | RCT, 1989‐91, allocation with central and independent centre, dispatched with numbered study drugs and sealed envelopes | |
| Participants | 182 patients randomised, 125 pts analysed for efficacy, 176 pts evaluated for safety analysis, age 15‐73, gender m/f: 90/61 country: D high‐grade NHL, untreated, stage II‐IV, biopsy proven | |
| Interventions | 1. CT: Cyclophosphamide 700 mg/m², iv, d1 Doxorubicin 60mg/ m² , iv, d1 Bleomycin 15 mg absolute dose, iv, d15 Vincristine 1mg/m² , iv, d1 and 15 Procarbazine 100 mg/m², po, d1‐7 Prednisolone 50 mg/m² po, d1‐7 Mesna 400 mg, iv after cyclophosphamide 2. GM‐CSF (unglykosylated GM‐CSF produced by Sandoz) 400 µg per patient sc 3. placebo given | |
| Outcomes | leucocyte counts, frequency and severity of infections, tumour response, hospitalisation, freedom from treatment failure, adverse effects | |
| Notes | funding: Sandoz Pharma Ltd | |
| Risk of bias | ||
| Bias | Authors' judgement | Support for judgement |
| Allocation concealment? | Low risk | A ‐ Adequate |
Gerhartz 1994a.
| Methods | Follow‐up report of Gerhartz 1993 and Engelhard 1994. | |
| Participants | ||
| Interventions | ||
| Outcomes | ||
| Notes | ||
| Risk of bias | ||
| Bias | Authors' judgement | Support for judgement |
| Allocation concealment? | Low risk | A ‐ Adequate |
Gisselbrecht 1997.
| Methods | RCT, 1990‐92, concealed allocation* | |
| Participants | 162 patients randomised and analysed, age15‐55, gender m/f: 15‐55, country: F, B intermediate and high grade NHL, histological subtypes: diffuse large cell lymphoma (48%, diffuse mixed lymphoma 17%), stage I‐IV, untreated | |
| Interventions | 1. CT Cyclophosphamide 1200 mg/m², iv, d1 Vindesine 2 mg/m², iv, d1 and d5 Bleomycin 10 mg, iv, d1 and d5 Prednisone 60 mg/m², po, d1‐5 Methotrexate 15 mg intrathecal, d1 Adriamycin 75 mg/m², iv, d1 or Mitoxantrone 12 mg/m², iv, d1 2. G‐CSF (glycosylated recombinant human granulocyte colony‐stimulating factor, Chugai) 5 µg/kg/d sc, d6‐d13, outpatients 3. placebo 4. no AB prophylaxis given | |
| Outcomes | incidence of fever, infection, neutropenia, adverse effects, dose intensity, tumour response, survival | |
| Notes | funding: Chugai* | |
| Risk of bias | ||
| Bias | Authors' judgement | Support for judgement |
| Allocation concealment? | Low risk | A ‐ Adequate |
Gisselbrecht 1997*.
| Methods | Additional information obtained by personal communication with the study author. | |
| Participants | see Gisselbrecht 1997 | |
| Interventions | see Gisselbrecht 1997 | |
| Outcomes | see Gisselbrecht 1997 | |
| Notes | see Gisselbrecht 1997 | |
| Risk of bias | ||
| Bias | Authors' judgement | Support for judgement |
| Allocation concealment? | Low risk | A ‐ Adequate |
Pettengell 1992.
| Methods | RCT, 1989‐91, method of allocation not specified | |
| Participants | 80 patients randomised, age 16‐71, gender m/f: 53/27, c: UK, high grade de novo NHL, stage I‐IV, histology: diffuse large and mixed cell lymphoma | |
| Interventions | 1. CT Adriamycin 35 mg/m², iv, d1, 15, 29, 43, 57, 71 Cyclophosphamide 350 mg/m², iv, d1, 29, 57 Vincristine 1.4 mg/m², iv, d8, 22, 36, 50, 64 Bleomycin 10 mg/m², iv, d8, 36, 64 Etoposide 100 mg/m², po, d15‐19, d43‐47, d71‐75 Prednisolone 50 mg po, daily for 5 weeks than reduced. 2. G‐CSF: rmetHuG‐CSF 230 µg/m²/d, sc, for 13 weeks except days preceeding and during doxorubicin, cyclophosphamide, etoposide 3. no placebo given 4. Antibiotic prophylaxis: cotrimoxazole 960 mg po twice daily and Ketoconazole 200 mg po twice daily both drugs given for 12 weeks with start of CT | |
| Outcomes | tumour response, dose intensity, CT delays, incidence of neutropenia, febrile neutropenia, infections, antibiotic use, hospitalisation, adverse events, overall survival, disease free survival | |
| Notes | funding: supported by Amgen‐Roche, the Cancer Research Campaign, Leukaemia Research Fund | |
| Risk of bias | ||
| Bias | Authors' judgement | Support for judgement |
| Allocation concealment? | Unclear risk | B ‐ Unclear |
Souêtre 1994.
| Methods | Economic evaluation of the clinical study published by Gisselbrecht 1997. | |
| Participants | see Gisselbrecht 1997 | |
| Interventions | see Gisselbrecht 1997 | |
| Outcomes | economic evaluation | |
| Notes | see Gisselbrecht 1997 | |
| Risk of bias | ||
| Bias | Authors' judgement | Support for judgement |
| Allocation concealment? | Low risk | A ‐ Adequate |
Zinzani 1997.
| Methods | RCT, 1993‐95, allocation concealed* | |
| Participants | 158 patients randomised, 149 patients evaluated, age 60‐82, gender m/f: 69: 80, country: Italy high‐grade de novo NHL, stage II‐IV, histology: diffuse large‐cell centroblastic and immunoblastic lymphoma. anaplastic large cell and peripheral T‐cell lymphoma | |
| Interventions | 1. CT: Cyclophosphamide 300 mg/m², iv, d1,15, 29, 43 Mitoxantrone 10 mg/m², iv, d1,15,29,43 Vincristine 2 mg, iv, d8, 22, 36, 50 Etoposide 150 mg/m², iv, d8 and d36 Bleomycin 10 mg/m², iv, d22 and d50 Prednisone 40 mg im, daily, dose tapered over the last 2 weeks 2. G‐CSF 3. no placebo 4. AB prophylaxis given | |
| Outcomes | incidence of neutropenia, anaemia, thrombocytopenia and infections; adverse effects, dose intensity, tumour response, relapse free and progression free survival, overall survival | |
| Notes | funding: not pharmaceutically sponsored* | |
| Risk of bias | ||
| Bias | Authors' judgement | Support for judgement |
| Allocation concealment? | Low risk | A ‐ Adequate |
Zinzani 1997*.
| Methods | Additional information obtained by personal communication with the study author. | |
| Participants | see Zinzani 1997 | |
| Interventions | see Zinzani 1997 | |
| Outcomes | see Zinzani 1997 | |
| Notes | see Zinzani 1997 | |
| Risk of bias | ||
| Bias | Authors' judgement | Support for judgement |
| Allocation concealment? | Low risk | A ‐ Adequate |
Zinzani 1999.
| Methods | Follow‐up report to Zinzani 1997. | |
| Participants | ||
| Interventions | ||
| Outcomes | ||
| Notes | ||
| Risk of bias | ||
| Bias | Authors' judgement | Support for judgement |
| Allocation concealment? | Low risk | A ‐ Adequate |
Ösby 2003.
| Methods | this is the full text publication to Björkholm 1999. For details see Björkholm 1999 | |
| Participants | ||
| Interventions | ||
| Outcomes | ||
| Notes | ||
| Risk of bias | ||
| Bias | Authors' judgement | Support for judgement |
| Allocation concealment? | Unclear risk | D ‐ Not used |
Ösby CHOP 2003.
| Methods | see Björkholm CHOP 1999 | |
| Participants | ||
| Interventions | ||
| Outcomes | ||
| Notes | ||
| Risk of bias | ||
| Bias | Authors' judgement | Support for judgement |
| Allocation concealment? | Unclear risk | D ‐ Not used |
Ösby CNOP 2003.
| Methods | see Björkholm CNOP 1999 | |
| Participants | ||
| Interventions | ||
| Outcomes | ||
| Notes | ||
| Risk of bias | ||
| Bias | Authors' judgement | Support for judgement |
| Allocation concealment? | Unclear risk | D ‐ Not used |
* data obtained by personal communication with the study author
Characteristics of excluded studies [ordered by study ID]
| Study | Reason for exclusion |
|---|---|
| Adde 1998 | Follow up report of Magrath 1996. |
| Anaissie 1996 | RCT in the treatment of febrile neutropenia |
| Bergmann 1995 | Patients (N = 35) were randomised to receive either rhGM‐CSF or placebo during the first two chemotherapy cycles and rhGM‐CSF for all following cycles. |
| Bertini 1996 | Non randomised trial with 67 patients. G‐CSF was given according to the drug availability at the specific hospital: "As this factor was not generally available in Italy at that time, only some of the participating centers included it in the treatment program. However, all patients in a single center received the same treatment either with or without G‐CSF." |
| Bodey 1994 | RCT in the treatment of febrile neutropenia |
| Gerhartz 1993ex | Treatment study, 60 pts with established neutropenia were included in this study to receive GM‐CSF or placebo at random. |
| Gianni 1990 | Non randomised study (N = 36), NHL and breast cancer patients included, less than 10 NHL pts per study arm. |
| Gordon 1999 | Phase II study without control group. |
| Gregory 1998 | Less than 10 lymphoma pts per study arm. |
| Gustavsson 1997 | Non randomised study with historical control group. |
| Hansen 1995 | Fourteen pts with NHL were randomised to receive G‐CSF or no treatment prior to chemotherapy. |
| Hartmann 1997 | randomised intervention study in pts (N = 71) with established neutropenia. |
| Ho 1990 | Non randomised study. |
| Hovgaard 1992 | Dose finding study. |
| Kaku 1993 | Secondary prophylaxis, only pts (N = 62) with granulocytopenia (<1x10³/µl) after the first cycle of chemotherapy were enrolled. |
| Kaneko 1991 | G‐CSF or placebo was started subcutaneously 72 hours after completion of the second cycle of chemotherapy and continued for 14 days. See also Ogawa 1990. |
| Kaplan 1991 | Effect of GM‐CSF in patients (N = 21) receiving chemotherapy for human immunodeficiency virus‐associated non‐Hodgkin's lymphoma, randomised study. |
| Karthaus 1998 | Randomised controlled trial on topical oral G‐CSF to prevent mucositis in pts (N = 8) with high‐grade lymphoma. |
| Liberati 1991 | Part of a multicenter study. This publication reports on 14 pts with non‐Hogkin lymphoma receiving GM‐CSF or placebo during chemotherapy. This report was written before the randomised code was made known. The author was contacted. However, we were not able to obtain additional data or information. |
| Lopez‐Hernandez 2000 | RCT in the treatment of febrile neutropenia |
| Magrath 1996 | Ths trial analysed a mixed population of children (N = 33) and adults (N = 39). 16 adult lymphoma pts were randomised to receive or not receive GM‐CSF. See also Adde 1998. |
| Maher 1994 | RCT in the treatment of febrile neutropenia |
| Maiche 1993 | Secondary prophylaxis: 59 pts who had earlier developed an infection following antineoplastic chemotherapy were randomised to receive either granulocyte colony‐stimulating factor (G‐CSF) alone or G‐CSF + quinolone as prophylaxis during subsequent identical chemotherapy courses. |
| Mangiagalli 1995 | Non randomised study with historical control group. 15 NHL pts received G‐CSF, 5 NHL pts served as historical control. |
| Mayordomo 1995 | Treatment study. |
| Moreau 1997 | This trial randomised controlled trial was conducted in pts (N =102) with multiple myeloma. |
| Motoyoshi 1986 | randomised crossover study comparing the hematopoietic effect of partially purified human urinary colony‐stimulating factor in 24 pts with malignant lymphoma, solid tumours, or multiple myeloma. |
| Niitsu 1995 | Non randomised study (N = 64). |
| Ogawa 1990 | Japanese publication. Pts with malignant lymphoma were randomised to receive G‐CSF or placebo starting 72 hours after the termination of the second cycle of chemotherapy and continued for 14 days. This report seems to be a detailed version of the phase III study that was reported in English by Kaneko 1991. |
| Rao 2005 | randomised controlled trial: 34 patients with CLL (N = 16) or low grade NHL (N = 18), i.e. less than 10 lymphoma patients per arm. |
| Riccardi 1993 | Non randomised trial: 17 consecutive pts with HD received chemotherapy with (N =9) or without (N =8) GM‐CSF. |
| Seymour 1995 | randomised controlled dose finding study in pts with solid tumours (N = 55) and malignant lymphoma (N =11). |
| Shi 1994 | Chinese publication, randomised cross over study in 21 pts receiving chemotherapy. Unclear whether lymphoma pts were enrolled. This might be the same study as Shi 1996, however could not be clarified due to lack of language skills. |
| Shi 1996 | randomised cross‐over clinical trial in pts with NHL (N = 10) and solid tumours. Language: Chinese. Might be the same study as Shi 1994. |
| Togawa 2000 | Randomised controlled trial of pts (N = 98) with multiple myeloma treated with G‐CSF for chemotherapy induced neutropenia. Chugai Ltd. kindly provided us with a translation of the Japanese report. |
| Unpublished trial | This trial was identified via internet databases. In this multicenter study 100 patients were randomised to receive GM‐CSF or placebo during chemotherapy. None of the participating physicians contacted had data of this trial. The pharmaceutical company supposed to be in charge of did not provide information about this study. |
| Vellenga 1996 | RCT in the treatment of febrile neutropenia |
| Wilson 1998 | Non randomised study: the first 16 pts received no G‐CSF and the subsequent 29 pts received G‐CSF on all cycles. |
| Yau 1996 | Randomised controlled study in pts with breast cancer (N = 46) and malignant lymphoma (N =10). |
| Yoshida 1999 | RCT in the treatment of febrile neutropenia |
| Zagonel 1994 | Non randomised study: 12 consecutive pts received G‐CSF during chemotherapy compared to 11 consecutive pts who received the same chemotherapy regimen without growth factor support. |
Characteristics of ongoing studies [ordered by study ID]
Blay.
| Trial name or title | Elypse 2 |
| Methods | |
| Participants | patients with malignant lymphoma, all sub‐entities included less acute leukemias adult patients (>16 years) undergoing chemotherapy without stem cell transplantation. It is planned to enrol 144 patients. |
| Interventions | G‐CSF or GM‐CSF |
| Outcomes | |
| Starting date | |
| Contact information | |
| Notes | study is still ongoing |
Cunningham.
| Trial name or title | A Phase III Trial comparing CHOP to PMitCEBO with or without G‐CSF in patients aged 60 plus with aggressive NHL |
| Methods | |
| Participants | elderly patients with aggressive non‐Hodgkin's lymphoma, target: N = 410 |
| Interventions | Two different types of chemotherapy with or without G‐CSF |
| Outcomes | Primary endpoint: comparison of failure‐free survival between the groups randomised to PMitCEBO and CHOP Secondary endpoints: OS, disease specific survival, relapse free survival, death due to toxicity, in‐patient days, in‐patients days due to sepsis, dose intensity, response rate, toxicity |
| Starting date | 11 March 1997 |
| Contact information | |
| Notes | study is still ongoing |
Differences between protocol and review
None
Contributions of authors
JULIA BOHLIUS: Protocol development, searching for trials, eligibility and quality assessment, data extraction and analysis, drafting of final review, updating review
ANDREAS ENGERT: Clinical and scientific advice, assessment of eligibility and quality, data analysis, content input
CHRISTINE HERBST: Update: abstract screening, eligibility and quality assessment, data extraction and analysis, drafting of the updated review
MARCEL REISER: Searching for trials, assessment of eligibility and quality, data extraction and analysis, content input
GUIDO SCHWARZER: Statisticaladvice and data analysis
Sources of support
Internal sources
Department I of Internal Medicine, University of Cologne, Germany.
-
Köln Fortune, Germany.
Funding programme “Köln Fortune”, Medical Faculty University of Cologne
External sources
-
BMBF, Germany.
The Editorial Base is funded by Federal Ministry of Education and Research (BMBF) No : 01GH0501
-
Cochrane Incentive Scheme, UK.
Department of Health, England
Declarations of interest
Chugai Pharma (Chugai Pharma Marketing Ltd., Subsidiary Germany, Frankfurt/Main) provided the translation of a Japanese publication (Togawa 2000) for the Cochrane Haematological Malignancies Group. Andreas Engert received research funding and honoraria from Amgen Ltd. for other projects.
New search for studies and content updated (no change to conclusions)
References
References to studies included in this review
Aglietta 2000 {published data only}
- Aglietta M, Montemurro F, Fagioli F, Volta C, Botto B, Cantonetti M, et al. Short term treatment with Escherichia coli recombinant human granulocyte‐macrophage‐colony stimulating factor prior to chemotherapy for Hodgkin disease. Cancer 2000;88:454‐60. [DOI] [PubMed] [Google Scholar]
Aglietta 2000* {unpublished data only}
- Personal communication in addition to Aglietta 2000.
Avilés 1994 {published data only}
- Avilés A, Díaz‐Maqueo JC, Talavera A, Nambo MJ, García EL. Effect of granulocyte colony‐stimulating factor in patients with diffuse large cell lymphoma treated with intensive chemotherapy. Leukemia and Lymphoma 1994;15:153‐7. [DOI] [PubMed] [Google Scholar]
Avilés 1994* {unpublished data only}
- Personal communication in addition to Avilès 1994.
Bastion 1993 {published data only}
- Bastion Y, Bosly A, Gisselbrecht C, Reyes F, Tilly H, Herbrecht R, et al. A randomized double‐blind phase III study of Filgrastim (recombinant human G‐CSF) vs placebo during intensive induction chemotherapy in 55 to 59 year old patients (pts) with poor prognosis aggressive Non‐Hodgkin's Lymphoma. Blood. 1993; Vol. 82 Suppl (1):143a.
Bastion ACVBP 1993 {published data only}
- Data on patients from the Bastion 1993 study, who received ACVBP chemotherapy.
Bastion VIMMM 1993 {published data only}
- Data on patients from the Bastion 1993 study, who received VIMMM chemotherapy.
Björkholm 1999 {published and unpublished data}
- Björkholm M, Osby E, Hagberg H, Kvaloy S, Teerenhovi L, Myhre J, et al. Randomized trial of r‐metHu granulocyte colony‐stimulating factor (G‐CSF) as adjunct to CHOP or CNOP treatment of elderly patients with aggressive non‐Hodgkin's lymphoma. Blood. 1999; Vol. 94, 10 Suppl (1):599a.
Björkholm CHOP 1999 {published and unpublished data}
- Data on patients from the Björkholm 1999 study, who received CHOP chemotherapy.
Björkholm CNOP 1999 {published and unpublished data}
- Data on patients from the Björkholm 1999 study, who received CNOP chemotherapy.
Burton 2006 {published data only}
- Burton C, Linch D, Hoskin P, Milligan D, Dyer MJS, et al. A phase III trial comparing CHOP to PMitCEBO with or without G‐CSf in patients aged 60 plus with aggressive non‐Hodgkin´s lymphoma. Br J Cancer 2006;94:806‐813. [DOI] [PMC free article] [PubMed] [Google Scholar]
Burton CHOP 2006 {published data only}
- Data on patients from the Burton 2006 study who received CHOP.
Burton PMitCEBO 2006 {published data only}
- Data from patients in the Burton 2006 study who received PMitCEBO.
Cunningham* {unpublished data only}
- Cunningham D. Randomised trial of platinum based chemotherapy +/‐G‐CSF in relapsed Non‐Hodgkins and Hodgkins Lymphoma.
Doorduijn 2003 {published data only}
- Doorduijn JK, an der Holt B, Imhoff GW, Hem KG, Kramer MHH, Oers MHJ, et al. CHOP compared to CHOP plus granulocyte colony‐stimulating factor in elderly patients with aggressive Non‐Hodgkin's Lymphoma. Journal of Clinical Oncology 2003;21(16):3041‐50. [DOI] [PubMed] [Google Scholar]
Dunlop 1998 {published data only}
- Dunlop DJ, Eatock MM, Paul J, Anderson S, Reed NS, Soukop M, et al. Randomized multicentre trial of filgrastim as an adjunct to combination chemotherapy for Hodgkin's disease. West of Scotland Lymphoma Group. Clinical Oncology (Royal College of Radiologists) 1998;10:107‐14. [DOI] [PubMed] [Google Scholar]
Dunlop MOPP 1998 {published data only}
- Data on patients from the Dunlop 1998 study, who received MOPP chemotherapy.
Dunlop MOPP 1998* {unpublished data only}
- Personal communication in addition to Dunlop MOPP 1994.
Dunlop MOPP/EVAP 98 {published data only}
- Data on patients from the Dunlop 1998 study, who received MOPP/EVAP chemotherapy.
Dunlop MOPP/EVAP 98* {unpublished data only}
- Personal communication in addition to Dunlop MOPP/EVAP 1998.
Engelhard 1994 {published data only}
- Engelhard M, Gerhartz H, Brittinger G, Engert A, Fuchs R, Geiseler B, et al. Cytokine efficiency in the treatment of high‐grade malignant non‐ Hodgkin's lymphomas: Results of a randomized double‐blind placebo‐ controlled study with intensified COP‐BLAM plus‐or‐minus sign rhGM‐ CSF.. Annals of Oncology 1994;5:123‐5. [DOI] [PubMed] [Google Scholar]
Fridrik 1997 {published data only}
- Fridrik MA, Greil R, Hausmaninger H, Krieger O, Oppitz P, Stoger M, et al. Randomized open label phase III trial of CEOP/IMVP‐Dexa alternating chemotherapy and filgrastim versus CEOP/IMVP‐Dexa alternating chemotherapy for aggressive non‐Hodgkin's lymphoma (NHL). A multicenter trial by the Austrian Working Group for Medical Tumor Therapy. Annals of Hematology 1997;75:135‐40. [DOI] [PubMed] [Google Scholar]
Fridrik 1997* {unpublished data only}
- Personal communication in addition to Fridrik 1997.
Gerhartz 1993 {published data only}
- Gerhartz HH, Engelhard M, Meusers P, Brittinger G, Wilmanns W, Schlimock G, et al. Randomized, double‐blind, placebo‐controlled, phase III study of recombinant human granulocyte‐macrophage colony‐stimulating factor as adjunct to induction treatment of high‐grade malignant Non‐Hodgkin's Lymphoma. Blood 1993;82(8):2329‐39. [PubMed] [Google Scholar]
Gerhartz 1994a {published data only}
- Gerhartz HH, Engelhard M, Brittinger G, Schlimok G, Thiel E, Huber C, et al. Recombinant human granulocyte‐macrophage colony‐stimulating factor as adjunct to chemotherapy in aggressive non‐Hodgkin's lymphomas. Seminars in Oncology 1994;21, 6 Suppl (16): 25‐8. [PubMed] [Google Scholar]
Gisselbrecht 1997 {published data only}
- Gisselbrecht C, Haioun C, Lepage E, Bastion Y, Tilly H, Bosly A, et al. Placebo‐controlled phase III study of Lenograstim (glycosylated recombinant human granulocyte colony‐stimulating factor) in aggressive non‐Hodgkin's lymphoma: factors influencing chemotherapy administration. Groupe d'Etude des Lymphomes de l'Adulte. Leukemia and Lymphoma 1997;25:289‐300. [DOI] [PubMed] [Google Scholar]
Gisselbrecht 1997* {unpublished data only}
- Personal communication in addition to Gisselbrecht 1997.
Pettengell 1992 {published data only}
- Pettengell R, Gurney H, Radford JA, Deakin DP, James R, Wilkinson PM, et al. Granulocyte colony‐stimulating factor to prevent dose‐limiting neutropenia in non‐Hodgkin's lymphoma: a randomized controlled trial. Blood 1992;80(6):1430‐6. [PubMed] [Google Scholar]
Souêtre 1994 {published data only}
- Souêtre E, Qing W. Economic analysis of Lenograstim in the correction of neutropenia following chemotherapy for non‐Hodgkin's lymphoma. PharmacoEconomics 1994;6, Suppl (2):36‐43. [DOI] [PubMed] [Google Scholar]
Zinzani 1997 {published data only}
- Zinzani PL, Pavone E, Storti S, Moretti L, Fattori PP, Guardigni L, et al. Randomized trial with or without granulocyte colony‐stimulating factor as adjunct to induction VNCOP‐B treatment of elderly high‐grade non‐Hodgkin's lymphoma. Blood 1997;89(11):3974‐9. [PubMed] [Google Scholar]
Zinzani 1997* {unpublished data only}
- Personal communication in addition to Zinzani 1997.
Zinzani 1999 {published data only}
- Zinzani PL, Storti S, Zaccaria A, Moretti L, Magagnoli M, Pavone E, et al. Elderly aggressive‐histology non‐Hodgkin's lymphoma: first‐line VNCOP‐B regimen experience on 350 patients. Blood 1999;94(1):33‐8. [PubMed] [Google Scholar]
Ösby 2003 {published data only}
- Ösby K, Hagberg H, Kvaloy S, Teerenhovi L, Anderson H, Cavallin‐Stahl E, et al. CHOP is superior to CNOP in elderly patients with aggressive lymphoma while outcome is unaffected by filgrastim treatment: results of a Nordic Lymphoma Group randomized trial. Blood 2003;101(10):3840‐8. [DOI] [PubMed] [Google Scholar]
Ösby CHOP 2003 {published data only}
Ösby CNOP 2003 {published data only}
References to studies excluded from this review
Adde 1998 {published data only}
- Adde M, Shad A, Venzon D, Arndt C, Gootenberg J, Neely J, et al. Additional chemotherapy agents improve treatment outcome for children and adults with advanced B‐cell lymphoma. Seminars in Oncology 1998;25, 2 suppl (4):33‐9. [PubMed] [Google Scholar]
Anaissie 1996 {published data only}
- Anaissie EJ, Vartivarian S, Bodey GP, Legrand C, Kantarjian H, Abi‐Said D, et al. Randomized comparison between antibiotics alone and antibiotics plus granulocyte‐macrophage colony‐stimulating factor (Escherichia coli‐derived) in cancer patients with fever and neutropenia. The American Journal of Medicine 1996;100:17‐23. [DOI] [PubMed] [Google Scholar]
Bergmann 1995 {published data only}
- Bergmann L, Karakas T, Knuth A, Lautenschlager G, Mitrou PS, Hoelzer D. Recombinant human granulocyte‐macrophage colony‐stimulating factor after combined chemotherapy in high‐grade non‐Hodgkin's lymphoma ‐ a randomised pilot study. European Journal of Cancer 1995;31A:2164‐8. [DOI] [PubMed] [Google Scholar]
Bertini 1996 {published data only}
- Bertini M, Freilone R, Vitolo U, Botto B, Ciotti R, Cinieri S, et al. The treatment of elderly patients with aggressive non‐Hodgkin's lymphomas: feasibility and efficacy of an intensive multidrug regimen.. Leukemia and Lymphoma 1996;22:483‐93. [DOI] [PubMed] [Google Scholar]
Bodey 1994 {published data only}
- Bodey GP, Anaissie E, Gutterman J, Vadhan‐Raj S. Role of granulocyte‐macrophage colony‐stimulating factor as adjuvant treatment in neutropenic patients with bacterial and fungal infection. European journal of clinical microbiology & infectious diseases 1994;13 Suppl (2):18‐22. [DOI] [PubMed] [Google Scholar]
Gerhartz 1993ex {published data only}
- Gerhartz HH, Stern AC, Wolf‐Hornung B, Kazempour M, Schmetzer H, Gugerli U, et al. Intervention treatment of established neutropenia with human recombinant granulocyte‐macrophage colony‐stimulating factor (rhGM‐CSF) in patients undergoing cancer chemotherapy. Leukemia Research 1993;17(2):175‐85. [DOI] [PubMed] [Google Scholar]
Gianni 1990 {published data only}
- Gianni AM, Bregni M, Siena S, Orazi A, Stern AC, Gandola L, et al. Recombinant human granulocyte‐macrophage colony‐stimulating factor reduces hematologic toxicity and widens clinical applicability of high‐dose cyclophosphamide treatment in breast cancer and non‐Hodgkin's lymphoma. Jounral of Clinical Oncology 1990;8(5):768‐78. [DOI] [PubMed] [Google Scholar]
Gordon 1999 {published data only}
- Gordon LI, Young M, Weller E, Habermann TM, Winter JN, Glick J, et al. A phase II trial of 200% ProMACE‐CytaBOM in patients with previously untreated aggressive lymphomas: Analysis of response, toxicity, and dose intensity. Blood 1999;94(10):3307‐14. [PubMed] [Google Scholar]
Gregory 1998 {published data only}
- Gregory S, Goh YT, Fuerst T, O'Brien T, Giles FJ. Fludarabine, cyclophosphamide and GM‐CSF is effective in chronic lymphocytic leukemia and low grade non Hodgkins lymphoma. Blood. 1998; Vol. 92 Suppl (10):276b.
Gustavsson 1997 {published data only}
- Gustavsson A. G‐CSF (filgrastim) as an adjunct to MOPP/ABVD therapy in Hodgkin's disease. Acta Oncologica 1997;36(5):483‐8. [DOI] [PubMed] [Google Scholar]
Hansen 1995 {published data only}
- Hansen PB, Johnsen HE, Ralfkiaer E, Jensen L, Gaarsdal E, Hansen NE. Short‐term rhG‐CSF priming before chemotherapy does mobilize blood progenitors but does not prevent chemotherapy induced myelotoxicity: a randomized study of patients with non‐Hodgkin's lymphomas. Leukemia and Lymphoma 1995;19:453‐60. [DOI] [PubMed] [Google Scholar]
Hartmann 1997 {published data only}
- Hartmann LC, Tschetter LK, Habermann TM, Ebbert LP, Johnson PS, Mailliard JA, et al. Granulocyte colony‐stimulating factor in severe chemotherapy‐induced afebrile neutropenia. New England Journal of Medicine 1997;336(25):1776‐80. [DOI] [PubMed] [Google Scholar]
Ho 1990 {published data only}
- Ho AD, Del VF, Haas R, Engelhard M, Hiddemann W, Ruckle H, et al. Sequential studies on the role of mitoxantrone, high‐dose cytarabine, and recombinant human granulocyte‐macrophage colony‐stimulating factor in the treatment of refractory non‐Hodgkin's lymphoma. Seminars in Oncology 1990;17:14‐9. [PubMed] [Google Scholar]
Hovgaard 1992 {published data only}
- Hovgaard DJ, Nissen NI. Effect of recombinant human granulocyte‐macrophage colony‐stimulating factor in patients with Hodgkin's disease: A Phase I/II Study. Journal of Clinical Oncology 1992;10(3):390‐7. [DOI] [PubMed] [Google Scholar]
Kaku 1993 {published data only}
- Kaku K, Takahashi M, Moriyama Y, Nakahata T, Masaoka T, Yoshida Y, et al. Recombinant human granulocyte‐macrophage colony‐stimulating factor (rhGM‐CSF) after chemotherapy in patients with non‐Hodgkin's lymphoma; a placebo‐controlled double blind phase III trial. Leukemia and Lymphoma 1993;11(3‐4):229‐38. [DOI] [PubMed] [Google Scholar]
Kaneko 1991 {published data only}
- Kaneko T, Takaku F, Ogawa M. Outline of clinical studies on recombinant human granulocyte colony stimulating factor (KRN 8601) in Japan. Tokai Journal of Experimental & Clinical Medicine 1991;16(1):51‐61. [PubMed] [Google Scholar]
Kaplan 1991 {published data only}
- Kaplan LD, Kahn JO, Crowe S, Northfelt D, Neville P, Grossberg H, et al. Clinical and virologic effects of recombinant human granulocyte‐macrophage colony‐stimulating factor in patients receiving chemotherapy for human immunodeficiency virus‐associated non‐Hodgkin's lymphoma: results of a randomized trial. Journal of Clinical Oncology 1991;9(6):929‐40. [DOI] [PubMed] [Google Scholar]
Karthaus 1998 {published data only}
- Karthaus M, Rosenthal C, Huebner G, Paul H, Elser C, Hertenstein B, et al. Effect of topical oral G‐CSF on oral mucositis: a randomised placebo‐controlled trial. Bone Marrow Transplantation 1998;22(8):781‐5. [DOI] [PubMed] [Google Scholar]
Liberati 1991 {published data only}
- Liberati AM, Cinieri S, Schippa M, Clemente F, Filippo S, Grignani F. GM‐CSF: clinical trials in non‐Hodgkin's lymphoma patients with chemotherapy induced leucopenia. Leukemia 1991;5 Suppl (1): 119‐22. [PubMed] [Google Scholar]
Lopez‐Hernandez 2000 {published data only}
- Lopez‐Hernandez MA, Jimenez‐Alvarado R, Borbolla‐Escoboza R, Flores‐Chapa JD, Alvarado‐Ibarra M, Gonzalez‐Avante M, et al. Factor estimulante de colonias de granulocitos en el tratamiento de neutropenia febril. Gaceta medica de Mexico 2000;136(2):99‐105. [PubMed] [Google Scholar]
Magrath 1996 {published data only}
- Magrath I, Adde M, Shad A, Venzon D, Seibel N, Gootenberg J, et al. Adults and children with small non‐cleaved‐cell lymphoma have a similar excellent outcome when treated with the same chemotherapy regimen. Journal of Clinical Oncology 1996;14(3):925‐34. [DOI] [PubMed] [Google Scholar]
Maher 1994 {published data only}
- Maher DW, Lieschke GJ, Green M, Bishop J, Stuart‐Harris R, Wolf M, et al. Filgrastim in patients with chemotherapy‐induced febrile neutropenia. American College of Physicians 1994;121:492‐501. [DOI] [PubMed] [Google Scholar]
Maiche 1993 {published data only}
- Maiche AG, Muhonen T. Granulocyte colony‐stimulating factor (G‐CSF) with or without a quinolone in the prevention of infection in cancer patients. European Journal of Cancer 1993;29A(10):1403‐5. [DOI] [PubMed] [Google Scholar]
Mangiagalli 1995 {published data only}
- Mangiagalli M, Miccolis I, Maffe P, Pogliani EM, Corneo G. Role of granulocyte colony‐stimulating factor in relapsed/resistant intermediate and high‐grade non‐Hodgkin's lymphoma patients treated with the E‐SHAP regimen. Tumori 1995;81:91‐5. [DOI] [PubMed] [Google Scholar]
Mayordomo 1995 {published data only}
- Mayordomo JI, Rivera F, Díaz‐Puente MT, Lianes P, Colomer R, López‐Brea M, et al. Improving treatment of chemotherapy‐induced neutropenic fever by administration of colony‐stimulating factors. Journal of the National Cancer Institute 1995;87(11):803‐8. [DOI] [PubMed] [Google Scholar]
Moreau 1997 {published data only}
- Moreau P, Fiere D, Bezwoda WR, Facon T, Attal M, Laporte JP, et al. Prospective randomized placebo‐controlled study of granulocyte‐macrophage colony‐stimulating factor without stem‐cell transplantation after high‐dose melphalan in patients with multiple myeloma. Journal of Clinical Oncology 1997;15(2):660‐6. [DOI] [PubMed] [Google Scholar]
Motoyoshi 1986 {published data only}
- Motoyoshi K, Takaku F, Maekawa T, Miura Y, Kimura K, Furusawa S, et al. Protective effect of partially purified human urinary colony‐stimulating factor on granulocytopenia after antitumor chemotherapy. Experimental Hematology 1986;14:1069‐75. [PubMed] [Google Scholar]
Niitsu 1995 {published data only}
- Niitsu N, Umeda M. Usefulness of COP‐BLAM Therapy with concomitant G‐CSF in elderly patients with non‐Hodgkin's lymphoma in comparison with patients not given G‐CSF. Japanese Journal of Geriatrics 1995;32(6):410‐5. [DOI] [PubMed] [Google Scholar]
Ogawa 1990 {published data only}
- Ogawa M, Masaoka T, Mizoguchi H, Takaku F, Nakashima M. [A phase III study of KRN 8601 (rhG‐CSF) on neutropenia induced by chemotherapy for malignant lymphoma‐‐a multi‐institutional placebo controlled double‐blind comparative study]. Gan‐To‐Kagaku‐Ryoho. Cancer & chemotherapy 1990;17(3):365‐73. [PubMed] [Google Scholar]
Rao 2005 {published data only}
Riccardi 1993 {published data only}
- Riccardi A, Gobbi P, Danova M, Giordano M, Pieresca C, Bertoloni D, et al. MOPP/ABVD/CAD chemotherapy with and without recombinant human granulocyte‐macrophage colony stimulating factor in untreated, unfavorable prognosis Hodgkin's disease. Haematologica 1993;78(1):44‐8. [PubMed] [Google Scholar]
Seymour 1995 {published data only}
- Seymour AM, Campos E, Thatcher N, Greve J, Cunningham D, Howell A, et al. A single‐blind, randomised, vehicle‐controlled dose‐finding study of recombinant human granulocyte colony‐stimulating factor (lenograstim) in patients undergoing chemotherapy for solid cancers and lymphoma. European Journal of Cancer 1995;31A:2157‐63. [DOI] [PubMed] [Google Scholar]
Shi 1994 {published data only}
- Shi YK, Sun Y, Su M. Clinical study of recombinant human granulocyte‐macrophage colony‐stimulating factor on chemotherapy‐induced leukopenia. Chung Hua Chung Liu Tsa Chih 1994;16(5):356‐9. [PubMed] [Google Scholar]
Shi 1996 {published data only}
- Shi YK, Feng FY, Liu H‐B. Clinical study of recombinant human granulocyte colony‐stimulating factor (rhG‐CSF) on leukopenia induced by chemotherapy with CHOP and CAF regimen in cancer patients. Chinese Journal of Clinical Oncology 1996;23(4):252‐6. [PubMed] [Google Scholar]
Togawa 2000 {published data only}
- Togawa A, Mizoguchi H, Toyama K, Urabe A, Ohasi Y, Takaku F. Clinical evalutaion of rhG‐CSF in patients with neutropenia induced by chemotherapy for multiple myeloma. Rinsho Ketsueki. The Japanese Journal of Clinical Hematology 2000;41(2):115‐22. [PubMed] [Google Scholar]
Unpublished trial {unpublished data only}
- Phase III randomized double‐blind study of intensive chemotherapy with ARA‐C/CACP/VP‐16 plus GM‐CSF vs placebo in patients with relapsing or refractory intermediate‐ and high‐grade non‐Hodgkin's lymphoma (summary last modified 11/90). http://cancernet.nci.nih.gov/cgi‐bin/ 28.12.2000; Vol. Protocol IDs: AECM‐8903071, NCI‐V89‐0161, UW‐C89‐049‐05, NCI‐V89‐0252, MAOP‐3189, NCI‐V90‐0118, MSKCC‐90085, NCI‐V90‐0148.
Vellenga 1996 {published data only}
- Vellenga E, Uyl‐de‐Groot CA, Wit R, Keizer HJ. Löwenberg B, Haaft MA, et al. Randomized placebo‐controlled trial of granulocyte‐macrophage colony‐stimulating factor in patients with chemotherapy‐related febrile neutropenia. Journal of Clinical Oncology 1996;14(2):619‐27. [DOI] [PubMed] [Google Scholar]
Wilson 1998 {published data only}
- Wilson WH, Little R, Pearson D, Jaffe ES, Steinberg SM, Cheson BD, et al. Phase II and dose‐escalation with or without granulocyte colony‐stimulating factor study of 9‐aminocamptothecin in relapsed and refractory lymphomas. Journal of Clinical Oncology 1998;16(7):2345‐51. [DOI] [PubMed] [Google Scholar]
Yau 1996 {published data only}
- Yau JC, Neidhart JA, Triozzi P, Verma S, Nemunaitis J, Quick DP, et al. Randomized placebo‐controlled trial of granulocyte‐macrophage colony‐stimulating‐factor support for dose‐intensive cyclophosphamide, etoposide, and cisplatin. American Journal of Hematology 1996;51:289‐95. [DOI] [PubMed] [Google Scholar]
Yoshida 1999 {published data only}
- Yoshida M, Karasawa M, Naruse T, Fukuda M, Hirashima K, Oh H, et al. Effect of granulocyte‐colony stimulating factor on empiric therapy with flomoxef sodium and tobramycin in febrile neutropenic patients with hematological malignancies. Kan‐etsu Hematological Disease and Infection Study Group.. International Journal of Hematology 1999;69:81‐8. [PubMed] [Google Scholar]
Zagonel 1994 {published data only}
- Zagonel V, Babare R, Merola MC, Talamini R, Lazzarini R, Tirelle U, et al. Cost‐benefit of granulocyte colony‐stimulating factor administration in older patients with non‐Hodgkin's lymphoma treated with combination chemotherapy. Annals of Oncology 1994;5 Suppl (2):S127‐32. [DOI] [PubMed] [Google Scholar]
References to ongoing studies
Blay {unpublished data only}
- Blay JY. Elypse 2. personal communication.
Cunningham {unpublished data only}
- Cunningham D. A phase III trial comparing CHOP to PMitCEBO with or without G‐CSF in patients aged 60 plus with aggressive non‐Hodgkin's lymphoma. MREC/98/2/52. [DOI] [PMC free article] [PubMed]
Additional references
Alvarado Ibarra 1999
- Alvarado Ibarra ML, Borbolla Escoboza JR, López‐Hernández MA, González‐Avante CM, Flores Chapa JDD, Trueba Christy E, et al. Neutrophil recovery time and adverse side effects in acute leukemia patients treated with intensive chemotherapy and concomitant G or GM‐CSF. La Revista de Investigación Clínica 1999;51:77‐80. [PubMed] [Google Scholar]
Armitage 1993
- Armitage JO. The treatment of non‐Hodgkin's lymphoma. New England Journal of Medicine 1993;328(14):1023‐30. [DOI] [PubMed] [Google Scholar]
ASCO Guidelines 1994
- No authors listet. American Society of Clinical Oncology Recommendations for the Use of Hematopoietic Colony‐Stimulating Factors: Evidence‐Based, Clinical Practice Guidelines. Journal of Clinical Oncology 1994;12(11):2471‐508. [DOI] [PubMed] [Google Scholar]
ASCO Guidelines 1996
- No authors listet. Update of Recommendations for the Use of Hematopoietic Colony‐Stimulating Factors: Evidence‐Based Clinical Practice Guidelines. Journal of Clinical Oncology 1996;14(6):1957‐60. [DOI] [PubMed] [Google Scholar]
ASCO Guidelines 2000
- Ozer H, Armitage JO, Bennett CL, Crawford J, Demetri GD, Pizzo PA, et al. 2000 Update of recommendations for the use of hematopoietic colony‐stimulating factors: evidence‐based, clinical practice guidelines. Journal of Clinical Oncology 2000;18(20):3558‐85. [DOI] [PubMed] [Google Scholar]
ASCO Guidelines 2006
- Smith TJ, Khatcheressian J, Lyman GH, Ozer H, Armitage JO, Balducci L, et al. 2006 update of recommendations for the use of white blood cell growth factors: an evidence‐based clinical practice guideline. J Clin Oncol 2006;24(19):3187‐205. [DOI] [PubMed] [Google Scholar]
Barbui 1996
- Barbui T, Finazzi G, Grassi A, Marchioli R. Thrombosis in cancer patients treated with hematopoietic growth factors ‐ a meta‐analysis. On behalf of the Subcommittee on Haemaostasis and Malignancy of the Scientific and Standardization Committee of the ISTH. Thrombosis and Haemostasis 1996;75(2):368‐71. [PubMed] [Google Scholar]
Bennett 2000a
- Bennett CL, Stinson TJ, Bhoopalam N, Marriott M, Panganiban J, Kozloff MF. A double‐Blind, randomized trial of toxicity, resource use and costs for filgrastim and sargramostim. Conference Proceedings of the American Society of Hematology. 2000:abstract no 1712.
Bennett 2000b
- Bennett CL, Stinson TJ, Laver JH, Bishop MR, Godwin JE, Tallman MS. Cost analysis of adjunct colony stimulating factors for acute leukemia: can they improve clinical decision making. Leukemia and Lymphoma 2000;37(1‐2):65‐70. [DOI] [PubMed] [Google Scholar]
Beveridge 1998
- Beveridge RA, Miller JA, Kales AN, Binder RA, Robert NJ, Harvey JH, et al. A comparison of efficacy of sargramostim (yeast‐derived rhuGM‐CSF) and filgrastim (bacteria‐derived rhuG‐CSF) in the therapeutic setting of chemotherapy‐induced myelosuppression. Cancer Investigation 1998;16(6):366‐73. [DOI] [PubMed] [Google Scholar]
Bobey 1998
- Bobey N, Woodman RC. Neutropenic complications in advanced‐stage non‐Hodgkin lymphoma: implications for the use of prophylactic recombinant human granulocyte‐colony stimulating factor (G‐CSF). Clinical and Investigative Medicine ‐ Medicine Clinique et Experimentale 1998;21(2):63‐70. [PubMed] [Google Scholar]
Bodey 1966
- Bodey GP, Buckley M, Sathe YS, Freireich EJ. Quantitative relationships between circulating leukocytes and infection in patients with acute leukemia. Annals of Internal Medicine 1966;64(2):328‐40. [DOI] [PubMed] [Google Scholar]
Bodey 1986
- Bodey GP. Infection in cancer patients. The American Journal of Medicine 1986;81 Suppl (1A): 11‐26. [DOI] [PubMed] [Google Scholar]
Bow 1998
- Bow EJ. Infection risk and cancer chemotherapy: the impact of the chemotherapeutic regimen in patients with lymphoma and solid tissue malignancies. Journal of Antimicrobial Chemotherapy 1998;41 Suppl (D):1‐5. [DOI] [PubMed] [Google Scholar]
Bronchud 1988
- Bronchud MH, Potter MR, Morgenstern G, Blasco MJ, Scarffe JH, Thatcher N, et al. In vitro and in vivo analysis of the effects of recombinant human granulocyte colony‐stimulating factor in patients. British Journal of Cancer 1988;58(1):64‐9. [DOI] [PMC free article] [PubMed] [Google Scholar]
Bui 1995
- Bui BN, Chevallier B, Chevreau C, Krakowski I, Peny AM, Thyss A, et al. Efficacy of lenograstim on hematologic tolerance to MAID chemotherapy in patients with advanced soft tissue sarcoma and consequences on treatment dose‐intensity. Journal of Clinical Oncology 1995;13(10):2629‐36. [DOI] [PubMed] [Google Scholar]
Chevallier 1995
- Chevallier B, Chollet P, Merrouche Y, Roche H, Fumoleau P, Kerbat P, et al. Lenograstim prevents morbidity from intensive induction chemotherapy in the treatment of inflammatory breast cancer. Journal of Clinical Oncology 1995;13(7):1564‐71. [DOI] [PubMed] [Google Scholar]
Crawford 1991
- Crawford J, Ozer H, Stoller R, Johnson D, Lyman G, Tabbara I, et al. Reduction by granulocyte colony‐stimulating factor of fever and neutropenia induced by chemotherapy in patients with small‐cell lung‐cancer. New England Journal of Medicine 1991;325(3):164‐70. [DOI] [PubMed] [Google Scholar]
de Graaf 1996
- Graaf H, Willemse PH, Bong SB, Piersma H, Tjabbes T, Veelen H, et al. Dose intensity of standard adjuvant CMF with granulocyte colony‐stimulating factor for premenopausal patients with node‐positive breast cancer. Oncology 1996;53(4):289‐94. [DOI] [PubMed] [Google Scholar]
de Witte 1992
- Witte T, Gratwohl A, LN, Bacigalupo A, Stern AC, Speck B, et al. Recombinant human granulocyte‐macrophage colony‐stimulating factor accelerates neutrophil and monocyte recovery after allogeneic T‐cell‐depleted bone marrow transplantation. Blood 1992;79(5):1359‐65. [PubMed] [Google Scholar]
Deb 1998
- Deb G, Donfrancesco A, Slo LD, Cozza R, Castellano A, Paole F, et al. Shortened time to recovery from chemotherapy induced neutropenia in pediatric patients with high dose combined cytokines. Anticancer Research 1998;18(1B):489‐92. [PubMed] [Google Scholar]
Deeks 2001
- Deeks JJ, Altman DG, Bradburn M. Statistical methods for examining heterogeneity and combining results from several studies in meta‐analysis. Systematic Reviews in Health Care. Meta‐analysis in context. 2nd Edition. London: BMJ Books, 2001:285‐312. [Google Scholar]
Dempke 2000
- Dempke W, Poblozki A, Grothey A, Schmoll HJ. Human hematopoietic growth factors: Old lessons and new perspectives. Anticancer Research 2000;20:5155‐64. [PubMed] [Google Scholar]
DeVita 1987
- DeVita VT, Hubbard SM, Longo DL. The chemotherapy of lymphomas: looking back, moving forward. The Richard and Hinda Rosenthal Foundation Award Lecture. Cancer Research 1987;47(22):5810‐24. [PubMed] [Google Scholar]
Dickersin 1994
- Dickersin K, Scherer R, Lefebvre C. Identifying relevant studies for systematic reviews. British Medical Journal 1994;309:1286‐91. [DOI] [PMC free article] [PubMed] [Google Scholar]
Diehl 2003
- Diehl V, Franklin J, Pfreundschuh M, Lathan B, Paulus U, Hasenclever D, et al. Standard and increased‐dose BEACOPP chemotherapy compared with COPP‐ABVD for advanced Hodgkin's disease. New England Journal of Medicine 2003;348(24):2386‐95. [DOI] [PubMed] [Google Scholar]
Egger 1997
- Egger M, Davey Smith G, Schneider M, Minder C. Bias in meta‐analysis detected by a simple, graphical test. British Medical Journal 1997;315(7109):629‐34. [DOI] [PMC free article] [PubMed] [Google Scholar]
Engert 1994
- Engert A, Schaadt M, Diehl V. Malignant Lymphoma [Maligne Lymphome]. In: Classen M, Diehl V, Kochsiek K editor(s). Innere Medizin. 3rd Edition. Vol. 1, München ‐ Wien ‐ Baltimore: Urban & Schwarzenberg, 1994:180‐203. [Google Scholar]
EORTC Guidelines 2006
- Aapro MS, Cameron DA, Pettengell R, Bohlius J, Crawford J, Ellis M, et al. EORTC guidelines for the use of granulocyte‐colony stimulating factor to reduce the incidence of chemotherapy‐induced febrile neutropenia in adult patients with lymphomas and solid tumours. European Journal of Cancer 2006;42(15):2433‐53. [DOI] [PubMed] [Google Scholar]
Freedman 1999
- Freedman A, Nadler L. Maligne Diseases of lymphatic cells [Maligne Erkrankungen lymphatischer Zellen]. In: Fauci A, Braunwald E, Isselbacher K, et al. editor(s). Harrisons Innere Medizin. Vol. 1, London: McGraw‐Hill International, 1999:833‐862. [Google Scholar]
Fukuoka 1997
- Fukuoka M, Masuda N, Negoro S, Matsui K, Yana T, Kudoh S, et al. CODE chemotherapy with and without granulocyte colony‐stimulating factor in small‐cell lung cancer. British Journal of Cancer 1997;75(2):306‐9. [DOI] [PMC free article] [PubMed] [Google Scholar]
Goldie 1983
- Goldie JH, Coldman AJ. Quantitative model for multiple levels of drug resistance in clinical tumours. Cancer Treatment Reports 1983;67(10):923‐31. [PubMed] [Google Scholar]
Hackshaw 2004
- Hackshaw A, Sweetenham JW, Knight A. Are prophylactic haematopoietic growth factors of value in the management of patients with aggressive non‐Hodgkin's lymphoma?. British Journal of Cancer 2004;90(7):1302‐1305. [DOI] [PMC free article] [PubMed] [Google Scholar]
Herrmann 1998
- Herrmann R, Drings P. Lymphoproliferative diseases [Lymphoproliferative Erkrankungen]. In: Schettler G, Greten H editor(s). Innere Medizin. 9th Edition. Vol. 1, Stuttgart ‐ New York: Thieme, 1998:1009‐28. [Google Scholar]
Hryniuk 1984
- Hryniuk W, Bush H. The importance of dose intensity in chemotherapy of metastatic breast cancer. Journal of Clinical Oncology 1984;2(11):1281‐8. [DOI] [PubMed] [Google Scholar]
Hryniuk 1986
- Hryniuk W, Levine MN. Analysis of dose intensity for adjuvant chemotherapy trials in stage II breast cancer. Journal of Clinical Oncology 1986;4(8):1162‐70. [DOI] [PubMed] [Google Scholar]
Hryniuk 1987
- Hryniuk WM. Average relative dose intensity and the impact on design of clinical trials. Seminars in Oncology 1987;14(1):65‐74. [PubMed] [Google Scholar]
ICH 1999
- ICH Harmonised Tripartite Guideline. Statistical principles for clinical trials. International Conference on Harmonisation E9 Expert Working Group. Statistics in Medicine 1999;18:1905‐42. [PubMed] [Google Scholar]
Jadad 1996
- Jadad AR, Moore RA, Carroll D, Jenkinson C, Reynolds JM, Gavaghan DJ, et al. Assessing the quality of reports of randomized clinical trials: Is blinding necessary?. Controlled Clinical Trials 1996;17:1‐12. [DOI] [PubMed] [Google Scholar]
Klastersky 2000
- Klastersky J, Paesmans M, Rubenstein EB, Boyer M, Elting L, Feld R, et al. The multinational association for supportive care in cancer risk index: A multinational scoring system for identifying low‐risk febrile neutropenic cancer patients. Journal of Clinical Oncology 2000;18(16):3038‐51. [DOI] [PubMed] [Google Scholar]
Kuderer 2007
- Kuderer NM, Dale DC, Crawford J, Lyman GH. Impact of primary prophylaxis with granulocyte colony‐stimulating factor on febrile neutropenia and mortality in adult cancer patients receiving chemotherapy: a systematic review. [Review] [81 refs]. Journal of Clinical Oncology 2007;25(21):3158‐67. [DOI] [PubMed] [Google Scholar]
Lepage 1993
- Lepage E, Gisselbrecht C, Haioun C, Sebban C, Tilly H, Bosley A, et al. Prognostic significance of received relative dose intensity in non‐Hodgkin's lymphoma patients: Application to LNH‐87 protocol. Annals of Oncology 1993;4(8):651‐6. [DOI] [PubMed] [Google Scholar]
Lopez 1986
- Lopez AF, Williamson DJ, Gamble JR, Begley CG, Harlan JM, Klebanoff SJ, et al. Recombinant human granulocyte‐macrophage colony stimulating factor stimulates in vitro mature human neutrophil and eosinophil function, surfae receptor expression, and survival. Journal of Clinical Investigation 1986;78(5):1220‐8. [DOI] [PMC free article] [PubMed] [Google Scholar]
Lydaki 1995
- Lydaki E, Bolonaki E, Stiakaki E, Dimitriou H, Kalmantis T, Kalmanti M. Efficacy of recombinant human granulocyte colony‐stimulating factor and recombinant human granuloyte‐macrophage colony‐stimulating factor in neutropenic children with malignancies. Pediatric Hematology and Oncology 1995;12(6):551‐8. [DOI] [PubMed] [Google Scholar]
Lyman 1995
- Lyman GH, Balducci L. A cost analysis of hematopoietic colony‐stimulating factors. Oncology (Huntingt) 1995;9 Suppl (11):85‐91. [PubMed] [Google Scholar]
Lyman 1998
- Lyman GH, Kuderer NM, Balducci L. Economic impact of granulopoiesis stimulating agents on the management of febrile neutropenia. Current Opinion in Oncology 1998;10:291‐6. [DOI] [PubMed] [Google Scholar]
Lyman 2000
- Lyman GH. A predictive model for neutropenia associated with cancer chemotherapy. Pharmacotherapy 2000;20(7 Pt 2):104‐11S. [DOI] [PubMed] [Google Scholar]
Lyman 2002
- Lyman GH, Kuderer N, Djulbegovic B. Prophylactic granulocyte colony‐stimulating factor in patients receiving dose‐intensive cancer chemotherapy: A meta‐analysis. The American Journal of Medicine 2002;112:406‐11. [DOI] [PubMed] [Google Scholar]
Magrath 1997
- Magrath I, Adde M, Shad A, Venzon D, Seibel N, Neeley J, et al. Relative efficacy of G‐and GM‐CSF in ameliorating toxicity in an intensive treatment protocol for advanced, diffuse B cell NHLs, predominantly small noncleaved cell lymphomas. Abstracts of the American Society of Hematology. 1997:abstract no 847.
Morstyn 1988
- Morstyn G, Campbell L, Souza LM, Alton NK, Keech J, Green M, et al. Effect of granulocyte colony stimulating factor on neutropenia induced by cytotoxic chemotherapy. Lancet 1988;26(1):667‐72. [DOI] [PubMed] [Google Scholar]
Parmar 1998
- Parma MKB, Torri V, Stewart L. Extracting summary statistics to perform meta‐analyses of the published literature for survival endpoints. Statistics in Medicine 1998;17:2815‐34. [DOI] [PubMed] [Google Scholar]
Pettengell 1993
- Pettengell R, Testa NG, Swindell R, Crowther D, Dexter TM. Transplantation potential of hematopoietic cells released into the circulation during routine chemotherapy for non‐Hodgkin's lymphoma [see comments].. Blood 1993;82:2239‐48. [PubMed] [Google Scholar]
Pinto 2007
- Pinto L, Liu Z, Doan Q, Bernal M, Dubois R, Lyman G. Comparison of pegfilgrastim with filgrastim on febrile neutropenia, grade IV neutropenia and bone pain: a meta‐analysis of randomized controlled trials. Current Medical Research & Opinion 2007;23(9):2283‐95. [DOI] [PubMed] [Google Scholar]
Preundschuh 2004a
- Pfreundschuh M, Truemper L, Kloess M, Schmits R, Feller AC, Ruebe C, Rudolph C, Reiser M, Hossfeld DK, Eimermacher H, Hasenclever D, Schmitz N, Loeffler M, German High‐Grade Non‐Hodgkin´s Lymphoma Study Group. Two‐weekly or 3‐weekly CHOP chemotherapy with or without etoposide for the treatment of elderly patients with aggressive lymphomas: results of the NHL‐B2 trial of the DSHNHL. Blood 2004;104(3):634‐641. [DOI] [PubMed] [Google Scholar]
Preundschuh 2004b
- Pfreundschuh M, Truemper L, Kloess M, Schmits R, Feller AC, Rudolph C, Reiser M, Hossfeld DK, Metzner B, Hasenclever D, Schmitz N, Glass B, Ruebe C, Loeffler M, German High‐Grade Non‐Hodgkin´s Lymphoma Study Group. Two‐weekly or 3‐weekly CHOP chemotherapy with or without etoposide for the treatment of young patients with good‐prognosis (normal LDH) aggressive lymphomas: results of the NHL‐B1 trial of the DSHNHL. Blood 2004;104(3):626‐633. [DOI] [PubMed] [Google Scholar]
Rao 2005
- Rao R, Shammo JM, Enschede SH, Porter C, Adler SS, Venugopal P, et al. The combination of fludarabine, cyclophosphamide, and granulocyte‐macrophage colony‐stimulating factor in the treatment of patients with relapsed chronic lymphocytic leukemia and low‐grade Non‐Hodgkin's lymphoma. Clinical Lymphoma 2005;6(1):26‐30. [DOI] [PubMed] [Google Scholar]
Roskos 1998
- Roskos LK, Cheung EN, Vincent M, Foote MA. Pharmacology of filgrastim (r‐metHuG‐CSF). In: Morstyn G, Dexter TM, Foote M editor(s). Filgastim (r‐metHuG‐CSF) in Clinical Practice. 2. New York, Basel, Hong Kong: Marcel Dekker, 1998:51‐71. [Google Scholar]
Rusthoven 1998
- Rusthoven J, Bramwell V, Stephenson B. Use of granulocyte colony‐stimulating factor (G‐CSF) in patients receiving myelosuppressive chemotherapy for the treatment of cancer. Cancer Prevention and Control 1998;2(4):179‐90. [PubMed] [Google Scholar]
Skipper 1990
- Skipper HE. Dose intensity versus total dose of chemotherapy: an experimental basis. Important Advances in Oncology 1990;1(1):43‐64. [PubMed] [Google Scholar]
Sung 2007
- Sung L, Nathan PC, Alibhai SM, Tomlinson GA, Beyene J. Meta‐analysis: effect of prophylactic hematopoietic colony‐stimulating factors on mortality and outcomes of infection. Ann Intern Med 2007;147(6):400‐11. [DOI] [PubMed] [Google Scholar]
Talcott 1992
- Talcott JA, Siegel RD, Finberg R, Goldman L. Risk assessment in cancer patients with fever and neutropenia: a prospective, two‐center validation of a prediction rule. Journal of Clinical Oncology 1992;10(2):316‐22. [DOI] [PubMed] [Google Scholar]
Timmer‐Bonte 2005
- Timmer‐Bonte JN, Boo TM, Smit HJ, Biesma B, Wilschut FA, Cheragwandi SA, et al. Prevention of chemotherapy‐induced febrile neutropenia by prophylactic antibiotics plus or minus granulocyte colony‐stimulating factor in small‐cell lung cancer: a Dutch Randomized Phase III Study. Journal of clinical oncology : official journal of the American Society of Clinical Oncology 2005;23(31):7974‐84. [DOI] [PubMed] [Google Scholar]
Trillet‐Lenoir 1993
- Trillet‐Lenoir V, Green J, Manegold C, Pawel J, Gatzemeier U, Lebeau B, et al. Recombinant granulocyte colony stimulating factor reduces the infectious complications of cytotoxic chemotherapy. European Journal of Cancer 1993;29A(3):319‐24. [DOI] [PubMed] [Google Scholar]
Verhagen 1998
- Verhagen AP, DeVet HCW, DeBie RA, Kessels AGH, Boers M, Bouter LM, et al. The delphi list: A criteria list for quality assessment of randomized clinical trials for conducting systematic reviews developed by delphi consensus. Journal of Clinical Epidemiology 1998;51(12):1235‐41. [DOI] [PubMed] [Google Scholar]
Vogel 2005
- Vogel C, Rader M, Tyulandin S, Wiens B, Neumann T, Carroll R. Pegfilgrastim nearly abrogates occurrence of neutropenic events early in the course of chemotherapy: Results of a phase III, randomized, double‐blind, placebo‐controlled study of patients with breast cancer receiving docetaxel. The Journal of Supportive Oncology 2005;3(2 SUPPL. 1):58‐9. [Google Scholar]
Woll 1995
- Woll PJ, Hodgetts J, Lomax L, Bildet F, Cour‐Chabernaud V, Thatcher N. Can cytotoxic dose‐intensity be increased by using granulocyte colony‐stimulating factor? A randomized controlled trial of lenograstim in small‐cell lung cancer. Journal of Clinical Oncology 1995;13(3):652‐9. [DOI] [PubMed] [Google Scholar]
Yoshida 1990
- Yoshida T, Nakamura S, Ohtake S, Okafuji K, Kobayashi K, Kondo K, et al. Effect of granulocyte colony‐stimulating factor on neutropenia due to chemotherapy for non‐Hodgkin's lymphoma. Cancer 1990;66(9):1904‐9. [DOI] [PubMed] [Google Scholar]
References to other published versions of this review
Bohlius 2003
- Bohlius J, Reiser M, Schwarzer G, Engert A. Impact of granulocyte colony‐stimulating factor (CSF) and granulocyte‐macrophage CSF in patients with malignant lymphoma: a systematic review. British Journal of Haematology 2003;122:413‐23. [DOI] [PubMed] [Google Scholar]