Figure 2.

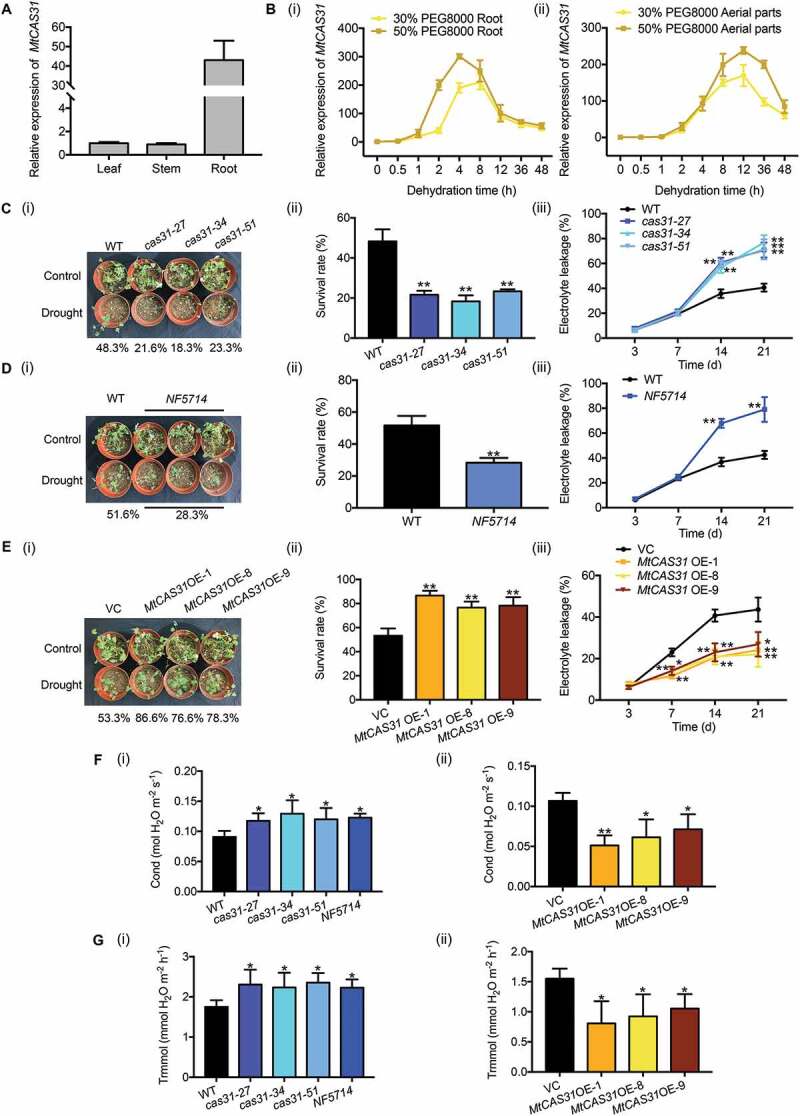
Overexpression of MtCAS31 in M. truncatula increases drought tolerance. (A) Relative expression of MtCAS31 in leaves, stems and roots of M. truncatula in the absence of stress. The values were normalized to Actin expression. The data represent the mean±SD of 3 replicates. (B) Using qRT-PCR, the relative expression of MtCAS31 under dehydration (30% and 50% PEG 8000 treatment, w:v) in roots (i) and aerial parts (ii) was determined at the indicated time points. The values were normalized to Actin expression. The data represent the mean±SD of 3 replicates. (C) Phenotypes of cas31 mutant and wild-type plants after 3 drought-rewatering cycles (i). The survival rate was scored (ii), and relative electrolyte leakage was calculated (iii). The data represent the mean±SD of 2 replicates with 15 plants each. Asterisks indicate statistically significant differences between the wild-type and cas31 mutant plants. *P < 0.05, **P < 0.01, Student’s t-test. (D) After 3 drought-rewatering cycles, photographs of the NF5714 and wild-type phenotypes were collected (i). The survival rate (ii) and relative electrolyte leakage (iii) were calculated. NF5714, the Tnt1-insertion mutant of MtCAS31. The data represent the mean±SD of 2 replicates with 15 plants each. Asterisks indicate statistically significant differences between wild-type and NF5714. *P < 0.05, **P < 0.01, Student’s t-test. (E) MtCAS31OE and VC plants were exposed to drought stress, and the phenotype (i), survival rate (ii) and relative electrolyte leakage (iii) were scored. VC, vector control. The data represent the mean±SD of 2 replicates with 15 plants each. Asterisks indicate statistically significant differences between wild-type and NF5714. *P < 0.05, **P < 0.01, Student’s t-test. (F) Stoma conductivity was measured with a photosynthesis system (LI-6400TX). (i) Wild-type, cas31 mutant, (ii) VC and MtCAS31OE plants after 3 drought-rewatering cycles. The data represent the mean±SD of 2 replicates with 15 plants each. Asterisks indicate statistically significant differences. *P < 0.05, **P < 0.01, Student’s t-test. (G) The transpiration rates of wild-type, cas31 mutant, VC and MtCAS31OE plants under 3 drought-rewatering cycles were determined with a photosynthesis system (LI-6400TX). (i) Wild-type and cas31 mutant. (ii) VC and MtCAS31OE. The data represent the mean±SD of 2 replicates with 15 plants each. Asterisks indicate statistically significant differences. *P < 0.05, **P < 0.01, Student’s t-test.
