PLOS ONE logoLink to PLOS ONE
. 2020 Apr 9;15(4):e0230415. doi: 10.1371/journal.pone.0230415

Cardiac MR segmentation based on sequence propagation by deep learning

Chao Luo 1,#, Canghong Shi 2,#, Xiaoji Li 1,#, Dongrui Gao 1,*,#
Editor: Dzung Pham3
PMCID: PMC7144953  PMID: 32271777

Abstract

Accurate segmentation of myocardial in cardiac MRI (magnetic resonance image) is key to effective rapid diagnosis and quantitative pathology analysis. However, a low-quality CMR (cardiac magnetic resonance) image with a large amount of noise makes it extremely difficult to accurately and quickly manually segment the myocardial. In this paper, we propose a method for CMR segmentation based on U-Net and combined with image sequence information. The method can effectively segment from the top slice to the bottom slice of the CMR. During training, each input slice depends on the slice below it. In other words, the predicted segmentation result depends on the existing segmentation label of the previous slice. 3D sequence information is fully utilized. Our method was validated on the ACDC dataset, which included CMR images of 100 patients (1700 2D MRI). Experimental results show that our method can segment the myocardial quickly and efficiently and is better than the current state-of-the-art methods. When evaluating 340 CMR image, our model yielded an average dice score of 85.02 ± 0.15, which is much higher than the existing classical segmentation method(Unet, Dice score = 0.78 ± 0.3).

Introduction

Heart disease has seriously threatened human health and is one of the diseases with the highest mortality rate [1] [2]. Accurate and rapid diagnosis of heart disease is very important to save lives. Cardiac Magnetic Resonance (CMR) has been widely used in the diagnosis and treatment of heart disease [3] [4]. However, manual segmentation and diagnosis are challenging due to factors such as low resolution of CMR and large interference noise of different tissue and organ parts [5]. Therefore, an automatic and accurate cardiac MRI segmentation method is highly desirable.

In recent years, a large number of methods based on deep learning have been widely used in medical image segmentation. This approach is reflected in the 2017 Automated Cardiac Diagnosis Challenge (ACDC) where the aim is to automatically perform segmentation and diagnosis on a 4D cine-CMR scan [6] [7]. In the challenge, all participants except the one participated in the deep learning method. Based on U-Net, FCN’s classic method of segmentation network was deeply explored. However, the sequence characteristics of the data set were not used in all the methods of participating in the competition. All participants’ methods are based on 2D, ignoring the 3D sequence features [8]. The 2D based method divides the CMR by each slice, and the 3D convolution based method divides the CMR as a volume. The main reason why the 2D method is popular is that it does not require an oversized data set and is very lightweight. However, the 2D method does not make full use of the 3D sequence information. The 2D method treats each slice of the CMR as a separate image and inputs it into the network, thus ignoring the 3D sequence information between the slices [9].

In addition, the performance and robustness of 3D methods are poor. Through many experiments, ACDC participants have found that the performance of 2D method is always better than that of 3D method. In fact, the 3D method has many disadvantages: 1) The 3D method will result in a reduction in the number of data sets. The 3D method is to input the CMR as an image into the network, and the 2D method is input to the network according to each slice, which increases the number of images, thereby improving the performance and generalization of the network. 2) The implementation of the 3D method relies on 3D convolution. The boundary effect of 3D convolution will cause loss of sequence information, resulting in degradation of network performance. 3) The number of parameters of the 3D method is very large, it takes a lot of GPU memory, and it takes a lot of time to wait for the training result [10].

Therefore, how to effectively combine the advantages of the 2D method and the 3D method has become our focus. One possible method is to construct a 3D convolution-based network and simultaneously input sequence information of each slice based on 2D. In Biffi et al.(2019) [11], the author proposes a network based on 3D convolution combined with 2D slice images. The input of the network is a 3D MRI, and the 2D slice sequence image corresponding to the image is input before the upsampling operation. The method can effectively combine the advantages of the 2D method and the 3D method, not only increases the number of data sets, improves the performance and generalization ability of the network, but also effectively combines the sequence information. Through several comparison experiments, the author finds that this method effectively improves the performance, robustness and generalization ability of the network. In addition, another feasible method is to construct a network based on 2D convolution and combine 3D sequence information at the same time. In Zheng et al.(2018) [12], the author proposes a method based on 2D U-Net that can make full use of the 3D sequence information, which inputs each slice image of the CMR and simultaneously samples the previous slice image of the image.

In this paper, we propose a segmentation method based on 2D convolution for cardiac MRI. Our approach has three main contributions:

  1. We propose a heart image segmentation network based on 2D method, which can effectively utilize sequence information. Our method not only can effectively increase the number of data sets, but also greatly reduces the number of parameters of the network and reduces the training time.

  2. Because our method increases the number of data sets, our method is more powerful than the 3D method, and has excellent robustness and generalization ability.

  3. Since we have adopted a 2D-based convolution method, our method makes full use of the sequence information while lowering the computational resources compared with the 3D convolution method. Our proposed method effectively overcomes the shortcomings of the 3D method.

Our proposed method was validated on the ACDC dataset. The experimental results show that our method can segment the myocardial region of the heart quickly and accurately. Compared with the classical segmentation method, our method has better performance, stronger robustness and generalization ability.

Related work

Due to the special physiological structure of the heart, there are a large number of watery cysts in the heart disease area. The pixels in the cyst area will cause the image pixels in the lesion area to drop sharply, and the gray level difference from the normal area will decrease. Therefore, precise segmentation of the heart area is very challenging.

Traditional methods

Traditional image segmentation methods mainly include threshold-based methods (histogram bimodal method, dynamic programming), pixel-based classification (clustering, Gaussian mixture model), edge-based method (Canny edge detection, Harris corner detection), based on Regional methods (watershed) and morphological-based image segmentation methods. The inherent drawbacks of the above methods themselves make it difficult to extract regions of interest directly from high noise, low contrast cardiac images. Zheng et al. proposed a machine learning-based segmentation method that extracts a set of geometric and image features and then uses a Probabilistic Enhancement Tree (PBT) to train the classifier for segmentation [13]. David et al. proposed a method based on the hidden semi-Markov model (HSMM) and support vector machine (SVM), which is used to segment the main heart sounds in the electrocardiogram (PCG) [14].

Deep learning methods

As we all know, before 2013, there was basically no deep learning method to analyze cardiac MRI. However, with the development of deep learning, in the second kaggle challenge in 2015, a large number of deep learning methods for cardiac MRI processing appeared. Most papers are based on 2D Convolutional Neural Networks (CNN) to analyze MRI data. For exmple, Duan et al. proposed a 2D-based full convolutional network [15]. This approach combines the ability to resolve 3D spatial consistency. Moreover, a refinement step is designed to explicitly impose shape prior knowledge and improve segmentation quality. This step is effective for overcoming image artifacts (e.g., due to different breath-hold positions and large slice thickness), which preclude the creation of anatomically meaningful 3D cardiac shapes. Therefore, it can effectively segment the myocardial region. In addition, Emad et al. proposed a path-based CNN to segment the CMR of the left ventricle [16]. Kong et al. proposed a method of combining 2D CNN with recurrent neural network (RNN) to identify end-diastolic and end-systolic phases [17]. Bai et al. proposed a segmentation method based on the full convolutional neural network (FCN), which is trained and verified on the largest CMR dataset, and the experimental results can reach the level of human experts [18]. Baumgartner et al. propose a method based on 2D convolutional networks and a method based on 3D convolutional networks that provided good results on the ACDC 2017 [19].

Model and loss

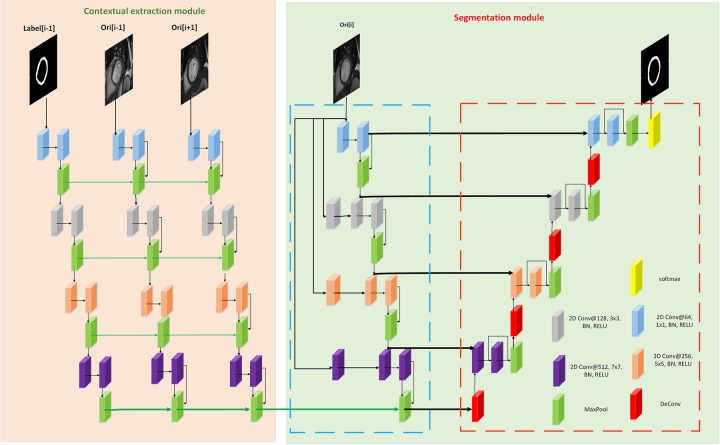
Our method mainly consists of two modules: context extraction module and segmentation module. The first part mainly extracts the context features of the image, and depends on the sequence information of the data set. The second part is the segmentation module. Inspired by U-Net, we designed a segmentation network based on the Encoder-Decoder structure. In addition, the loss function we use will be introduced in this section.

Model architecture

As shown in Fig 1, our proposed network consists of two modules: context feature extraction module and a segmentation module. As shown on the left side of Fig 1, the context feature extraction module can efficiently extract the context features implied between images.

Fig 1. Our network consists of context feature extraction module and segmentation module.

Fig 1

Context feature extraction module

There are 3 paths in the input of the context: Label[i-1] is the ground-truth of the previous slice of the input image, Ori[i-1] is the original image of the previous slice of the input image, Ori[i+1] is input an image of the next slice of the image. If Ori[i] is the first slice image in the image sequence, then Ori[i-1] is empty, and Ori[i-1] is set to null. If Ori[i] is the last slice image in the image sequence, then Ori[i+1] does not exist, and Ori[i+1] is set to null.

The main structure of the module includes convolution, BN, RELU and deep supervision. We learn the characteristics of different fields of view of the image by designing convolutions with different convolution kernel sizes. And by designing with different numbers of kernels, the contextual features of the image can be fully learned. Improve the utilization of image data and avoid feature omissions. Using the BN layer after each convolutional layer can effectively improve the network fitting speed, improve the stability of the network during the training process, and solve the gradient dispersion problem of the network in the back propagation process. RELU can improve the nonlinearity of the network and enhance the generalization ability of the network. The pooling layer can limit the memory requirements and improve the training speed of the network. In addition, the features between the layers corresponding to the three paths are merged with each other, which is more conducive to the learning of the context features between the images, and effectively avoids feature loss.

Segmentation module

Inspired by U-Net, we designed a network for image segmentation. The network contains two paths: Encoder path and Eecoder path. As shown in the right part of Fig 3, the blue dotted box is the Encoder path. The path consists of four convolutional layers of different convolution kernel sizes, each containing convolution, BN, RELU and POOL. And each layer incorporates the original image features from the first layer, which effectively avoids feature loss. The red dotted box is the Decoder path. The path consists of four upsampling layers, each of which contains one deconvolution layer, two convolutional layers, and one pooling layer. Each of the upsampling layers is fused with the features of the corresponding convolution layer in the Encoder path. The Decoder path can restore the feature size to the same size as the input image, enabling the network to perform end-to-end training, that is, inputting an image to be segmented to the network and directly output a segmented image that is the same size as the original image.

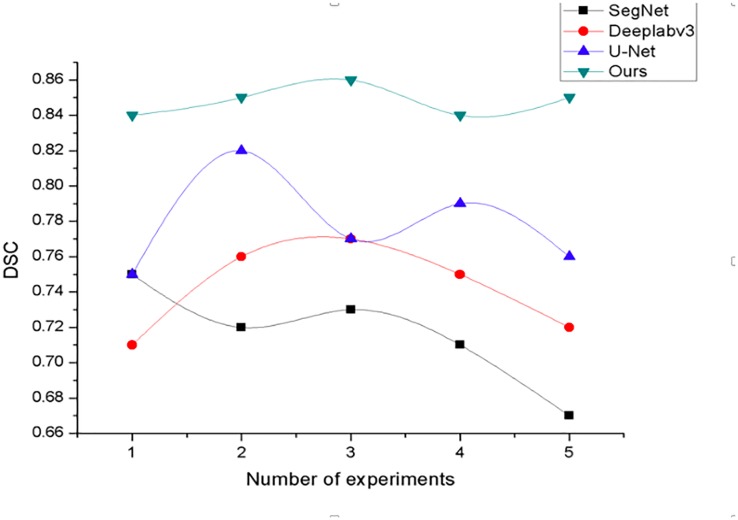
Fig 3. DSC curve change chart.

Fig 3

Loss function

The cross entropy function is mainly used to classify and segment tasks. Herein, we make use of the cross entropy as the loss function of the myocardial segmentation. Formally, it is defined as:

LossCE=-1mim[yilogpi+(1-pi)log(1-yi)] (1)

where m is the number of samples, yi is the label of the sample, and pi is the predicted probability value, pi ∈ (0, 1). Furthermore, the cross entropy loss function is put to a frequent use in classification networks. In the current paper, we employ the classification methodology for the purpose of segmenting tasks. We take into consideration the myocardial circle to be segmented as a category and the background as a category.

Experiments and discussion

Dataset and preprocessing

In this experiment, we used the data set published in the ACDC competition. To validate our method, dice similarity coefficien(DSC), area under the curve(AUC), jaccard similarity coefficient(JSC) and F1 score are used to measure the results of the segmentation.

Dataset

In the experiment of this paper, we used the myocardial data set of the ACDC competition(left ventricle, myocardium and right ventricle). The ACDC dataset was created from actual clinical examinations obtained at Dijon University Hospital, which covers several well-defined pathologies with sufficient cases:1) Proper training in machine learning methods. 2) Clearly assess changes in the main physiological parameters obtained from cine-MRI(in particular diastolic volume and ejection fraction). The corresponding database is composed by 100 patients with 3D cine-MR datasets acquired in clinical routine.

Preprocessing

Since the ACDC dataset is a 3D MRI, in order to increase the number of datasets, we made each slice of the dataset into a single 2D image with a total of 1,700 2D images. The spatial resolution of each CMR image is 1.37 × 1.68 mm and the size is between 222 × 224 and 216 × 256. Considering that the myocardium is small and there is a lot of noise around, we first resample the resolution of the image to 1 × 1 mm, and then process the size of each image to a fixed size of 128 × 128.

Evaluation metrics

We use of four indicators for the purpose of measure the performance of the network, which includes the dice similarity coefficient (DSC), area under the curve (AUC), Jaccard similarity coefficient (JSC), and F1-score for the assessment of the segmentation accuracy. The DSC was mostly employed for the calculation of the overlap metric between the results of segmentation and the ground truth. The DSC for bit vectors was defined as:

DSC=2PG2P2+G2 (2)

where PG is the element-wise product of the prediction (P) and the ground truth (G), and ∥x2 is the L2-norm of x. The AUC is a probability value. The greater the AUC value, the better the performance. The AUC score was computed with a closed-form formula:

AUC=S0-n0(n0+1)/2n0n1 (3)

where n0 is the number of pixel that belong to the ground truth, n1 is the opposite and S0=i=1n0ri, where ri is the rank given by the predict model of the ground truth to the ith pixel in the CMR image.

The F1-score is the harmonic average of precision and recall, wherein an F1-score reaches its best value at one (perfect precision and recall) and the worst at zero.

F1-score=2×Precisition×RecallPrecision+Recall (4)

The JSC is put to use for the improvement of similarities and differences between finite sample sets. The larger the JSC value, the higher the sample similarity.

JSC=|PG||P|+|G|-|PG| (5)

where P is the probability of prediction, G is the ground-truth.

Implementation details and parameter settings

In order to ensure the stability and efficiency of the experiment, we conducted several experiments to explore the optimal settings of the parameters. Finally, the optimal parameter configuration scheme we adopted is as follows.

Train strategy

To facilitate training, we use a 5-fold cross-validation method to divide the data set. Among them, 1020 MRIs were used as training sets, 340 MRIs were used as test sets, and 340 were used as verification sets. The validation set is not used for training and testing and is only used to finally verify the performance of the model.

Learning rate strategy

We conducted several trials with different learning rates, and the results showed that the learning rate of 0.001 was the most appropriate. Therefore we set the learning rate to 0.001, the initial learning rate is exponentially degraded every 10 iterations at a learning rate decay rate of 0.9.

Experiment configurations

To ensure the consistency of the experiment, we use accuracy as the quantization metric, 100 epochs are trained for each experiment (batch_size = 5). All experiments are implemented in python2.7 by using Tensorflow and Keras framework. We train the networks on a NVIDIA Tesla M40 GPU and the model that performs the best on validation data set are saved for further analysis.

Result

To verify the performance of our proposed network, we compared it to three classic segmentation methods (U-NET, Deeplabv3, and SegNet). Table 1 shows the segmentation results for each network. As can be seen from the table below, our proposed method shows the best performance. Based on the five-fold cross-validation training strategy, our method has an average DSC value of 0.8768, an average AUC value of 0.9330, an average F1-score of 0.8791, and an average JSC of 0.7924. The values of these four indicators are much higher than the other three classic segmentation methods. Compared with U-Net, the DSC value of our method is much higher than U-Net’s 0.7806, an increase of 7%. And our method’s AUC value, F1-score and JSC values are much higher than U-Net. In addition, from the comparison of the data in Table 1, it can be clearly seen that our method is much higher than DeeplabV3 and SegNet in these four indicators. Therefore, compared to U-Net, Deeplabv3 and SegNet, our method performance is far superior to the other three methods. In addition, the dice value of the context extraction module removed from our method is much lower than the dice value of this method.

Table 1. Experimental results of 5 different networks.

The table shows the average of the four indicators. Ours-no-cem means to remove the context extraction module in our proposed method.

Model DSC DSC(std) AUC F1-score JSC
SegNet 0.7211 0.08 0.7509 0.7673 0.5693
Deeplabv3 0.7563 0.13 0.8246 0.7315 0.6383
U-Net 0.7806 0.06 0.8845 0.7821 0.6792
Ours-no-cem 0.8009 0.05 0.8513 0.8455 0.7738
Ours 0.8768 0.02 0.9330 0.8791 0.7924

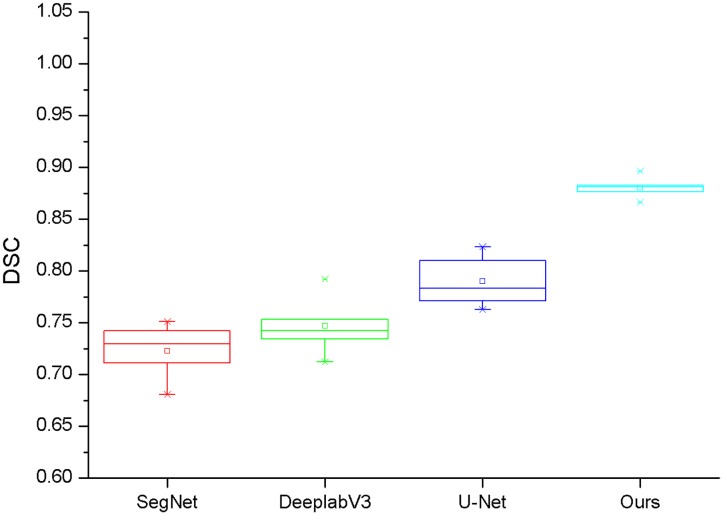
Fig 2 shows a block diagram of the DSC values for the four networks. As can be seen from the figure, the span of ours method’s block diagram is small, and the DSC values of the five experiments are mainly concentrated around 0.87. However, the span of U-Net, SegNet and Deeplabv3 is much larger than our approach. Therefore, it is clear that our method not only performs better than the other three methods but is more stable and robust.

Fig 2. Box diagram of DSC for four different networks.

Fig 2

Each network performs 5 experiments, and the box plot was drawn based on the DSC value of each experimental result.

Fig 3 show dice indicator curve changes for four different methods. In this experiment, experiments were carried out on four networks using a 5-fold cross-validation experimental method, and the results of each experiment were recorded and plotted. As shown in Fig 3, the DSC value of each of our methods is higher than that of the other three networks, and the fluctuation range is the smallest. It can be seen that our method not only has good segmentation performance, but also has better stability and robustness.

Based on the comparison of the dice indicators and analysis, we propose that the proposed method has good myocardial segmentation performance and can accurately and quickly segment the muscle region of the heart. Compared with the three classic segmentation methods of DeeplabV3, U-Net and SegNet, our method has far more performance than the three methods in myocardial segmentation tasks, and has good stability and robustness.

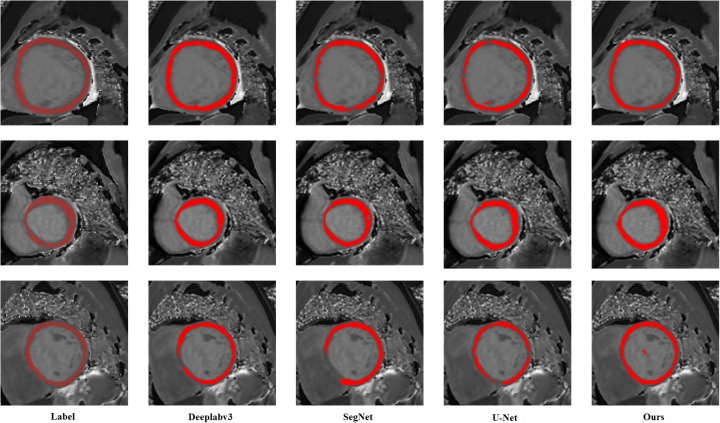
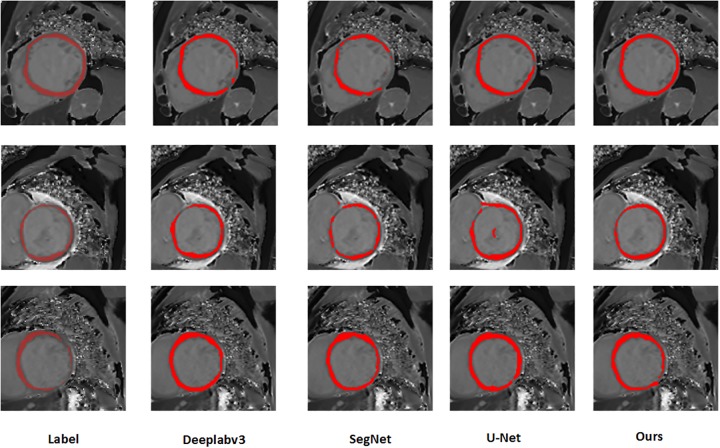
It can be clearly seen from Fig 4 that our method can effectively and accurately segment the myocardial region. In the first row comparison chart in Fig 4, compared with the manually label, SegNet segmentation effect is very poor, 1/3 of the region is not correctly segmented, DeeplabV3 does not completely segment the myocardial region, U-Net There is also no complete correct segmentation of the myocardium, and our method is able to accurately and completely segment the myocardium. Similarly, we can compare the results of the second and third row segmentation. SegNet, DeeplabV3 and U-Net can not accurately segment the myocardial region, and it will produce interference noise, which will affect the doctor’s diagnosis. Our method is able to accurately and completely segment the smooth myocardium without disturbing noise, which is closer to the label image.

Fig 4. Segmentation results of three different samples in different networks.

Fig 4

In addition, in order to verify the robustness of our proposed method, we performed experiments on cardiac MRI images of 150 patients provided by West China Hospital of Sichuan University. We converted 3D MRI from 150 patients to 1350 available 2D MRI. The experiment was completed using a 5-fold cross-validation data partitioning strategy. Among them, 810 cases served as the training set, 270 cases served as the test set, and 270 cases served as the verification set. Fig 5 shows our results. From the Fig 5, our method can also accurately and effectively segment the myocardial region.

Fig 5. Segmentation results of three different samples in different networks with the data of West China Hospital of Sichuan University.

Fig 5

Table 2 shows the results of our method and comparison method in the data set of West China Hospital of Sichuan University. From the table, we can know that our method is higher than the comparison method in all indicators.

Table 2. The experimental results in the data set of West China Hospital of Sichuan University.

Model DSC DSC(std) AUC F1-score JSC
SegNet 0.7362 0.07 0.78233 0.8321 0.6315
Deeplabv3 0.7746 0.08 0.8560 0.7613 0.6859
U-Net 0.8034 0.04 0.8742 0.8124 0.7386
Ours 0.8923 0.02 0.9510 0.93145 0.8378

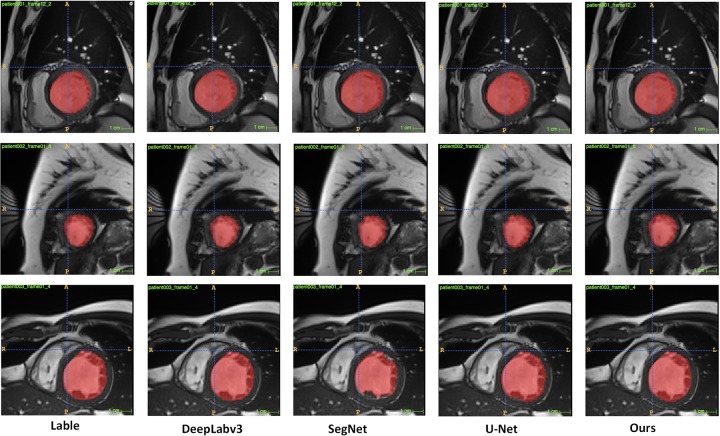
In addition, to further verify the robustness of our proposed method. We performed experiments on the left ventricle dataset and the right ventricle dataset (ACDC). From the results in Table 3, we can know that our proposed method has excellent performance on the left ventricular data set, and the four indicators are much higher than the other four comparison methods. From Fig 6, we can visually see that the segmentation effect of our method is better.

Table 3. Index results of segmentation in the left ventricle.

Model DSC DSC(std) AUC F1-score JSC
SegNet 0.7585 0.07 0.8053 0.84867 0.6834
Deeplabv3 0.7865 0.09 0.8368 0.7062 0.7112
U-Net 0.8335 0.05 0.8246 0.8523 0.7709
Ours 0.9035 0.03 0.9123 0.8911 0.8463

Fig 6. Segmentation effect in the left ventricle.

Fig 6

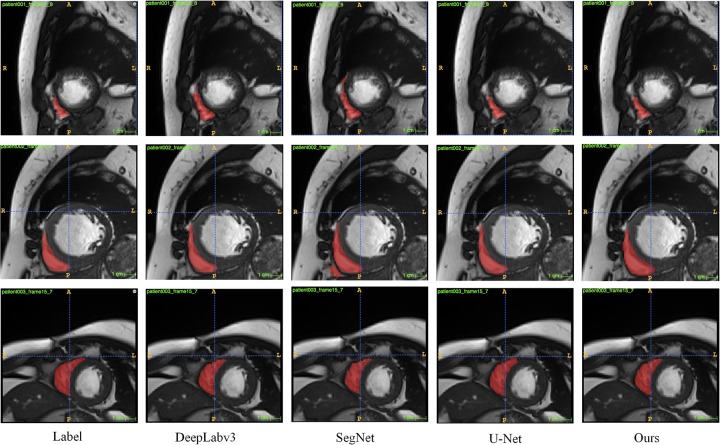
Table 4 is the result of right ventricle segmentation of our method. From the comparison of the indicators in the table, we can know that the dice value of our method in the right ventricle segmentation is 0.93, which is far more than the other three segmentation methods. Fig 7 is an example of right ventricle segmentation. We can visually see that the right ventricle segmented by our method is closer to the label and smoother.

Table 4. Index results of segmentation in the right ventricle.

Model DSC DSC(std) AUC F1-score JSC
SegNet 0.7761 0.05 0.8262 0.8522 0.7159
Deeplabv3 0.8003 0.06 0.8491 0.7558 0.7624
U-Net 0.8522 0.03 0.8694 0.8722 0.8104
Ours 0.9353 0.01 0.8921 0.9134 0.8787

Fig 7. Segmentation effect in the right ventricle.

Fig 7

Conclusion

In this paper, we propose a network for image segmentation with sequence propagation features. The method mainly includes two modules: contextual extraction module and segmentation module. The context extraction module can fully extract the context features of the image to be segmented, and effectively combines the sequence features. The segmentation module is an encoder-decoder module, and inputting an image can directly predict a segmented image. The module effectively learns the characteristics of the original image and avoids feature loss and gradient dispersion by the design of the jump connection. To prove the validity of our proposed method, we compared it to SegNet, DeeplabV3 and U-Net. The experimental results show that our network can accurately and quickly segment the myocardial region of the heart. Compared with the other three classical segmentation networks, our network segmentation performance is better and more robust. The network is also suitable for the segmentation tasks of other medical images. In future research, we will use this network to accomplish different medical image segmentation tasks.

Data Availability

All datasets files are available from the ACDC Challenge database (https://www.creatis.insa-lyon.fr/Challenge/acdc/databases.html). The authors did not receive special access privileges to the data. Heart Data Set of West China Hospital of Sichuan University, is available from figshare: (https://figshare.com/s/70021f845c4dc2a6e86d).

Funding Statement

This work was supported by the National Natural Science Foundation of China (61602066), the Project of Sichuan Outstanding Young Scientific and Technological Talents (19JCQN0003), the major Project of Education Department in Sichuan (17ZA0063 and 2017JQ0030), and in part by the Natural Science Foundation for Young Scientists of CUIT (J201704) and the Sichuan Science and Technology Program (2019JDRC0077).

References

  • 1. Bruthans Jan and Cífková Renata and Lánská Vera and O’Flaherty Martin and Critchley Julia A and Holub Jirí and Jansky Petr and Zvárová Jana and Capewell Simon. Explaining the decline in coronary heart disease mortality in the Czech Republic between 1985 and 2007. European Journal of Preventive Cardiology. 2012;7(21):829–839. [DOI] [PubMed] [Google Scholar]
  • 2. Kunnas Tarja and Solakivi Tiina and Renko Jaana and Kalela Anne and Nikkari Seppo T. Late-life coronary heart disease mortality of Finnish war veterans in the TAMRISK study, a 28-year follow-up. Bmc Public Health. 2011;1(11):1–6. [DOI] [PMC free article] [PubMed] [Google Scholar]
  • 3. Kramer Christopher M and Jorg Barkhausen and Flamm Scott D and Kim Raymond J and Eike Nagel. Standardized cardiovascular magnetic resonance imaging (CMR) protocols, society for cardiovascular magnetic resonance: board of trustees task force on standardized protocols. Journal of Cardiovascular Magnetic Resonance Official Journal of the Society for Cardiovascular Magnetic Resonance. 2008;1(10):35–35. 10.1186/1532-429X-10-35 [DOI] [PMC free article] [PubMed] [Google Scholar]
  • 4. Roy Christopher W. and Seed Mike and Kingdom John C. and Macgowan Christopher K. Motion compensated cine CMR of the fetal heart using radial undersampling and compressed sensing. Journal of Cardiovascular Magnetic Resonance. 2017;1(19):29 10.1186/s12968-017-0346-6 [DOI] [PMC free article] [PubMed] [Google Scholar]
  • 5. Lieman-Sifry Jesse and Le Matthieu and Lau Felix and Sall Sean and Golden Daniel. FastVentricle: Cardiac Segmentation with ENet.; 2017. [Google Scholar]
  • 6. Wolterink Jelmer M. and Leiner Tim and Viergever Max A. and Išgum Ivana. Automatic Segmentation and Disease Classification Using Cardiac Cine MR Images.; 2017. [Google Scholar]
  • 7. Mortazi Aliasghar and Bagci Ulas. Automatically Designing CNN Architectures for Medical Image Segmentation.; 2018. [Google Scholar]
  • 8. Li Wei and Liu Wei and Zhong Jia and Yu Xin. Early manifestation of alteration in cardiac function in dystrophin deficient mdx mouse using 3D CMR tagging. Journal of Cardiovascular Magnetic Resonance. 2009;1(11):40–40. 10.1186/1532-429X-11-40 [DOI] [PMC free article] [PubMed] [Google Scholar]
  • 9. Dou Q. and Yu L. and Chen H. and Jin Y. and Yang X. and Qin J. and Heng P. A. 3D deeply supervised network for automated segmentation of volumetric medical images. Medical Image Analysis. 2017;41:40 10.1016/j.media.2017.05.001 [DOI] [PubMed] [Google Scholar]
  • 10. Hudej Robert and Van Der Heide Uulke A. The Physics of CT and MR Imaging.; 2011. [Google Scholar]
  • 11. Biffi Carlo and Cerrolaza Juan J and Tarroni Giacomo and de Marvao Antonio and Cook Stuart A and O’Regan Declan P, et al. 3D High-Resolution Cardiac Segmentation Reconstruction from 2D Views using Conditional Variational Autoencoders.; 2019. [Google Scholar]
  • 12. Zheng Qiao and Delingette Hervé and Duchateau Nicolas and Ayache Nicholas. 3-D Consistent and Robust Segmentation of Cardiac Images by Deep Learning With Spatial Propagation. IEEE transactions on medical imaging. 2018;9(37):2137–2148. 10.1109/TMI.2018.2820742 [DOI] [PubMed] [Google Scholar]
  • 13. Zheng Yefeng and Loziczonek Maciej and Georgescu Bogdan and Zhou S Kevin and Vega-Higuera Fernando and Comaniciu Dorin. Machine learning based vesselness measurement for coronary artery segmentation in cardiac CT volumes. Medical Imaging 2011: Image Processing. 2011;79621K:7962. [Google Scholar]
  • 14. Springer David B and Tarassenko Lionel and Clifford Gari D. Support vector machine hidden semi-markov model-based heart sound segmentation. Computing in Cardiology 2014. 2014;626–628. [Google Scholar]
  • 15. Duan Jinming and Bello Ghalib and Schlemper Jo and Bai Wenjia and Dawes Timothy JW and Biffi Carlo, et al. Automatic 3D bi-ventricular segmentation of cardiac images by a shape-refined multi-task deep learning approach. IEEE transactions on medical imaging. 2019. 10.1109/TMI.2019.2894322 [DOI] [PMC free article] [PubMed] [Google Scholar]
  • 16.Emad, Omar and Yassine, Inas A and Fahmy, Ahmed S. Automatic localization of the left ventricle in cardiac MRI images using deep learning. 2015 37th Annual International Conference of the IEEE Engineering in Medicine and Biology Society (EMBC). 2015;683–686. [DOI] [PubMed]
  • 17. Kong Bin and Zhan Yiqiang and Shin Min and Denny Thomas and Zhang Shaoting. Recognizing end-diastole and end-systole frames via deep temporal regression network. International conference on medical image computing and computer-assisted intervention. 2016;264–272. [Google Scholar]
  • 18. Bai Wenjia and Sinclair Matthew and Tarroni Giacomo and Oktay Ozan and Rajchl Martin and Vaillant Ghislain, et al. Human-level CMR image analysis with deep fully convolutional networks.; 2017. [Google Scholar]
  • 19. Baumgartner Christian F and Koch Lisa M and Pollefeys Marc and Konukoglu Ender. An exploration of 2D and 3D deep learning techniques for cardiac MR image segmentation. International Workshop on Statistical Atlases and Computational Models of the Heart. 2017;111–119. [Google Scholar]

Decision Letter 0

Dzung Pham

30 Aug 2019

PONE-D-19-18130

Cardiac MR Segmentation Based on Sequence Propagation by Deep Learning

PLOS ONE

Dear Dr. Gao,

Thank you for submitting your manuscript to PLOS ONE. After careful consideration, we feel that it has merit but does not fully meet PLOS ONE’s publication criteria as it currently stands. Therefore, we invite you to submit a revised version of the manuscript that addresses the points raised during the review process.  In particular, both reviewers raised major concerns about reviewing similar methods in the literature, and providing a more rigorous comparison of the proposed method to previous approaches.  In addition, the source code for the proposed algorithm should be made available on a public repository, in accordance with PLOS ONE's policy on Materials and Software Sharing

We would appreciate receiving your revised manuscript by Oct 14 2019 11:59PM. When you are ready to submit your revision, log on to https://www.editorialmanager.com/pone/ and select the 'Submissions Needing Revision' folder to locate your manuscript file.

If you would like to make changes to your financial disclosure, please include your updated statement in your cover letter.

To enhance the reproducibility of your results, we recommend that if applicable you deposit your laboratory protocols in protocols.io, where a protocol can be assigned its own identifier (DOI) such that it can be cited independently in the future. For instructions see: http://journals.plos.org/plosone/s/submission-guidelines#loc-laboratory-protocols

Please include the following items when submitting your revised manuscript:

  • A rebuttal letter that responds to each point raised by the academic editor and reviewer(s). This letter should be uploaded as separate file and labeled 'Response to Reviewers'.

  • A marked-up copy of your manuscript that highlights changes made to the original version. This file should be uploaded as separate file and labeled 'Revised Manuscript with Track Changes'.

  • An unmarked version of your revised paper without tracked changes. This file should be uploaded as separate file and labeled 'Manuscript'.

Please note while forming your response, if your article is accepted, you may have the opportunity to make the peer review history publicly available. The record will include editor decision letters (with reviews) and your responses to reviewer comments. If eligible, we will contact you to opt in or out.

We look forward to receiving your revised manuscript.

Kind regards,

Dzung Pham

Academic Editor

PLOS ONE

Journal Requirements:

1. When submitting your revision, we need you to address these additional requirements.

Please ensure that your manuscript meets PLOS ONE's style requirements, including those for file naming. The PLOS ONE style templates can be found at

http://www.journals.plos.org/plosone/s/file?id=wjVg/PLOSOne_formatting_sample_main_body.pdf and http://www.journals.plos.org/plosone/s/file?id=ba62/PLOSOne_formatting_sample_title_authors_affiliations.pdf

[Note: HTML markup is below. Please do not edit.]

Reviewers' comments:

Reviewer's Responses to Questions

Comments to the Author

1. Is the manuscript technically sound, and do the data support the conclusions?

The manuscript must describe a technically sound piece of scientific research with data that supports the conclusions. Experiments must have been conducted rigorously, with appropriate controls, replication, and sample sizes. The conclusions must be drawn appropriately based on the data presented.

Reviewer #1: Yes

Reviewer #2: Partly

**********

2. Has the statistical analysis been performed appropriately and rigorously?

Reviewer #1: No

Reviewer #2: No

**********

3. Have the authors made all data underlying the findings in their manuscript fully available?

The PLOS Data policy requires authors to make all data underlying the findings described in their manuscript fully available without restriction, with rare exception (please refer to the Data Availability Statement in the manuscript PDF file). The data should be provided as part of the manuscript or its supporting information, or deposited to a public repository. For example, in addition to summary statistics, the data points behind means, medians and variance measures should be available. If there are restrictions on publicly sharing data—e.g. participant privacy or use of data from a third party—those must be specified.

Reviewer #1: Yes

Reviewer #2: Yes

**********

4. Is the manuscript presented in an intelligible fashion and written in standard English?

PLOS ONE does not copyedit accepted manuscripts, so the language in submitted articles must be clear, correct, and unambiguous. Any typographical or grammatical errors should be corrected at revision, so please note any specific errors here.

Reviewer #1: Yes

Reviewer #2: Yes

**********

5. Review Comments to the Author

Please use the space provided to explain your answers to the questions above. You may also include additional comments for the author, including concerns about dual publication, research ethics, or publication ethics. (Please upload your review as an attachment if it exceeds 20,000 characters)

Reviewer #1: Chao et al proposed a sequence propagation-based U-net method for cardiac image segmentation. The method can effectively segment from the top slice to the bottom slice of the CMR Image. Each input slice depends on previous slice in the training process. Therefore, the predicted segmentation result will be conditioned on the existing segmentation labels, which effectively propagates adjacent information. The method is interesting and promising. However, there are problems in the paper.

1: The literature review is not thorough (IMPROTANT). There are lots of related work that have not been mentioned in this paper. For example, the following works were all focusing on cardiac segmentation.

Duan, J., Bello, G., Schlemper, J., Bai, W., Dawes, T.J., Biffi, C., de Marvao, A., Doumou, G., O’Regan, D.P. and Rueckert, D., 2019. Automatic 3D bi-ventricular segmentation of cardiac images by a shape-refined multi-task deep learning approach. IEEE T. Med. Imaging, 2019.

O. Bernard, A. Lalande, C. Zotti, et al., “Deep learning techniques for automatic mri cardiac multi-structures segmentation and diagnosis: Is the problem solved?,” IEEE T. Med. Imaging, 2018.

W. Bai, M. Sinclair, G. Tarroni, O. Oktay, M. Rajchl, G. Vaillant, A. Lee, N. Aung, E. Lukaschuk, M. Sanghvi, et al., “Human-level cmr image analysis with deep fully convolutional networks,” J. Cardiov. Magn. Reson., 2018.

C. Baumgartner, L. Koch, M. Pollefeys, and E. Konukoglu, “An exploration of 2d and 3d deep learning techniques for cardiac mr image segmentation,” ArXiv Preprint ArXiv:1709.04496, 2017.

J. Patravali, S. Jain, and S. Chilamkurthy, “2d-3d fully convolutional neural networks for cardiac mr segmentation,” ArXiv Preprint ArXiv:1707.09813, 2017.

H. Winther, C. Hundt, B. Schmidt, C. Czerner, J. Bauersachs, F. Wacker, and J. Vogel, “V-net: Deep learning for generalized biventricular cardiac mass and function parameters,” ArXiv Preprint ArXiv:1706.04397, 2017.

Duan, J., Schlemper, J., Bai, W., Dawes, T.J., Bello, G., Doumou, G., De Marvao, A., O’Regan, D.P. and Rueckert, D., 2018, September. Deep nested level sets: Fully automated segmentation of cardiac MR images in patients with pulmonary hypertension. In MICCAI (pp. 595-603). Springer, Cham, 2018.

2. Please discuss the difference in detail between your method and the one in reference [12]

3. In your first contribution, you mentioned segmentation of a heart, which includes RV, LV and Myocardium. However, in experiments, only myocardium is segmented, why? Can you method segment all anatomies? If so please conduct experiments.

4. Only one dataset (ACDC) was used. I would like to see experiments on different datasets, such as Sunnybrook cardiac data and 2011 LV segmentation challenge.

http://www.cardiacatlas.org/challenges/lv-segmentation-challenge/

http://www.cardiacatlas.org/studies/sunnybrook-cardiac-data/

5. How accurate is the method in terms of extracting clinical associated measures, such as stroke volume, and cardiac output, ejection fraction, etc. How about the segmentation accuracy for apical and basal slices. I would like to see both quantitative and quality results on these.

6. In experiments, I would like to see the quantitative measures based on Hausdorff distance and mean contour distance.

Reviewer #2: This works proposes new deep learning approach for Cardiac MR Segmentation based on the classical U-Net architecture (2D convolutions) where the sequence information is integrated. Also, the authors claims that the proposed method is better than the current state-of-the-art-methods. The proposed method is in general technically correct and seems to provide good results in the evaluated dataset. However, I have some concerns about the novelty of this approach. The most severe flaw of the manuscript is the lack of an 'honest' comparison with other segmentation strategies in the literature.

Additional comments:

1) The authors claims that the proposed method is better than the current state-of-the-art-methods. The authors are suggested to include a small revision of the literature and compare their results with the bibliography (include the number of patients used for validation for each method). For instance, in [1], [2] or [3] the authors achieve similar dice's values as the one proposed in this paper. Moreover, most of the methods described in [4] achieve a dice values for myocardial tissue classification greater than 0.85.

2) The architecture described in this work is in some way similar to others approaches proposed in the literature exactly in the same context as this paper. For example, in [3] the authors propose a way to introduce contextual information into the NN. And in [1] the authors studied the effects of introducing the original information into the encode path of the u-net. Can the authors discuss the differences between those approaches and the one proposed?

3) Did the authors consider using the Dice coefficient or Jaccard as the objective function, instead of the cross entropy ? And why?

4) Given that little training data is available, why are the authors not using data augmentation ?

5) The paper should describe precisely how the dataset were selected for training, validation and testing.

5.a) Were the dataset split by patients or slices ?

5.b) How many images were used for validation (i.e. training the hyperparameters) ?

5.c) Was the validation dataset the same as the one used for testing or training ?

6) Remove or translate the comment to english in Fig. 9

7) First sentence of the 4 paragraph (line 280) is not clear, it should be rewritten.

8) The authors are suggested to include a new plot with the dice accuracy for each epoch (mean value of the 5-fold cross validation over validation dataset) for the architectures studied.

Minors comments:

-) There are some typos, for example, missing dot in line 290.

-) The block diagram shows in Fig. 5 is commonly named boxplot.

-) For non-image content I strongly recommend to use vectorized formats such as pdf or eps.

[1] A. H. Curiale, F. D. Colavecchia, and G. Mato, “Automatic quantification of the lv function and mass: A deep learning approach for cardiovascular mri,” Computer Methods and Programs in Biomedicine, vol. 169, pp. 37 – 50, 2019.

[2] L. K. Tan, R. A. McLaughlin, E. Lim, Y. F. Abdul Aziz, and Y. M. Liew, “Fully automated segmentation of the left ventricle in cine cardiac mri using neural network regression,” Journal of Magnetic Resonance Imaging, vol. 48, no. 1, pp. 140–152, 2018.

[3] Q. Zheng, H. Delingette, N. Duchateau, and N. Ayache, “3d consistent & robust segmentation of cardiac images by deep learning with spatial propagation,” IEEE Transactions on Medical Imaging, 04 2018.

[4] O. Bernard, A. Lalande, C. Zotti, F. Cervenansky, X. Yang, P. Heng, I. Cetin, K. Lekadir, O. Camara, M. A. Gonzalez Ballester, G. Sanroma, S. Napel, S. Petersen, G. Tziritas, E. Grinias, M. Khened, V. A. Kollerathu, G. Krishnamurthi, M. Roh ´e, X. Pennec, M. Sermesant, F. Isensee, P. J ¨ager, K. H. Maier-Hein, P. M. Full, I. Wolf, S. Engelhardt, C. F. Baumgartner, L. M. Koch, J. M. Wolterink, I. Iˇsgum, Y. Jang, Y. Hong, J. Patravali, S. Jain, O. Humbert, and P. Jodoin, “Deep learning techniques for automatic mri cardiac multi-structures segmentation and diagnosis: Is the problem solved?,” IEEE Transactions on Medical Imaging, vol. 37, pp. 2514–2525, Nov. 2018.

**********

6. PLOS authors have the option to publish the peer review history of their article (what does this mean?). If published, this will include your full peer review and any attached files.

If you choose “no”, your identity will remain anonymous but your review may still be made public.

Do you want your identity to be public for this peer review? For information about this choice, including consent withdrawal, please see our Privacy Policy.

Reviewer #1: Yes: Jinming Duan

Reviewer #2: No

[NOTE: If reviewer comments were submitted as an attachment file, they will be attached to this email and accessible via the submission site. Please log into your account, locate the manuscript record, and check for the action link "View Attachments". If this link does not appear, there are no attachment files to be viewed.]

While revising your submission, please upload your figure files to the Preflight Analysis and Conversion Engine (PACE) digital diagnostic tool, https://pacev2.apexcovantage.com/. PACE helps ensure that figures meet PLOS requirements. To use PACE, you must first register as a user. Registration is free. Then, login and navigate to the UPLOAD tab, where you will find detailed instructions on how to use the tool. If you encounter any issues or have any questions when using PACE, please email us at figures@plos.org. Please note that Supporting Information files do not need this step.

PLoS One. 2020 Apr 9;15(4):e0230415. doi: 10.1371/journal.pone.0230415.r002

Author response to Decision Letter 0


6 Oct 2019

Reviewer 1:

1: The literature review is not thorough (IMPROTANT). There are lots of related work that have not been mentioned in this paper. For example, the following works were all focusing on cardiac segmentation.

Answer: The relevant part has been revised in the paper.

2. Please discuss the difference in detail between your method and the one in reference [12]

Answer: 1. We use the dice function as a loss function. 2. In addition to adding the ori[i-1] and label[i-1] branches, the ori[i+1] branch is added. 3. We used all the slices of each 3D image.

3. In your first contribution, you mentioned segmentation of a heart, which includes RV, LV and Myocardium. However, in experiments, only myocardium is segmented, why? Can you method segment all anatomies? If so please conduct experiments.

Answer: This method also has a good effect on the segmentation of LV and RV (we conducted experiments on the dataset of West China Medical College, Sichuan University). However, our ACDC dataset does not have split labels for LV and RV, so experiments cannot be performed.

4. Only one dataset (ACDC) was used. I would like to see experiments on different datasets, such as Sunnybrook cardiac data and 2011 LV segmentation challenge.

Answer: I did not successfully get these two data sets. However, I conducted an experiment on the heart data set provided by West China Hospital of Sichuan University. The results of this experiment have been reflected in the paper.

Reviewer 2:

The architecture described in this work is in some way similar to others approaches proposed in the literature exactly in the same context as this paper. For example, in [3] the authors propose a way to introduce contextual information into the NN. And in [1] the authors studied the effects of introducing the original information into the encode path of the u-net. Can the authors discuss the differences between those approaches and the one proposed?

Answer: Our approach combines the contextual sequence information of the image with the appropriate loss function and training strategy.

Did the authors consider using the Dice coefficient or Jaccard as the objective function, instead of the cross entropy ? And why?

Answer: I tried using the dice function as a loss function, but the effect is not as good as cross entropy, so I don't use the dice function.

Given that little training data is available, why are the authors not using data augmentation ?

Answer: Considering the fact that the heart data itself is relatively noisy and the contrast between the target area and surrounding tissue is small, no data enhancement method is used.

5 The paper should describe precisely how the dataset were selected for training, validation and testing.

5.a) Were the dataset split by patients or slices ?

5.b) How many images were used for validation (i.e. training the hyperparameters) ?

5.c) Was the validation dataset the same as the one used for testing or training ?

Answer: It has been explained clearly in the article.

6. Remove or translate the comment to english in Fig. 9

Answer:It has been modified

7. First sentence of the 4 paragraph (line 280) is not clear, it should be rewritten.

Answer:It has been modified

Attachment

Submitted filename: Response to Reviewers.docx

Decision Letter 1

Dzung Pham

28 Oct 2019

PONE-D-19-18130R1

Cardiac MR Segmentation Based on Sequence Propagation by Deep Learning

PLOS ONE

Dear Dr. Gao,

Thank you for submitting your manuscript to PLOS ONE. After careful consideration, we feel that it has merit but does not fully meet PLOS ONE’s publication criteria as it currently stands. Therefore, we invite you to submit a revised version of the manuscript that addresses the points raised during the review process.  In particular, the reviewers cite a number of additional results that should be added to the analysis, and also point out several corrections.  Furthermore, the manuscript is currently not in compliance with PLOS ONE's policy on data and software sharing.  It was noted by Reviewer 3, that some of the data used in the manuscript has not been made publicly available.  Please also clearly indicate where source code implementing the proposed algorithm has been made available.  For more information, see the Data Availability policy and the Materials and Software Sharing policy.

We would appreciate receiving your revised manuscript by Dec 12 2019 11:59PM. When you are ready to submit your revision, log on to https://www.editorialmanager.com/pone/ and select the 'Submissions Needing Revision' folder to locate your manuscript file.

If you would like to make changes to your financial disclosure, please include your updated statement in your cover letter.

To enhance the reproducibility of your results, we recommend that if applicable you deposit your laboratory protocols in protocols.io, where a protocol can be assigned its own identifier (DOI) such that it can be cited independently in the future. For instructions see: http://journals.plos.org/plosone/s/submission-guidelines#loc-laboratory-protocols

Please include the following items when submitting your revised manuscript:

  • A rebuttal letter that responds to each point raised by the academic editor and reviewer(s). This letter should be uploaded as separate file and labeled 'Response to Reviewers'.

  • A marked-up copy of your manuscript that highlights changes made to the original version. This file should be uploaded as separate file and labeled 'Revised Manuscript with Track Changes'.

  • An unmarked version of your revised paper without tracked changes. This file should be uploaded as separate file and labeled 'Manuscript'.

Please note while forming your response, if your article is accepted, you may have the opportunity to make the peer review history publicly available. The record will include editor decision letters (with reviews) and your responses to reviewer comments. If eligible, we will contact you to opt in or out.

We look forward to receiving your revised manuscript.

Kind regards,

Dzung Pham

Academic Editor

PLOS ONE

[Note: HTML markup is below. Please do not edit.]

Reviewers' comments:

Reviewer's Responses to Questions

Comments to the Author

1. If the authors have adequately addressed your comments raised in a previous round of review and you feel that this manuscript is now acceptable for publication, you may indicate that here to bypass the “Comments to the Author” section, enter your conflict of interest statement in the “Confidential to Editor” section, and submit your "Accept" recommendation.

Reviewer #1: (No Response)

Reviewer #3: (No Response)

**********

2. Is the manuscript technically sound, and do the data support the conclusions?

The manuscript must describe a technically sound piece of scientific research with data that supports the conclusions. Experiments must have been conducted rigorously, with appropriate controls, replication, and sample sizes. The conclusions must be drawn appropriately based on the data presented.

Reviewer #1: Partly

Reviewer #3: Partly

**********

3. Has the statistical analysis been performed appropriately and rigorously?

Reviewer #1: Yes

Reviewer #3: No

**********

4. Have the authors made all data underlying the findings in their manuscript fully available?

The PLOS Data policy requires authors to make all data underlying the findings described in their manuscript fully available without restriction, with rare exception (please refer to the Data Availability Statement in the manuscript PDF file). The data should be provided as part of the manuscript or its supporting information, or deposited to a public repository. For example, in addition to summary statistics, the data points behind means, medians and variance measures should be available. If there are restrictions on publicly sharing data—e.g. participant privacy or use of data from a third party—those must be specified.

Reviewer #1: Yes

Reviewer #3: No

**********

5. Is the manuscript presented in an intelligible fashion and written in standard English?

PLOS ONE does not copyedit accepted manuscripts, so the language in submitted articles must be clear, correct, and unambiguous. Any typographical or grammatical errors should be corrected at revision, so please note any specific errors here.

Reviewer #1: Yes

Reviewer #3: No

**********

6. Review Comments to the Author

Please use the space provided to explain your answers to the questions above. You may also include additional comments for the author, including concerns about dual publication, research ethics, or publication ethics. (Please upload your review as an attachment if it exceeds 20,000 characters)

Reviewer #1: I would like to see the segmentation performance of the proposed method on three anatomies, i.e. RV, LV and myocardium. At the moment, only myocardiumis shown. Please conduct more experiments.

Reviewer #3: Review summary:

The authors propose an encoder-decoder architecture to perform the automatic segmentation of the myocardium in cardiac MR 3D images. Their approach is based on the work of (Zheng et al, TMI 2018) which was dedicated to the integration of volume information in 2D segmentation convolutional neural networks. Though the proposed network contains very limited innovation on methodology compared to the original paper (addition of one branch containing the next image to segment), the improvement on the geometrical segmentation scores compared to the baseline is significant and supports the interest of the designed model for this particular task. It is therefore our belief that the study has merits and is of interest for the journal.

However, the paper fails to address several key requirements for publication in the PLOS journal:

- on the performed evaluation, which is incomplete and unfair to the state-of-the-art (I)

- on the conducted experiments (II)

- on the data, not fully available (III)

- on the drawn conclusions (IV)

We also noted:

- two misunderstandings on the theory of deep learning (V)

- several errors in the writing, with sentence repetitions and numerous grammar errors (VI)

- little effort in the response to the reviewers during the first round of modifications, on key aspects of the questions (VII)

---

The details of each aspect is presented here under.

I) Evaluation

The authors did a good job in performing cross-validation of several models on a complementary set of metrics and on two datasets. However, the authors do not directly compare to the results already published on the ACDC dataset (https://www.creatis.insa-lyon.fr/Challenge/acdc/). In particular :

- a different set of metrics is used (Dice, area under curve, F1 score, and JSC) instead of Dice and HD. The formulas are given for half of them (please give all or none). This choice of metrics is not argued, even though most of the metrics used are more relevant to evaluate classification than segmentation.

- from the description it appears the metrics were applied on 2D slices instead of the volumes, which is not suitable for a 3D problem, especially considering that the authors propose a 3D approach of the problem.

- when looking at results from the other teams in 2017, published in (https://www.creatis.insa-lyon.fr/Challenge/acdc/files/tmi_2018_bernard.pdf), it appears that the winner of the challenge obtained better results on the myocardium than those presented in the paper with regard to the only shared metric (average dice of 0.91 against 0.88 in the proposed paper). Also, it is untrue that no 3D method was proposed.

- only one structure is segmented, which is unfortunate considering that the ACDC dataset proposes annotations for three (left ventricle, myocardium, and right ventricle) and that the method is generic.

- only the average performance is given. We argue standard deviations are equally important to represent the robustness of a segmentation model.

- No scores are given for the second dataset (only visuals on three cases) which does not allow to have an idea on the generalization of the approach.

II) Missing experiments

Two experiments are greatly missing in order to support the authors’ claim:

- an ablation study showing the improvement of the added branch with ori[i+1] (Fig.1) is essential, if only to discuss the behavior of the 3D approach proposed in (Zheng et al., TMI 2018). As a new pre-processing step is used, its effect should also be discussed.

- local evaluation of the geometrical scores is required to prove the approach is better than classical 2D models (here U-Net) that segment slices independently. Indeed, 2D models are known to fail at the apex and the base of the heart, as discussed in the original ACDC paper. This local failure was identified as the main limitation. The addition of context in a 3D model as the one proposed here is in particular aimed at improving the accuracy in those regions. Therefore, statistics restricted to those regions should be presented.

III) The second dataset, from the West China Hospital of Sichuan University and consisting of 150 patients, is not linked to any publication or internet site, and cannot be found online from the name. It therefore appears that this dataset is novel. To meet the requirements of the journal, access to the dataset should be given at time of submission. Also, a more thorough introduction of the dataset properties, in variety, pathology, and annotation should be added to the paper.

IV) It is mentioned in the conclusion that the network “effectively combines the sequence features”, performs “quick” segmentation, is “more robust”, is “suitable for the segmentation tasks of other medical images”. The first claim lacks the ablation study mentioned in II) to stand. The second has not been evaluated in any way. The third is backed up by an interesting comparison of the average performance on the 5 experiments of the cross-validation. However, this should include standard deviations to be meaningful. Finally, the last claim is out of context and not backed by evidence.

V) The authors present two misconceptions on basic deep learning theory. Firstly, it is mentioned that the pooling layer (one has to look at Fig1 to know it is max pooling) “can loose useless features that do not utilize segmentation, effectively reducing the complexity of the network, reducing the number of parameters, making the network train faster and occupying less computing resources”. This description is not accurate and partly wrong. Pooling layers reduce feature maps spatially, which improves the resilience to linear transformations, and indeed limits the needs in memory and probably speeds up the training phase. However, the number of parameters and the complexity is unchanged (it is only linked to the number and size of features and the number of input feature maps). Please review your interpretation of the pooling effect. Secondly, it is said that “if the learning rate is too high, it will lead to over-fitting”, which is false. A high learning rate can cause a network to have a noisy convergence, and even diverge. A small learning rate and a sufficient capacity and number of epochs is needed for a network to over-fit. That is why a validation set is often used to select the right model parameters as the one performing best on the validation set. The authors are encouraged to look into the interpretation of learning curves and learning rates.

VI) We here report the main changes that should be done in the writing.

- line 38, please do not refer to authors as “Paper”, but state the full name of the team and date of publication, such as (first author name et al., date).

- line 61, wrong sentence continuity. We propose “method, effectively overcoming”

- line 83, as it is not common knowledge, please rephrase your sentence. For instance “ No deep learning method has been used for cardiac MRI prior to 2013” + give citation of the paper in 2013 you are thinking of.

- line 100, wrong sentence continuity “ convolutional networks that provided good results on the ACDC 2017”

- line 118, “ori” instead of “orion”

- line 120 “deep supervision” instead of “depth”

- line 123, the sentence is unclear, especially when writing “designing a convolution of the number of different convolution kernels”. Please make your message clearer.

- line 126, what is the fitting rate of a network? Please use standard names.

- line 128 to 130, this sentence appears twice.

- line 143, a sentence should not begin by “And”

- line 153, “Cross-Entropy is the most commonly employed”

- line 167, “the myocardial annotations”

- line 217, “validation” instead of “test”, otherwise, if the selection of the model is indeed performed on the test set, the experiments are skewed and should be redone without involving the test set in the training phase.

- line 245 to 260, avoid repetitions. For instance, use “ Figure [] shows “ instead of “As shown in Figure[], this figure is”

- line 265, “our method has much better”

- line 269 to 271, please be careful on the punctuation and the splitting of ideas in sentences.

-line 278 to 283, this section should be mentioned in the dataset description. Information should be given on the splitting (how many patients for train, test, valid etc.), and scores should be added.

VII) We find the authors did not make enough efforts to take into account the remarks of the reviewers. In particular, the needs to perform evaluation on all structures and with ablations of the innovations were already mentioned respectively by reviewer 1 and reviewer 2, but not taken into account. In particular, it was answered that the proposed model does work better on other structures but that the ACDC dataset only had myocardium annotations, which is incorrect.

---

Changes required:

All points described above should be addressed for the paper to be acceptable. This involves in particular to:

- give the results on all the annotated structures of the ACDC dataset, with standard deviations in addition to mean values.

- give results for the experiments on the second dataset, and a thorough description of it.

- perform ablation studies and local evaluation to show and discuss the interest of the method compared to a classic U-Net and to the network in (Zheng et al, TMI 2018). If necessary, the results of the other models could be removed, as they are not related to this comparison but instead reinforce the choice of a U-Net like architecture (they all perform worse than U-Net).

- give in a table or a figure the results of the proposed method restricted to local sections of the heart (apex, base, middle) in order to discuss the whereabouts of the improvement. If necessary, this could replace the figures from 4 to 6 which support the same message. Besides, these figures could fit in one to save a lot of room.

- Refine the writing and avoiding misleading interpretations of hyper-parameters.

**********

7. PLOS authors have the option to publish the peer review history of their article (what does this mean?). If published, this will include your full peer review and any attached files.

If you choose “no”, your identity will remain anonymous but your review may still be made public.

Do you want your identity to be public for this peer review? For information about this choice, including consent withdrawal, please see our Privacy Policy.

Reviewer #1: No

Reviewer #3: No

[NOTE: If reviewer comments were submitted as an attachment file, they will be attached to this email and accessible via the submission site. Please log into your account, locate the manuscript record, and check for the action link "View Attachments". If this link does not appear, there are no attachment files to be viewed.]

While revising your submission, please upload your figure files to the Preflight Analysis and Conversion Engine (PACE) digital diagnostic tool, https://pacev2.apexcovantage.com/. PACE helps ensure that figures meet PLOS requirements. To use PACE, you must first register as a user. Registration is free. Then, login and navigate to the UPLOAD tab, where you will find detailed instructions on how to use the tool. If you encounter any issues or have any questions when using PACE, please email us at figures@plos.org. Please note that Supporting Information files do not need this step.

Decision Letter 2

Dzung Pham

2 Mar 2020

Cardiac MR Segmentation Based on Sequence Propagation by Deep Learning

PONE-D-19-18130R2

Dear Dr. Gao,

We are pleased to inform you that your manuscript has been judged scientifically suitable for publication and will be formally accepted for publication once it complies with all outstanding technical requirements.

Within one week, you will receive an e-mail containing information on the amendments required prior to publication. When all required modifications have been addressed, you will receive a formal acceptance letter and your manuscript will proceed to our production department and be scheduled for publication.

Shortly after the formal acceptance letter is sent, an invoice for payment will follow. To ensure an efficient production and billing process, please log into Editorial Manager at https://www.editorialmanager.com/pone/, click the "Update My Information" link at the top of the page, and update your user information. If you have any billing related questions, please contact our Author Billing department directly at authorbilling@plos.org.

If your institution or institutions have a press office, please notify them about your upcoming paper to enable them to help maximize its impact. If they will be preparing press materials for this manuscript, you must inform our press team as soon as possible and no later than 48 hours after receiving the formal acceptance. Your manuscript will remain under strict press embargo until 2 pm Eastern Time on the date of publication. For more information, please contact onepress@plos.org.

With kind regards,

Dzung Pham

Academic Editor

PLOS ONE

Additional Editor Comments (optional):

Reviewers' comments:

Reviewer's Responses to Questions

Comments to the Author

1. If the authors have adequately addressed your comments raised in a previous round of review and you feel that this manuscript is now acceptable for publication, you may indicate that here to bypass the “Comments to the Author” section, enter your conflict of interest statement in the “Confidential to Editor” section, and submit your "Accept" recommendation.

Reviewer #3: (No Response)

**********

2. Is the manuscript technically sound, and do the data support the conclusions?

The manuscript must describe a technically sound piece of scientific research with data that supports the conclusions. Experiments must have been conducted rigorously, with appropriate controls, replication, and sample sizes. The conclusions must be drawn appropriately based on the data presented.

Reviewer #3: Yes

**********

3. Has the statistical analysis been performed appropriately and rigorously?

Reviewer #3: Yes

**********

4. Have the authors made all data underlying the findings in their manuscript fully available?

The PLOS Data policy requires authors to make all data underlying the findings described in their manuscript fully available without restriction, with rare exception (please refer to the Data Availability Statement in the manuscript PDF file). The data should be provided as part of the manuscript or its supporting information, or deposited to a public repository. For example, in addition to summary statistics, the data points behind means, medians and variance measures should be available. If there are restrictions on publicly sharing data—e.g. participant privacy or use of data from a third party—those must be specified.

Reviewer #3: Yes

**********

5. Is the manuscript presented in an intelligible fashion and written in standard English?

PLOS ONE does not copyedit accepted manuscripts, so the language in submitted articles must be clear, correct, and unambiguous. Any typographical or grammatical errors should be corrected at revision, so please note any specific errors here.

Reviewer #3: Yes

**********

6. Review Comments to the Author

Please use the space provided to explain your answers to the questions above. You may also include additional comments for the author, including concerns about dual publication, research ethics, or publication ethics. (Please upload your review as an attachment if it exceeds 20,000 characters)

Reviewer #3: (No Response)

**********

7. PLOS authors have the option to publish the peer review history of their article (what does this mean?). If published, this will include your full peer review and any attached files.

If you choose “no”, your identity will remain anonymous but your review may still be made public.

Do you want your identity to be public for this peer review? For information about this choice, including consent withdrawal, please see our Privacy Policy.

Reviewer #3: No

Acceptance letter

Dzung Pham

9 Mar 2020

PONE-D-19-18130R2

Cardiac MR Segmentation Based on Sequence Propagation by Deep Learning

Dear Dr. Gao:

I am pleased to inform you that your manuscript has been deemed suitable for publication in PLOS ONE. Congratulations! Your manuscript is now with our production department.

If your institution or institutions have a press office, please notify them about your upcoming paper at this point, to enable them to help maximize its impact. If they will be preparing press materials for this manuscript, please inform our press team within the next 48 hours. Your manuscript will remain under strict press embargo until 2 pm Eastern Time on the date of publication. For more information please contact onepress@plos.org.

For any other questions or concerns, please email plosone@plos.org.

Thank you for submitting your work to PLOS ONE.

With kind regards,

PLOS ONE Editorial Office Staff

on behalf of

Dr Dzung Pham

Academic Editor

PLOS ONE

Associated Data

    This section collects any data citations, data availability statements, or supplementary materials included in this article.

    Supplementary Materials

    Attachment

    Submitted filename: Response to Reviewers.docx

    Attachment

    Submitted filename: Response to Reviewers1.docx

    Data Availability Statement

    All datasets files are available from the ACDC Challenge database (https://www.creatis.insa-lyon.fr/Challenge/acdc/databases.html). The authors did not receive special access privileges to the data. Heart Data Set of West China Hospital of Sichuan University, is available from figshare: (https://figshare.com/s/70021f845c4dc2a6e86d).


    Articles from PLoS ONE are provided here courtesy of PLOS

    RESOURCES