OBJECTIVES:
Biologic therapies have been available for inflammatory bowel disease for >20 years, but patient outcomes have not changed appreciably over this time period. To better understand medication utilization for this disease, we evaluated a novel technique for visualizing treatment pathways, including initial treatment, switching, and combination therapies.
METHODS:
This retrospective, observational study used administrative claims data from the Truven Health MarketScan Commercial and Medicare Database. Adult patients with ≥2 consecutive health claims and newly diagnosed with ulcerative colitis (UC) or Crohn's disease (CD) were evaluated. Treatment pathways were visualized using Sankey diagrams representing the number of patients receiving treatment and duration of each treatment.
RESULTS:
In all, 28,119 patients with UC and 16,260 patients with CD were identified. The most common initial treatment for UC was 5-aminosalicylic acid monotherapy (61% of the patients), followed by corticosteroid monotherapy (25%); <1% of patients were initially treated with biologics. The most common initial treatment for CD was corticosteroid monotherapy (42%), followed by 5-aminosalicylic acid monotherapy (35%); <5% of the patients were initially treated with biologics. Significantly fewer patients followed biologic vs nonbiologic treatment pathways (UC: 6% vs 94%, CD: 19% vs 81%, both P < 0.05).
DISCUSSION:
Significantly fewer patients with inflammatory bowel disease followed treatment pathways that included biologic therapies compared with nonbiologic therapies, and very few patients were ever initiated on biologic therapy. Although we have made significant progress in treatment, our most effective medications are only being used in a small proportion of patients, suggesting barriers prevent optimized patient management.
INTRODUCTION
Inflammatory bowel disease (IBD), a chronic disease of the gastrointestinal system, affected ≈3 million people in the United States in 2015 (1.3% of adults) and tends to be more common among women and older individuals (1). Approximately 70,000 new cases are reported per year, with most patients diagnosed before age 35 (2). With no cure, IBD has been associated with poor quality of life (QoL) and extensive morbidity, often resulting in complications requiring hospitalization and surgery (3). IBD comprises ulcerative colitis (UC) and Crohn's disease (CD), which lead to progressive gastrointestinal tract damage through chronic inflammation and are characterized by diarrhea, abdominal pain, and rectal bleeding (4). The annual incidence of UC is up to 19.2 cases per 100,000 people and CD is up to 20.2 cases per 100,000 people in North America (5).
The UC and CD public health burden is high, including greater morbidity and disability and undesirable impact on patients' overall health, QoL, and work productivity (6,7). Extensive healthcare utilization is required to control UC and CD, and the financial burden for patients, their families, and the healthcare system can be substantial. A recent analysis determined the average incremental US direct medical cost the first year after diagnosis was $23,574 for CD and $17,758 for UC (8).
Because UC and CD are characterized by a relapsing and remitting course, clinical management is complex, with a broad range of therapies available for induction and maintenance of disease control (9). Pharmacologic treatment for mild to moderate disease begins with aminosalicylates (for UC), corticosteroids, thiopurines, and antibiotics (10), with therapies optimized based on disease location, patient preference, and comorbidities (11). However, conventional treatments are ineffective in ≈20%–40% of patients with UC and CD (12,13). For patients who do not respond, lose response, or are intolerant of conventional therapy, clinical guidelines recommend using biologic therapy (10), particularly for patients with moderate to severe UC or CD.
Several studies demonstrated that patients who experience a delay in IBD diagnosis experience poorer treatment outcomes and QoL and are at higher risk for comorbidities and surgery (14–16), suggesting a need for early treatment. Several biologic therapies are approved for moderate to severe UC and CD, including antitumor necrosis factor monoclonal antibodies and integrin receptor antagonists. These drugs have been available for >20 years (17) and can be highly effective whether administered as monotherapy or in combination with immunomodulators early in the disease course (18,19). Despite the availability of these agents, hospitalization rates for IBD have remained steady over time (20), raising questions about how approved therapies are being used in the clinic.
Limited real-world data exist regarding treatment pathways and selection among patients with UC and CD. Such information, collected outside the controlled setting of clinical trials, is important to regulatory authorities, payers, and other healthcare decision makers in assessing both existing and novel pharmacotherapies. To gain a better understanding of how patients with UC and CD are treated in real-world settings, we performed an analysis of treatment pathways, including initial treatment, treatment switching, and use of combination therapies, using a large US commercial and Medicare insurance claims database to create Sankey diagrams.
METHODS
Data source
This retrospective, observational cohort study used administrative claims data from the 2008–2016 MarketScan Commercial and Medicare Supplemental Databases (Truven Health Analytics, Ann Arbor, MI, now IBM Watson Health, Cambridge, MA). The MarketScan databases contain pooled healthcare experience of up to 240 million unique patients since 1995, including inpatient and outpatient medical claims and enrollment data, such as member demographic information, eligibility, and benefits data. Data records were deidentified and certified as fully compliant with the Health Insurance Portability and Accountability Act patient confidentiality requirements. Institutional review board approval was not required because the study used only deidentified patient records and did not involve the collection, use, or transmittal of individually identifiable data (21).
Patients
The study included patients ≥18 years of age. The index date was the date of the occurrence of the first International Classification of Diseases, Ninth or Tenth Revision, Clinical Modification (ICD-9-CM/ICD-10-CM) code for the UC or CD diagnosis. Drug usage was identified using 11-digit codes of the National Drug Code (NDC), extracted to match the predefined NDC code list; procedure usage was identified by matching procedure codes to a predefined Healthcare Common Procedure Coding System (HCPCS) code list (see Table, Supplementary Digital Content 1, http://links.lww.com/CTG/A168). Only patients with at least 1 eligible drug record or procedure record were kept; if patients had an ambiguous or unclassified drug code, they were not included in the analysis. The index date for a given medication was the date of the first NDC or HCPCS code for each drug class (or for the individual drug in the biologic class). Patients receiving biologics before IBD diagnosis were not included in the analysis. Patients had to have ≥2 consecutive health claims for UC (ICD-9-CM code 556x; ICD-10-CM code K51x) or CD (ICD-9-CM code 555x; ICD-10-CM code K50x) at least 30 days apart. Moreover, patients were required to have UC or CD treatment after the index date of diagnosis, defined as ≥1 occurrence of an NDC or HCPCS code for UC or CD medication between January 1, 2008, and March 31, 2016, based on existing treatment guidelines (22,23). UC and CD were unique cohorts that excluded patients with the ICD-9-CM/ICD-10-CM code for the other condition. Disease severity was not inferred through claims data.
Outcomes
Evaluated outcomes included use of biologic therapies and time to first biologic use. Biologic use was defined as the proportion of patients in biologic-containing pathways vs the proportion of patients in pathways that did not contain any biologics. Denominators for both are the total number of patients. Time to first biologic (biologics treatment cohort) was defined as the time in days between the UC or CD index date and the first date for the first individual biologic treatment.
Statistical analyses
Descriptive analyses were used to summarize patient characteristics. Continuous variables were summarized as means and SDs. Categorical variables were presented as counts and percentages. The t tests were used to compare biologic vs nonbiologic treatment pathways between the UC and CD cohorts. A log-rank test was used to compare whether significant differences existed in time to first biologic treatment among different first-line groups; P values were adjusted by false-discovery-rate approach for multiple testing correction purpose. Sensitivity analysis of time to first biologic treatment was performed on age, gender, and region subgroups of patients treated with biologics. Within each subgroup, hazard ratios of time to first biologic treatment for patients initiated or not initiated with 5-aminosalicylic acid (5-ASA) were estimated by the Cox proportional hazard model with Kolmogorov-Smirnov test used to assess proportional hazards assumptions.
Treatment pathway definition and analysis
A treatment pathway is defined as a unique longitudinal sequence of discrete IBD treatments and is differentiated based on introduction of discrete agents in patients' UC or CD treatment course. A monotherapy pathway was defined as the use of the same single agent, once or repeatedly, throughout the treatment course. A treatment cycle was defined as 1 filled prescription.
Treatment pathways were visualized using Sankey diagrams, generated through rCharts (Sankey Library). Sankey diagrams have been designed to place visual emphasis on the major transfers or flows within a system and help identify dominant contributions to an overall flow. We adapted Sankey diagrams for the current study such that the width of each ribbon was proportional to the number of patients flowing from the upstream node to the downstream node. Each vertical bar represented 1 treatment in 1 line. The height of the bars was proportional to the number of patients receiving the treatment; the width of the bars was proportional to the average duration of the treatment. Unique sequences of IBD treatments were depicted and numbers of patients across different treatment pathways were quantified. Treatment pathway analyses yielded percentages of patients on different first-line, second-line, and third-line treatments over time as well as percentages on first-line, second-line, and third-line biologics and time to biologic initiation.
Regional and additional analyses
Treatment pathways were compared between 4 regions in the United States (North Central, Northeast, West, and South) and between all 50 states (see Figure, Supplementary Digital Content 2, http://links.lww.com/CTG/A169). Additional treatment pathway analyses were conducted for patients with a UC or CD diagnosis for ≥1 year. Sensitivity analyses were conducted for the cohort size with varying numbers of diagnoses and time to first biologic treatment.
RESULTS
Cohorts
Included in the analysis were 28,119 patients with UC and 16,260 patients with CD. Patients with UC were followed for a median of 3.17 (range: 1.90–7.46) years and patients with CD were followed for a median of 3.68 (range: 1.97–7.12) years. Baseline demographics and clinical characteristics for patients included at the index date were similar (see Table, Supplementary Digital Content 3, http://links.lww.com/CTG/A170); both cohorts had similar mean age and gender distributions (>50% were women). At the time of analysis, a greater proportion of patients with UC and CD were located in the North Central and South regions of the United States vs the Northeast or West regions.
UC treatment pathways
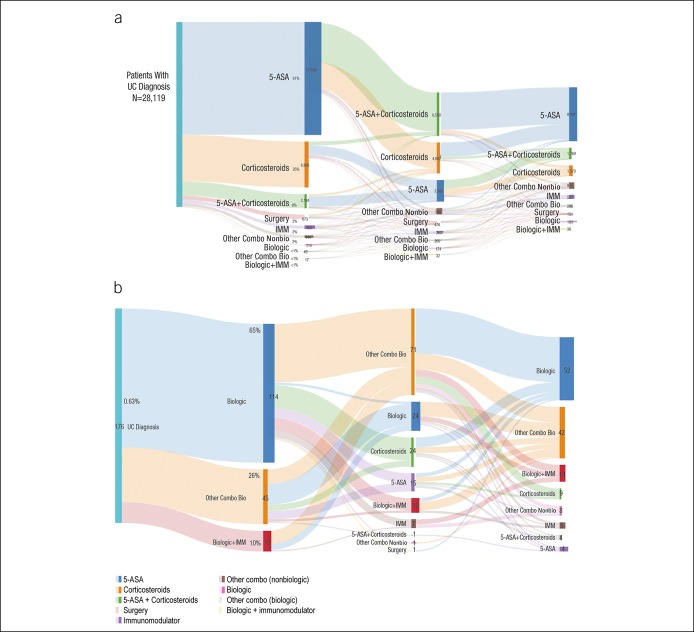
Several treatment pathways were identified for patients with a UC diagnosis (Figure 1). The most common initial treatment for UC was 5-ASA monotherapy (61% of patients), followed by corticosteroid monotherapy (25% of patients; Figure 1a). Overall, <1% of the patients were treated with biologic therapy as their initial (first-line) treatment (Figure 1b). Because biologic treatment pathways were relatively rare overall, even fewer biologics as combination therapy treatment pathways were identified. The most common biologic treatment pathway for patients with UC was adalimumab monotherapy (0.04%), followed by a switch from 5-ASA to adalimumab monotherapy (0.03%). Among patients with UC who were treated with 5-ASA initially, 39% were managed exclusively with 5-ASA, whereas 61% treated with 5-ASA first line switched to another treatment and some were treated with 5-ASA for up to 10 cycles (not shown).
Figure 1.
(a) Overall treatment pathways for UC depicted by Sankey diagrams. (b) First-line biologic treatment pathways for patients with UC. 5-ASA, 5-aminosalicylic acid; IMM, immunomodulator; Mono, monotherapy; other Combo Bio, other combination with a biologic; other Combo NonBio, other combination with a nonbiologic; UC, ulcerative colitis.
CD treatment pathway visualizations
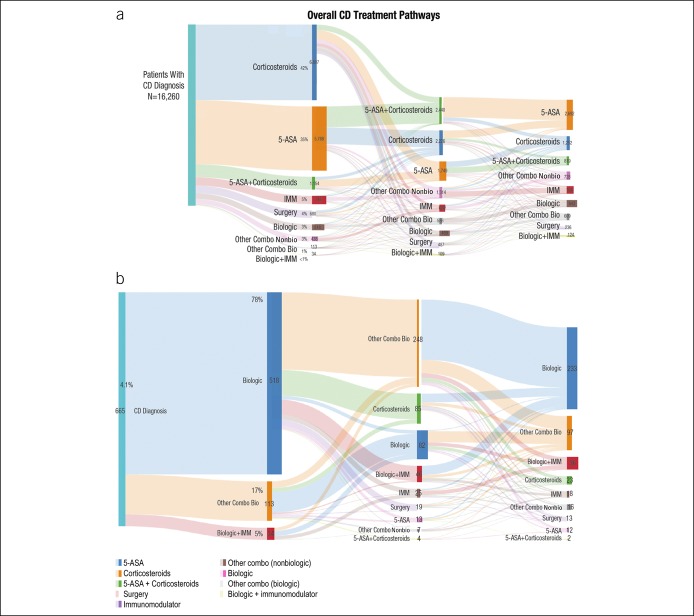
Several treatment pathways were identified for patients with CD (Figure 2). The most common initial treatment was corticosteroid monotherapy (42%), followed by 5-ASA monotherapy (35%) (Figure 2a). Overall, <5% of the patients with CD were treated with a biologic as their initial therapy. Biologic treatment pathways were relatively rare overall, and even fewer treatment pathways for biologics as combination therapy were identified. The most common biologic treatment pathway among patients with CD was adalimumab monotherapy (0.5%), followed by infliximab monotherapy (0.3%; Figure 2b). Among patients with CD who were treated with corticosteroids as first-line therapy, 63% received corticosteroid monotherapy as repeated courses; some remained on corticosteroid therapy for up to 10 cycles (not shown).
Figure 2.
(a) Overall CD treatment pathways depicted by a Sankey diagram. (b) First-line biologic treatment pathways for patients with CD. 5-ASA, 5-aminosalicylic acid; CD, Crohn's disease; IMM, immunomodulator; Mono, monotherapy; other Combo Bio, other combination with a biologic; other Combo NonBio, other combination with a nonbiologic.
Use of any biologic therapy
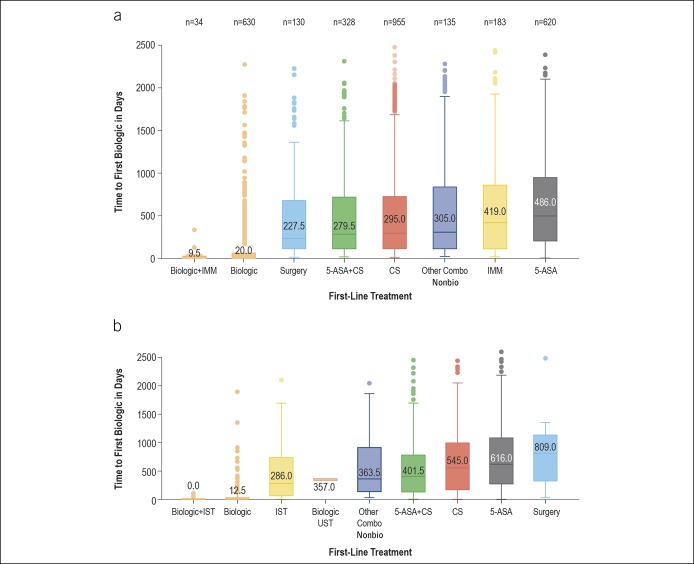
Significantly fewer patients proceeded through any biologic treatment pathways than through nonbiologic treatment pathways for UC treatment (6% vs 94%; P < 0.05, t test) and for CD (19% vs 81%; P < 0.05, t test). Patients with CD who initiated on 5-ASAs had a longer time to biologic initiation (median 486 days) vs patients using other first-line pharmacologic treatments (Figure 3a). Similar outcomes were observed in the UC cohort where patients using 5-ASA had the longest time until biologic initiation (median 616 days) vs those treated with other pharmacologic treatments (Figure 3b). Additional subgroup analyses by age and gender showed consistent patterns in time to first biologics (not shown).
Figure 3.
(a) Time to first biologic therapy for patients with CD, by first-line treatment. (b) Time to first biologic therapy for patients with UC, by first-line treatment. 5-ASA, 5-aminosalicylic acid; CD, Crohn's disease; CS, corticosteroid; IMM, immunomodulator; IST, immunosuppressive therapy ; Other Combo Nonbio, other combination with a nonbiologic; UC, ulcerative colitis UST, ustekinumab.
Sensitivity analyses were performed to assess whether results were robust to more stringent entry criteria. More stringent entry criteria resulted in reduction in the number of eligible patients because the number of required confirmatory diagnoses increased for up to 5 diagnoses. For UC, these totals were 21,642 patients, 17,341 patients, and 13,801 patients with 3, 4, and 5 confirmatory diagnoses, respectively; for CD, these totals were 13,064 patients, 10,993 patients, and 9,341 patients with 3, 4, and 5 confirmatory diagnoses, respectively. When the analysis was repeated using these cohorts, results were consistent with the original total cohort findings (data not shown).
Subset analysis
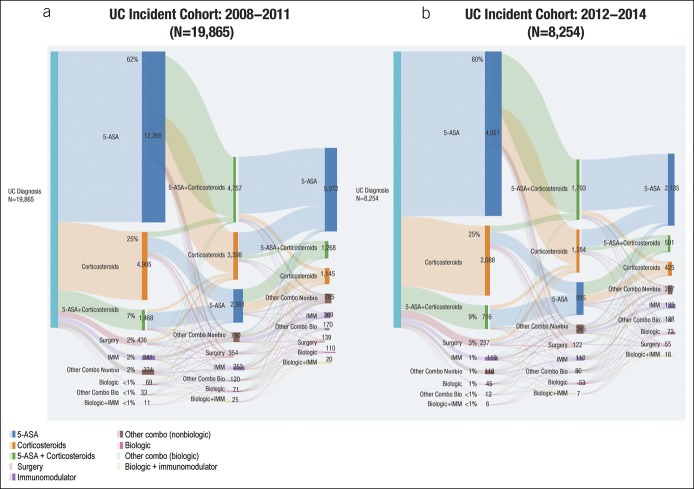
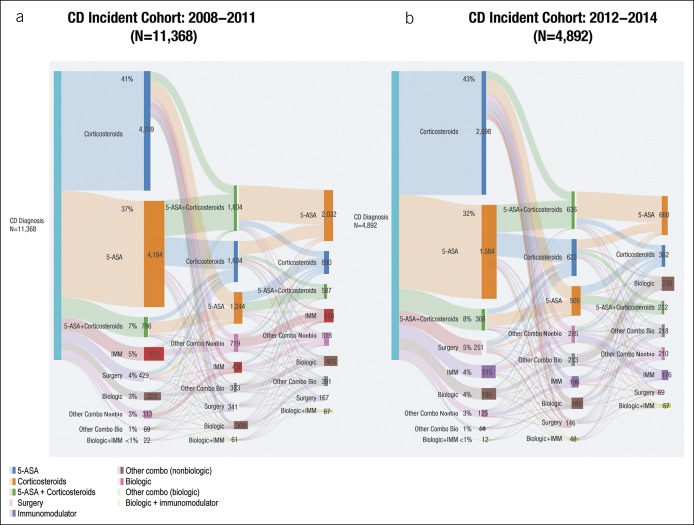
Both the UC and CD cohorts were subdivided into early (2008–2011) vs late (2012–2014) time period‒based cohorts. Significantly fewer patients proceeded through biologic treatment pathways than through nonbiologic treatment pathways (all P < 0.05, t test) in early (5.1% vs 94.9%) and late (7.5% vs 92.5%) incidence cohorts for UC (Figure 4) and early (17.3% vs 82.7%) and late (21.4% vs 78.6%) incidence cohorts for CD (Figure 5). Similar trends were observed between the pre-2011 and post-2011 cohorts, demonstrating that overall treatment patterns and extent of biologic use remained consistent, even more recently.
Figure 4.
Treatment pathways in UC incident cohorts for (a) 2008–2011 and (b) 2012–2014. 5-ASA, 5-aminosalicylic acid; IMM, immunomodulator; other Combo Bio, other combination with a biologic; other Combo NonBio, other combination with a nonbiologic; UC, ulcerative colitis.
Figure 5.
Treatment pathways in CD incident cohorts for (a) 2008–2011 and (b) 2012–2014. 5-ASA, 5-aminosalicylic acid; CD, Crohn's disease; IMM, immunomodulator; other Combo Bio, other combination with a biologic; other Combo Nonbio, other combination with a nonbiologic.
Regional analyses
Among patients with UC, 5-ASA monotherapy was the most common first-line agent in all regions (59%–64%) (Table 1), whereby 22%–35% of the patients received ≥2 cycles. First-line biologic use was observed in <1% of the patients across regions. Among patients with CD, corticosteroid monotherapy was the most common first-line agent in the North Central (41%), West (39%), and South (45%) regions. In the Northeast, corticosteroids and 5-ASA were each used first by 40% of the patients with CD (Table 1). Across all regions, 35%–42% of the patients received ≥2 cycles of corticosteroid monotherapy for CD, and biologics were used as initial treatment by 3.9%–4.1% across all regions.
Table 1.
Patients with UC using first-line 5-ASA or CD using first-line corticosteroids, then cycling to other therapies
Biologic use varied widely between states for UC and CD despite the low variation between US regions (see Figure, Supplementary Digital Content 4, http://links.lww.com/CTG/A171). Time to first biologic therapy varied significantly between US regions after 5-ASA and immunomodulator therapy among patients with UC and after first-line corticosteroids and immunomodulator monotherapy among patients with CD (data not shown).
Analysis: >1 year since diagnosis
Additional analyses were conducted for patients with a UC or CD diagnosis for ≥1 year. After the first year of UC diagnosis, the most commonly used therapy was 5-ASA monotherapy (16,353/24,679 patients; 66.3%), followed by corticosteroid monotherapy (4,599/24,679 patients; 18.6%). Biologic use was observed in <1% of patients with UC. After the first year of CD diagnosis, the most commonly used therapy was 5-ASA monotherapy (5,439/13,845 patients; 39.3%), followed by corticosteroid monotherapy (4,756/13,845 patients; 34.4%). Biologic use was observed in <5% of the patients with CD.
DISCUSSION
This study provides real-world information using a novel technique to visualize UC and CD treatment pathways. Here, we demonstrated that significantly fewer patients with UC or CD proceeded through treatment pathways that included biologic therapies compared with nonbiologic treatment pathways. Very few patients with UC were initiated on biologic therapy, with even fewer treatment pathways observed that included biologics as part of combination therapy. The most common initial UC treatment was 5-ASA monotherapy, followed by corticosteroid monotherapy.
The most common initial CD treatment was corticosteroid monotherapy, followed by 5-ASA monotherapy. Like patients with UC, those with CD were rarely initiated on biologic therapy, with even fewer pathways identified using biologics as part of combination therapy. These patterns were observed despite guidelines for UC (23) and CD (22) treatment that recommend antitumor necrosis factor-α (biologic) as top-down therapy, alone or in combination, for patients presenting with moderate to severe disease. Furthermore, 5-ASAs have been removed from CD treatment guidelines, and corticosteroids are meant to be used as “bridge” therapy to immunomodulators or biologic therapy rather than as repeated courses without steroid-sparing therapy (24), as we found in >60% of our study patients. In a recent study using the same claims database, a larger proportion of patients used biologics between 2007 and 2015 (CD: 21.8%–43.8%; UC: 5.1%–16.2%) than immunomodulators or 5-ASA (25). One reason for the discrepancy in biologic users between the current and Yu et al. studies may be the 3-year continuous enrollment used in our analysis, which may have decreased the number of qualifying patients and excluded patients with more recent diagnosis. Differences in nonbiologic drugs, resulting in different sample sizes, may also contribute to the varying proportions of patients using biologic therapy (25). Despite numerical differences, the trend of increasing biologic use was seen in both analyses.
Suboptimal therapy can be defined several ways. Although the impact of suboptimal treatment on clinical outcomes was not measured in this study, it may be inferred that, although many treatment options are available for moderate to severe patients, healthcare providers are not optimizing advanced therapies, such as biologics, as recommended in the current clinical guidelines for patients with moderate to severe IBD. Several possible barriers to biologic initiation include patients' and providers' concerns over side effects and multiple steps needed to initiate and maintain biologics, such as baseline and follow-up testing, therapeutic drug monitoring, and required logistics regarding injections or infusions. Another barrier is a perceived reluctance by payers to fund treatments for chronic diseases (26). However, results from a recent market analysis of US health insurance policies on biologics for IBD suggested that biologic use is covered for most patients, and the real hurdle may be clinicians' perceptions regarding coverage, or lack thereof, for specific treatments (27). From a payer perspective, advanced, individualized, and risk-stratified treatment pathways that include biologics are available for patients with IBD (27). Future studies to identify and address reasons for suboptimal UC and CD treatment would be very valuable. At the very least, our observation that overall biologic use varied widely between states for each condition despite low variation between US regions, and that time to first biologic therapy varied significantly between US regions, indicates poor quality of care and needs to be addressed.
The major strength of this study was the use of real-world data and large numbers of patients to identify unique treatment pathways in UC and CD treatment using a novel visualization approach with Sankey diagrams. However, there were several limitations. First, the study population consisted only of patients with commercial or Medicare supplemental insurance represented in the Truven Health MarketScan database. Results may not be generalizable, especially in patients with Medicaid, other insurance, or no insurance. Second, the potential exists for misclassification of a patient's UC or CD status, covariates, or study outcomes because patients were identified through administrative claims data rather than through evaluation of medical records. Disease severity was not captured in these patients so it is not possible to determine exactly how many should have been treated with biologics. However, because only 20%–30% of patients with CD will have an indolent or non-progressive course (24), and nearly 20% of patients with UC ultimately require colectomy (28), the appropriate proportion of those treated with biologics is likely far higher than that seen in the studied patient population. The study captures the incident cases of CD and UC within the database and, therefore, may include patients that have previously been diagnosed. In addition, the 3-year continuous enrollment criteria may exclude some newly diagnosed patients. Finally, we used filled prescriptions to define treatment cycle. In clinical practice, symptomatic patients with moderate to severe IBD may be initiated on corticosteroids as a temporary measure while awaiting initiation of biologic agents (e.g., if awaiting insurance authorization). As steroids are technically first-line therapy for these patients, this may confound treatment pathway results.
In summary, we believe that this study identified unique UC and CD treatment pathways visualized through Sankey diagrams. Few patients were treated with biologics and, of those who were, few received combination therapy despite support for this approach. In addition, patients with CD were overtreated with 5-ASAs and corticosteroids. These findings are clinically relevant because they suggest that barriers are in place to following current UC and CD treatment guidelines, and disease management recommendations may not be uniformly followed in the real-world setting, highlighting the need for better disease management in patients with UC and CD.
CONFLICTS OF INTEREST
Guarantor of the article: Corey A. Siegel, MD, MS.
Specific author contributions: C.A.S., F.Y., S.E., and Z.C. were involved in the study planning, interpretation of the data, and development of the manuscript. All authors approved the final submitted draft of this manuscript.
Financial support: This study was sponsored by Celgene Corporation (Summit, NJ, USA). The named authors, which include Celgene employees, were involved in the study design; in the collection, analysis, and interpretation of data, in writing the report; and in the decision to submit the article for publication. The authors received writing support in the preparation of this report from Kristin Carlin, RPh, MBA, of Peloton Advantage, LLC, an OPEN Health company, Parsippany, NJ, USA, funded by Celgene Corporation, Summit, NJ, USA. The authors, however, directed and are fully responsible for all content and editorial decisions for this report.
Potential competing interests: C.A.S. has conducted research and served as a speaker for CME programs for AbbVie, Janssen, Pfizer, and Takeda, and has served as a consultant for AbbVie, Amgen, Celgene Corporation, Eli Lilly, Janssen, Sandoz, Pfizer, Prometheus, Takeda, and UCB Pharma. F.Y. is an employee of Celgene Corporation. S.E. and Z.C. were employees of Celgene Corporation at the time of study conduct.
Ethical and legal considerations: Institutional review board approval was not required because the study used only de-identified patient records and did not involve the collection, use, or transmittal of individually identifiable data.
Data sharing: Celgene is committed to responsible and transparent sharing of clinical trial data with patients, healthcare practitioners, and independent researchers for the purpose of improving scientific and medical knowledge as well as fostering innovative treatment approaches. For more information, please visit: https://www.celgene.com/research-development/clinical-trials/clinical-trials-data-sharing/.
Study Highlights.
WHAT IS KNOWN
✓ Early initiation of biologics is recommended for moderate to severely active IBD.
WHAT IS NEW HERE
✓ Fewer than 5% of patients with IBD are initially treated with biologics.
✓ Significantly fewer patients followed a treatment progression that includes biologics than those with nonbiologic therapies.
✓ Despite progress, highly effective medications (biologics) are only used in a small proportion of patients.
TRANSLATIONAL IMPACT
✓ These findings suggest disease management recommendations may not be uniformly followed in the real-world setting, highlighting the need for better disease management in patients with UC and CD.
Supplementary Material
Footnotes
SUPPLEMENTARY MATERIAL accompanies this paper at http://links.lww.com/CTG/A168, http://links.lww.com/CTG/A169, http://links.lww.com/CTG/A170, and http://links.lww.com/CTG/A171
REFERENCES
- 1.Dahlhamer JM, Zammitti EP, Ward BW, et al. Prevalence of inflammatory bowel disease among adults aged ≥18 years—United States, 2015. MMWR Morb Mortal Wkly Rep 2016;65:1166–9. [DOI] [PubMed] [Google Scholar]
- 2.Crohn's & Colitis Foundation of America. The facts about inflammatory bowel diseases. 2014. Available at: http://www.crohnscolitisfoundation.org/assets/pdfs/updatedibdfactbook.pdf. Accessed January15, 2018.
- 3.Bewtra M, Su C, Lewis JD. Trends in hospitalization rates for inflammatory bowel disease in the United States. Clin Gastroenterol Hepatol 2007;5:597–601. [DOI] [PubMed] [Google Scholar]
- 4.Binion DG. Biologic therapies for Crohn's disease: Update from the 2009 ACG meeting. Gastroenterol Hepatol (N Y) 2010;6:4–16. [PMC free article] [PubMed] [Google Scholar]
- 5.Molodecky NA, Soon IS, Rabi DM, et al. Increasing incidence and prevalence of the inflammatory bowel diseases with time, based on systematic review. Gastroenterology 2012;142:46–54.e42. [DOI] [PubMed] [Google Scholar]
- 6.Williet N, Sarter H, Gower-Rousseau C, et al. Patient-reported outcomes in a French nationwide survey of inflammatory bowel disease patients. J Crohns Colitis 2017;11:165–74. [DOI] [PubMed] [Google Scholar]
- 7.Wolters FL, Joling C, Russel MG, et al. Treatment inferred disease severity in Crohn's disease: Evidence for a European gradient of disease course. Scand J Gastroenterol 2007;42:333–44. [DOI] [PubMed] [Google Scholar]
- 8.Lichtenstein GR, Shahabi A, Seabury SA, et al. The total direct cost of healthcare in the United States in patients with Crohn's disease and ulcerative colitis: An age specific analysis [abstract]. Gastroenterology 2017;152:S-448. [Google Scholar]
- 9.Rubin DT, Mody R, Davis KL, et al. Real-world assessment of therapy changes, suboptimal treatment and associated costs in patients with ulcerative colitis or Crohn's disease. Aliment Pharmacol Ther 2014;39:1143–55. [DOI] [PubMed] [Google Scholar]
- 10.Patel H, Lissoos T, Rubin DT. Indicators of suboptimal biologic therapy over time in patients with ulcerative colitis and Crohn's disease in the United States. PLoS One 2017;12:e0175099. [DOI] [PMC free article] [PubMed] [Google Scholar]
- 11.Sales-Campos H, Basso PJ, Alves VB, et al. Classical and recent advances in the treatment of inflammatory bowel diseases. Braz J Med Biol Res 2015;48:96–107. [DOI] [PMC free article] [PubMed] [Google Scholar]
- 12.Park SC, Jeen YT. Current and emerging biologics for ulcerative colitis. Gut Liver 2015;9:18–27. [DOI] [PMC free article] [PubMed] [Google Scholar]
- 13.Hilsden R. Funding the new biologics—What can we learn from infliximab? The CCOHTA report: A gastroenterologist's viewpoint. Can J Gastroenterol 2002;16:865–8. [DOI] [PubMed] [Google Scholar]
- 14.Pellino G, Sciaudone G, Selvaggi F, et al. Delayed diagnosis is influenced by the clinical pattern of Crohn's disease and affects treatment outcomes and quality of life in the long term: A cross-sectional study of 361 patients in Southern Italy. Eur J Gastroenterol Hepatol 2015;27:175–81. [DOI] [PubMed] [Google Scholar]
- 15.Schoepfer AM, Dehlavi MA, Fournier N, et al. Diagnostic delay in Crohn's disease is associated with a complicated disease course and increased operation rate. Am J Gastroenterol 2013;108:1744–53; quiz 54. [DOI] [PubMed] [Google Scholar]
- 16.Lee DW, Koo JS, Choe JW, et al. Diagnostic delay in inflammatory bowel disease increases the risk of intestinal surgery. World J Gastroenterol 2017;23:6474–81. [DOI] [PMC free article] [PubMed] [Google Scholar]
- 17.Remicade [package insert]. Janssen Biotech, Inc.: Horsham, PA, 2018. [Google Scholar]
- 18.Colombel JF, Sandborn WJ, Reinisch W, et al. Infliximab, azathioprine, or combination therapy for Crohn's disease. N Engl J Med 2010;362:1383–95. [DOI] [PubMed] [Google Scholar]
- 19.Panaccione R, Ghosh S, Middleton S, et al. Combination therapy with infliximab and azathioprine is superior to monotherapy with either agent in ulcerative colitis. Gastroenterology 2014;146:392–400.e3. [DOI] [PubMed] [Google Scholar]
- 20.Malarcher CA, Wheaton AG, Liu Y, et al. Hospitalizations for Crohn's disease—United States, 2003-2013. MMWR Morb Mortal Wkly Rep 2017;66:377–81. [DOI] [PMC free article] [PubMed] [Google Scholar]
- 21.Hansen L. The Truven Health MarketScan Databases for life sciences researchers. 2017. Available at: https://truvenhealth.com/Portals/0/Assets/2017-MarketScan-Databases-Life-Sciences-Researchers-WP.pdf. Accessed July 18, 2018.
- 22.Terdiman JP, Gruss CB, Heidelbaugh JJ, et al. American Gastroenterological Association Institute guideline on the use of thiopurines, methotrexate, and anti-TNF-alpha biologic drugs for the induction and maintenance of remission in inflammatory Crohn's disease. Gastroenterology 2013;145:1459–63. [DOI] [PubMed] [Google Scholar]
- 23.Kornbluth A, Sachar DB. Ulcerative colitis practice guidelines in adults: American College of Gastroenterology, Practice Parameters Committee. Am J Gastroenterol 2010;105:501–23. [DOI] [PubMed] [Google Scholar]
- 24.Lichtenstein GR, Loftus EV, Isaacs KL, et al. ACG clinical guideline: Management of Crohn's disease in adults. Am J Gastroenterol 2018;113:481–517. [DOI] [PubMed] [Google Scholar]
- 25.Yu H, MacIsaac D, Wong JJ, et al. Market share and costs of biologic therapies for inflammatory bowel disease in the USA. Aliment Pharmacol Ther 2018;47:364–70. [DOI] [PMC free article] [PubMed] [Google Scholar]
- 26.Cohen-Mekelburg S, Gold S, Schneider Y, et al. Delays in initiating post-operative prophylactic biologic therapy are common among Crohn's disease patients. Dig Dis Sci 2019;64:196–203. [DOI] [PubMed] [Google Scholar]
- 27.Dulai PS, Osterman MT, Lasch K, et al. Market access analysis of biologics and small-molecule inhibitors for inflammatory bowel disease among US health insurance policies. Dig Dis Sci 2019;64:2478–88. [DOI] [PMC free article] [PubMed] [Google Scholar]
- 28.Manetti N, Bagnoli S, Rogai F, et al. Disease course and colectomy rate of ulcerative colitis: A follow-up cohort study of a referral center in Tuscany. Inflamm Bowel Dis 2016;22:1945–53. [DOI] [PubMed] [Google Scholar]
Associated Data
This section collects any data citations, data availability statements, or supplementary materials included in this article.


