Abstract
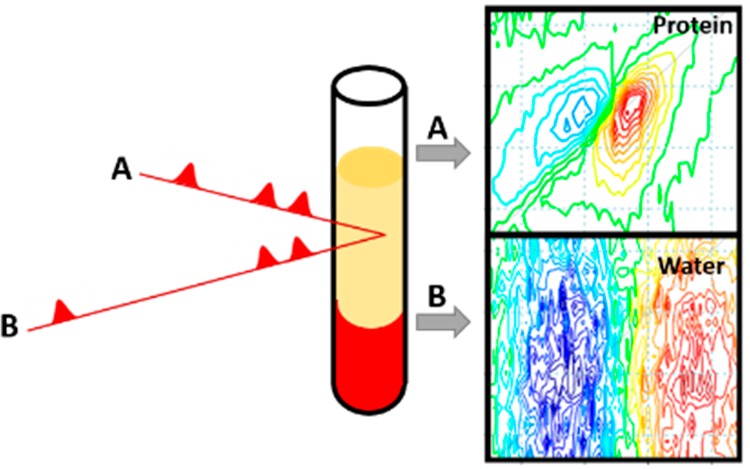
Ultrafast two-dimensional infrared (2D-IR) spectra can now be obtained in a matter of seconds, opening up the possibility of high-throughput screening applications of relevance to the biomedical and pharmaceutical sectors. Determining quantitative information from 2D-IR spectra recorded on different samples and different instruments is however made difficult by variations in beam alignment, laser intensity, and sample conditions. Recently, we demonstrated that 2D-IR spectroscopy of the protein amide I band can be performed in aqueous (H2O) rather than deuterated (D2O) solvents, and we now report a method that uses the magnitude of the associated thermal response of H2O as an internal normalization standard for 2D-IR spectra. Using the water response, which is temporally separated from the protein signal, to normalize the spectra allows significant reduction of the impact of measurement-to-measurement fluctuations on the data. We demonstrate that this normalization method enables creation of calibration curves for measurement of absolute protein concentrations and facilitates reproducible difference spectroscopy methodologies. These advances make significant progress toward the robust data handling strategies that will be essential for the realization of automated spectral analysis tools for large scale 2D-IR screening studies of protein-containing solutions and biofluids.
Ultrafast 2D-IR spectroscopy is now established as a powerful tool for interrogating the structure and dynamics of molecules in the solution phase and has played a significant role in developing our understanding of biomolecular systems, such as proteins and nucleic acids.1−9 Recent developments in laser technology and mid-infrared pulse shaping10−13 have provided scope for 2D-IR to be applied in a more analytical manner, for example, in high-throughput measurements for rapid screening of multiple biomolecule–drug combinations.14
We demonstrated recently that 2D-IR spectroscopy can be used to measure the amide I vibrational band of proteins in aqueous (H2O) solutions at submillimolar concentrations.15 This ability arises because the nonlinear nature of the 2D-IR measurement preferentially amplifies the protein response relative to that of the overlapping water bending vibration that dominates IR absorption measurements of the amide I band.16,17 Combining the ability to work in water with the sensitivity of the 2D-IR amide I line shape to protein secondary structure18,19 allowed the clinically relevant albumin to globulin ratio of blood serum to be measured from a single transmission-mode 2D-IR spectrum without sample preprocessing.15 As blood serum is easily obtainable via minimally invasive methods and provides access to a broad biomolecular fingerprint of metabolic function, these measurements establish proof of concept for utilizing 2D-IR for biofluid analysis, circumventing the current need for sample preprocessing or laborious wet biochemical analysis techniques. Moreover, the ability to acquire 2D-IR spectra of proteins in H2O, rather than D2O, removes a significant economic barrier to large-scale protein–drug screening studies making 2D-IR more accessible to the pharmaceutical sector.
These advances indicate the potential for 2D-IR spectroscopy to undergo a transition from the high-end research laboratory to a more mainstream place in the suite of analytical techniques in a manner that mirrors changes undergone by NMR spectroscopy or electron cryo-microscopy techniques. Taking such a step, however, presents new challenges that must be overcome in terms of the experimental and data handling methods employed currently.
A major challenge is associated with the technical complexity of the 2D-IR measurement. In contrast to absorption spectroscopy, where a measurement of absorbance allows reliable cross-comparison of spectra obtained on different spectrometers and under varying sample conditions, each 2D-IR spectrum is subject to fluctuations in laser pulse energy, laser beam quality, focusing and spatial overlap, as well as the usual variables introduced by changes in sample concentration and path length. The impact of issues such as laser energy fluctuations can be eased by the use of referencing or signal averaging, but variations in spectrometer alignment and path length make comparisons between different samples and different measurements problematic, while absolute measurements of concentrations are impossible currently.
Such issues do not affect normal applications of 2D-IR spectroscopy, where relative changes in line shapes or peak heights within a single measurement are studied, but they represent a significant barrier to analytical applications of 2D-IR spectroscopy where quantitative sample-to-sample comparisons are essential. It has been demonstrated that 2D-IR can be used in harness with IR absorption and an independent calibrant molecule to provide measurements of transition dipole moments of peptide and protein samples.16,17 Though this approach is powerful, avoiding the need for additional calibration steps or to add molecules to the sample is desirable if 2D-IR is to be used in a high-throughput fashion.
In this article, we demonstrate that the ability to measure 2D-IR signals of proteins in water also provides a route to normalization of spectra via the magnitude of the thermal response of the water that follows protein amide I excitation. Such internal spectral normalization addresses problems of measurement-to-measurement repeatability and confers the ability to determine absolute protein concentrations accurately. We further demonstrate that the method will aid high-throughput studies of protein systems by enabling automated implementation of difference-spectroscopy analysis methods. As the spectral bandwidth of current 2D-IR instruments continues to expand, there is scope for a similar approach to be employed in the more traditionally studied deuterated protein samples where the thermal response of the solvent is spectrally distant from the IR vibrations of interest.
Experimental Section
IR pump–probe and 2D-IR spectra were recorded using the ULTRA B (10 kHz repetition rate)20 and LIFEtime (100 kHz)12 laser systems at the STFC Rutherford Appleton laboratory. In each case, the Fourier transform 2D-IR method employing a sequence of three mid-IR laser pulses arranged in a pseudo pump–probe beam geometry was employed. In the case of ULTRA B, the pulses were generated by a Ti:sapphire laser (Coherent Legend Elite Duo, 20 W, 50 fs, 10 kHz pulse repetition rate) producing 5 W of 800 nm light pumping a home-built white-light seeded BBO optical parametric amplifier (OPA) equipped with difference frequency mixing of the signal and idler in AgGaS2. Mid-IR pulses with a temporal duration of <50 fs, a central frequency of 1650 cm–1, and a bandwidth of ∼400 cm–1 were obtained. The LIFEtime instrument has been described previously.12 On both instruments, pump pulse sequences were generated using a mid-IR pulse shaping device.21 Pump–probe spectra were recorded at pump–probe delay times from −5 to 10 ps in 0.1 ps increments. 2D-IR spectra were recorded Tw values of 250 fs and 5 ps using a parallel pump–probe polarization relationship.
Results and Discussion
To demonstrate how the internal spectral normalization method can be applied to determine absolute protein concentrations, IR absorption, IR pump–probe, and 2D-IR spectra of a series of 12 different samples taken from each of two stock solutions of bovine serum albumin (BSA) in H2O-based buffer (pH = 7.5) were measured over a period of 2 weeks. The choice of BSA reflects our ongoing interest in using 2D-IR for biofluid diagnostics. Blood serum is a complex mixture including the major protein constituents serum albumin (35–50 mg/mL; 0.5–0.7 mM) and the γ-globulins (25–30 mg/mL; ∼0.15–0.25 mM) and so the two BSA stock solutions contained the clinically relevant concentrations of 30 and 50 mg/mL BSA. It is important to note that these concentrations correspond closely to the sub-millimolar levels typical of 2D-IR studies of proteins in deuterated solvents. Two different spectrometers were used, the 100 kHz pulse repetition rate LIFEtime instrument12 and the 10 kHz ULTRA laser system.20 This approach allowed comparison of the signal from unvarying samples over a range of sample cell and spectrometer conditions.
The IR absorption spectrum of BSA in H2O is shown in Figure 1a, alongside IR pump–probe (Figure 1b) and 2D-IR spectra (Figure 1c,d) of the same sample. In the IR absorption spectrum, an intense peak near 1650 cm–1 is assignable to overlapping contributions from the amide I band of the protein and the H–O–H bending mode of water (δHOH). Even using a path length of 6 μm, the absorbance of the δHOH mode exceeds 1 OD, which can cause saturation-related distortion of the 2D-IR peak shapes. To avoid this, the sample for the measurement in Figure 1a was held between two CaF2 windows with no spacer. The sample thickness was adjusted manually via tightening of the screw thread holding the front window of the cell in place to obtain an approximate absorbance of ∼0.1 OD for the combination band of the δHOH and librational modes of water at 2130 cm–1 (Figure 1a). Based on the molar absorption coefficient of water, this equates to a sample thickness of ∼2.75 μm.15
Figure 1.
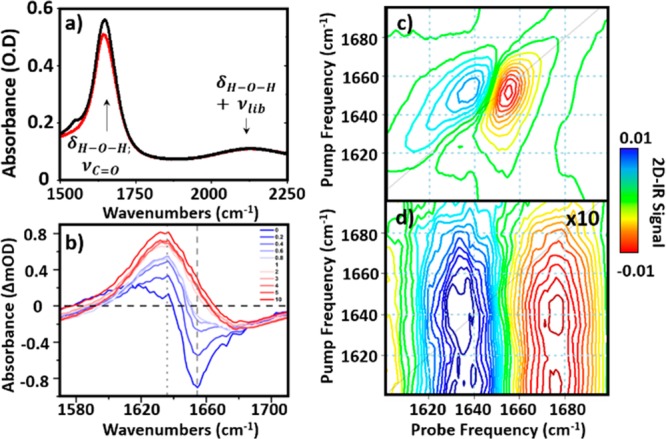
(a) IR absorption spectra of 30 mg/mL BSA in H2O buffer (black) and the H2O buffer only (red). Sample thickness was adjusted manually to achieve an absorbance of ∼0.1 OD at the δHOH + νlib band of water at 2130 cm–1. (b) IR pump–probe spectra of 30 mg/mL BSA in H2O buffer at short (0 ps, blue) and long (10 ps, red) pump–probe time delays. (c and d) The 2D-IR spectrum of 30 mg/mL BSA in H2O buffer at waiting times of (c) 250 fs and (d) 5 ps. Both 2D-IR spectra are plotted using the same color scale (see color bar) (d) is magnified by 10 times.
IR pump–probe spectra of the aqueous BSA solution, under the same sample conditions as the IR absorption measurement, are shown in Figure 1b. At short pump–probe time delays (blue), a negative feature corresponding to the v = 0–1 bleach of the amide I band of BSA is visible at 1650 cm–1. Also present is a positive peak shifted to lower wavenumbers, assigned to the accompanying v = 1–2 transient absorption. Both features decay rapidly with increasing pump–probe time delay, commensurate with the previously reported vibrational relaxation time (T1) of the amide I band of BSA in water (0.78 ps).15 This relaxation leads to loss of the amide I features at time delays greater than 2 ps (Figure 1b, pink) but they are replaced by a broad, positive feature that is assigned to the effects of residual heating of the water caused by the vibrational energy dissipated by the protein. This signal persists to pump–probe time delays well beyond 10 ps (Figure 1b, red), in good agreement with previous studies of the ultrafast response of H2O.22
The 2D-IR spectra of the BSA solution at waiting times (Tw) of 250 fs (Figure 1c) and 5 ps (Figure 1d) show a similar result to the pump–probe data. In the Tw = 250 fs spectrum, peaks due to the v = 0–1 (red) and v = 1–2 (blue) transitions of the amide I band of BSA are clearly visible. They are replaced at Tw = 5 ps by the thermal response of water, which is magnified by a factor of 10 in the figure.23,24
The basis of our new normalization method is that both the amide I and thermal H2O responses in Figure 1b–d originate from similar laser–sample interaction processes, namely, those that give rise to the nonlinear spectroscopic IR pump–probe or 2D-IR signals. Although separated temporally, the magnitudes of the amide I and thermal H2O signals are influenced in an identical manner by both sample-related (concentration, path length) and instrumental factors (laser intensity, beam quality, beam alignment).1,16,17 Thus, the ratio of the magnitudes of the thermal response of water and the resonant amide I response of BSA in each measurement should be constant for a given BSA concentration. When instrumental factors cause changes in the magnitudes of the signals, the two should be linearly correlated. By extension, for a set of samples in which the BSA concentration varies, the ratio of the thermal water response to the BSA amide I signal will depend linearly upon the BSA content of the sample, because the 2D-IR and pump–probe signals scale linearly with concentration.16 The latter being justified because the concentration of water, being the solvent, can be assumed to be constant, allowing the water response to be used to normalize the data for direct comparison of the BSA amide I response. This self-normalization method, as applied here, also assumes that no significant change in secondary structure of BSA occurs that could influence the 2D-IR signal intensity via changes in amide I coupling within the protein.16 It is noted, however, that the normalization method could in principle be used to aid comparisons of samples featuring changes in protein structure with time, for example, as a result of disease progression.
With these factors satisfied, normalization of all spectra to the thermal water response enables the absolute BSA content to be determined taking into account the common instrumental variables. It has been shown previously that, although there is a small degree of spectral overlap of the water and protein pump–probe responses near 1650 cm–1, the instantaneous response of the amide I band of BSA is a factor of 5 greater in magnitude than that of water under these conditions and so the latter is neglected for the purposes of this study.15
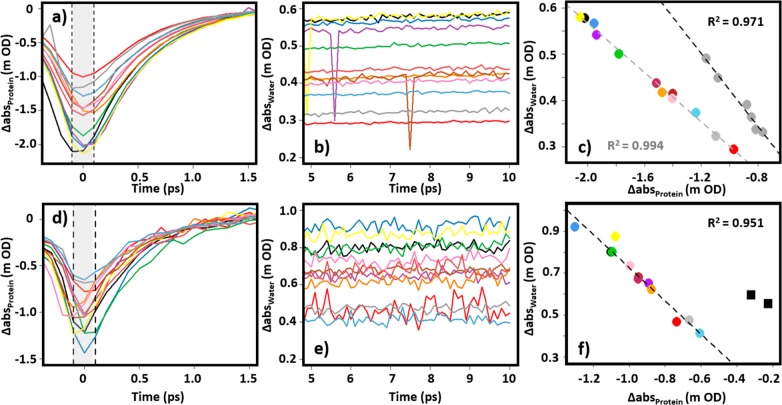
The linear correlation of the protein amide I and water IR pump–probe responses are shown in Figure 2 for data obtained using both the LIFEtime (Figure 2a–c) and ULTRA (d–f) spectrometers. The protein signal amplitude near the peak of the amide I (v = 0–1) response was obtained from an average of the signal at pump–probe time delays of 0 ± 0.1 ps (Figure 2a,d, shaded areas). Plotting this against the average intensity of the water thermal response at 1634 cm–1 between time delays of 5–10 ps (Figure 2b,e) reveals the expected strong, linear, correlation (R2 > 0.95) for both instruments irrespective of BSA concentration (Figure 2c,f).
Figure 2.
(a–c) Vibrational relaxation dynamics obtained from IR pump–probe spectroscopy (LIFEtime instrument) of 50 mg/mL BSA in H2O buffer. (a) Temporal dynamics of the amide I response at 1653 cm–1 at pump–probe delay times <1.5 ps. (b) Water response at 1634 cm–1 at pump–probe delay times from 5 to 10 ps. (c) Linear correlation arising from plotting the water signal averaged between pump–probe delay times of 5–10 ps against the average protein absorbance from pump–probe delay times of ±0.1 ps (shaded area in part a). Results for a BSA concentration of 50 mg/mL are shown as colored circles. Data for 30 mg/mL BSA samples are shown using gray circles. Parts d–f show similar data to that in parts a–c but obtained using the ULTRA instrument and 30 mg/mL BSA in H2O buffer. (d) Temporal dynamics of the amide I response at 1656 cm–1 at pump–probe delay times <1.5 ps. (e) Water response at 1634 cm–1 at pump–probe delay times from 5 to 10 ps. (f) Linear correlation arising from plotting the water signal averaged between 5 and 10 ps against the average protein absorbance from ±0.1 ps (shaded area in part d). In all cases, each data point indicates a different measurement of the same stock solution. Dashed lines indicate linear fits to the data. The black squares in part f indicate results obtained from pure water samples for comparison (see text).
Despite careful attempts to use the tightness of the sample cell to set the absorbance of the δHOH-libration combination band to 0.1 OD in all cases, a large spread of experimental values were obtained for the protein (−2.0 to -0.9 mOD at [BSA] = 50 mg/mL) and thermal water signals (0.3–0.6 mOD) (Figure 2c). These variations of up to 50% in the measured amplitudes reflect not only changes in the path length but also day to day fluctuations in spectrometer alignment and laser intensity. What is clear however is that, although the individual measurements fluctuate, the protein and water thermal response are linearly correlated (Figure 2c,f), independent of the instrument used.
To ascertain that the linear relationship is due to protein content, two samples of H2O were also treated in a similar manner (Figure 2f, squares). The data points lie significantly off the linear region describing the protein samples as would be expected.
To extend the normalization method to 2D-IR spectra of BSA, pairs of spectra at waiting times of 250 fs and 5 ps were obtained from each of the samples (Figure 1). Several different methods were used to extract the protein peak intensity at a Tw value of 250 fs and the thermal water signal at Tw = 5 ps. An example is demonstrated for 2D-IR spectra obtained with both the LIFEtime and ULTRA instruments (Figure 3). Projection of the LIFEtime 2D-IR spectra onto the probe frequency axis of the 2D-IR spectrum (Figure 3a,b) allowed the BSA response to be quantified by averaging the signal in the Tw = 250 fs spectrum over a small frequency range near the peak of the BSA signal (Figure 3a, shaded area). The value of the thermal water response was measured using the Tw = 5 ps spectrum near 1675 cm–1 (Figure 3b, shaded area). The correlation of the signals obtained for 30 and 50 mg/mL samples (gray and colored circles, respectively) is shown in Figure 3c. Although a large spread in absolute values was observed, as for the IR pump–probe data, a clear linear relationship between protein and water signals was present in the data (Figure 3c). Changing the spectral region within the v = 0–1 transition of the amide I band used to obtain the protein signal led to small variations in the linear correlation produced but in the majority of cases the R2 value obtained was >0.9. Comparable data obtained with the ULTRA spectrometer are shown in Figure 3d–f.
Figure 3.
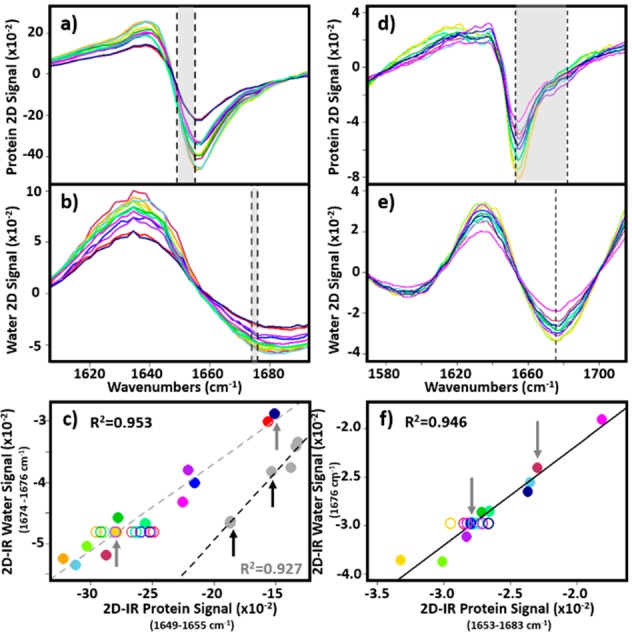
(a–c) Projection of 2D-IR spectra of 50 mg/mL BSA in H2O buffer over pump frequencies between 1580 and 1720 cm–1 onto the probe frequency axis at waiting times of (a) 250 fs showing the protein response and (b) 5 ps showing the water response. (c) Correlation of the water signal between 1674–1676 cm–1 with the protein signal between 1649–1655 cm–1 (shaded areas in parts b and a, respectively). Each solid colored circle indicates an individual measurement. Open circles show the spread of the spectra after scaling to the water response of the gold spectrum (see text). Gray circles show the results obtained using a 30 mg/mL BSA solution. (d–f) Using the ULTRA instrument, the 2D-IR spectra of 30 mg/mL BSA in H2O buffer are projected onto the probe axis at waiting times of (d) 250 fs and (e) 5 ps using the pump frequency range between 1400 and 1700 cm–1. (f) Correlation of the water signal at 1676 cm–1 with the protein signal between 1653 and 1683 cm–1 (shaded area in part d). Open circles show the spread of the spectra after scaling to the water response of the blue spectrum.
The results from both IR pump–probe and 2D-IR experiments show that the intensity of the thermal water response can be used as an internal normalization standard to account for fluctuations in spectrometer performance in both experiments.
The validation of an internal normalization method leads to two powerful applications. First, normalization of spectra from individual measurements provides a basis to extract BSA concentrations directly from 2D-IR spectra. The plots in Figure 3c,f act as calibration curves for 30 and 50 mg/mL BSA samples. This is demonstrated in Figure 4a,b where the averaged protein signals obtained for each BSA concentration using the LIFEtime instrument were used to create a linear calibration plot of 2D-IR protein signal versus BSA concentration. A leave-one-out analysis was then performed by individually omitting each measurement from the creation of the calibration plot and using the result to estimate the concentration of the left out sample. Although this approach is based on only two concentration points, it can be seen that applying the normalization method leads to a significant reduction in the spread of the concentrations (Figure 4b compared to Figure 4a). Using the normalization approach leads to a measurement of the 50 mg/mL BSA concentration accurate to ±4.5 mg/mL (<10%). If similar relationships were produced for a range of BSA concentrations then, for an unknown sample, a given ratio of the water response to the protein signal would yield the BSA concentration. Combining a similar approach using human serum albumin with the previously demonstrated method for measuring the albumin to globulin ratio of blood serum with 2D-IR15 makes it possible to obtain the clinically relevant albumin and globulin concentrations and so the total protein content of the serum from a single 2D-IR measurement within a few seconds.
Figure 4.
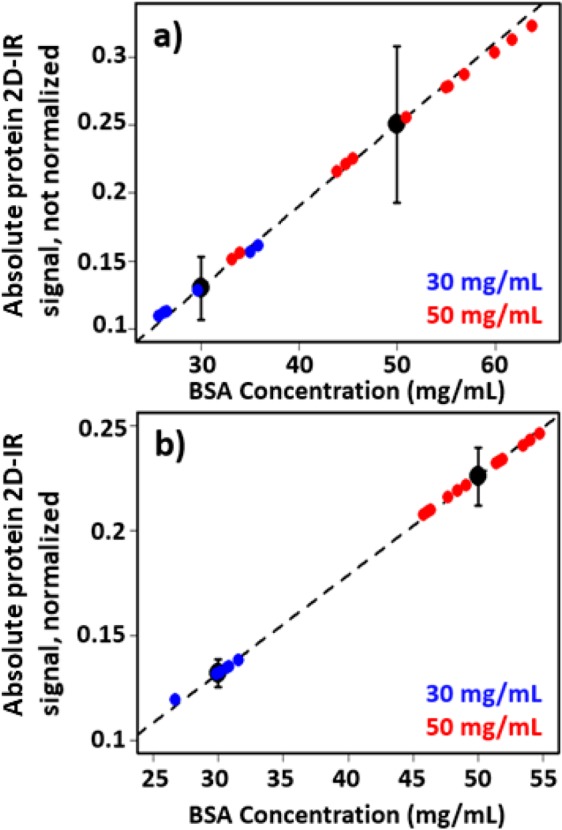
Use of 2D-IR signal of BSA to estimate protein concentration. The average protein 2D-IR signal obtained for two known BSA concentrations (black dots) were used to create a linear calibration plot (dashed line). Each sample in turn was left out of the creation of the calibration plot and the result used to estimate the concentration of the left out sample based upon the protein signal size. The results are plotted as points for 50 mg/mL (red) and 30 mg/mL (blue) BSA concentrations, respectively. Comparing the non-normalized data (a) with the normalized data (b) shows the significant increase in accuracy of the results obtained. Postnormalization shows that the BSA concentrations were obtained accurate to ±9%. The error bars show the range of protein signals measured with (b) and without (a) normalization.
Second, the internal normalization approach can be extended to allow rapid cross-comparison of protein spectra in a high-throughput screening context. For example, an experiment is visualized in which a series of 2D-IR spectra are measured from a range of samples featuring the same protein at the same concentration in aqueous buffer in a complex with a range of alternative ligands (or of the same ligand at a range of concentrations25). In this case, relatively small differences in the spectrum of the protein would be expected as a result of ligand binding, and careful production of difference 2D-IR spectra would be needed to extract relevant information.26 Normalization of the spectra to the thermal water response would not significantly increase the measurement time but would provide an experimentally determined route to difference spectral analysis by reducing the impact of instrumental fluctuations.
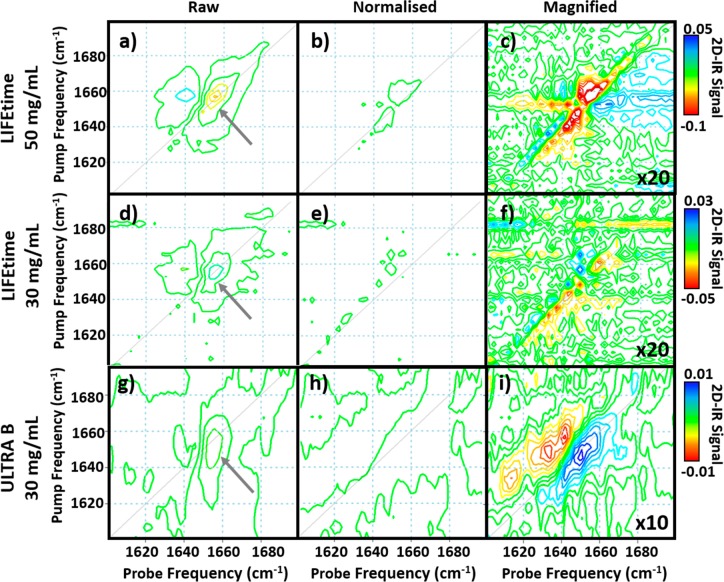
We demonstrate the efficacy of this approach using two BSA 2D-IR spectra from different points in the range of signal amplitudes measured (Figure 3c,f, arrows). Creating difference spectra by simply subtracting one spectrum from the other for pairs of 50 mg/mL (Figure 5a) and 30 mg/mL (Figure 5d) LIFEtime samples, respectively, and Figure 5g for a pair of 30 mg/mL ULTRA samples results in a clearly visible residual BSA signal (Figure 5a,d,g, arrows). This reflects the range of measured values from a common sample arising from instrumental effects. However, normalizing the 2D-IR spectra to the thermal water signal prior to calculating the difference spectrum reduces the residual signal dramatically (Figure 5b,e,h). This is as would be expected for difference spectra comparing two identical samples. Indeed, magnification by a factor of 20 for data obtained using LIFEtime and 10 for data obtained using ULTRA shows how effective the normalized difference spectral measurement approach is (Figure 5c,f,i). For measurements using the ULTRA spectrometer, the lower pulse repetition rate (10 kHz) leads to a slower data acquisition time of ∼20 min per 2D-IR spectrum, as opposed to <1 min using LIFEtime. This has resulted in a less effective subtraction process, which is ascribed to slow changes in the intensity distribution of the broad bandwidth laser pulses during each spectral acquisition. This will not be accounted for by the normalization method, and so we conclude that the normalization approach is best suited to measurement protocols that employ rapid acquisition of 2D-IR spectra.
Figure 5.
(a) 2D-IR difference spectra of two 50 mg/mL BSA samples obtained using LIFEtime before any scaling. (b) 2D-IR difference spectra obtained from the two spectra after scaling to the water response. (c) Part b magnified by 20 times. Color scale is shown. (d) 2D-IR difference spectra of two 30 mg/mL BSA samples obtained using LIFEtime before any scaling. (e) 2D-IR difference spectra of the same two spectra after scaling to the water response. (f) Part e magnified by 20 times. Color scale is shown. (g) 2D-IR difference spectra of two 30 mg/mL BSA samples obtained using ULTRA before any scaling. (h) 2D-IR difference spectra of the same two spectra after scaling to the water response. (i) Part h magnified by 10 times. Color scale is shown.
To show that this approach works for all of the samples studied, all 2D-IR spectra of 50 mg/mL BSA samples obtained using LIFEtime were normalized to the water response of one spectrum and the protein signals replotted versus the normalized water signals in Figure 3c (open circles). The same process was repeated for all 2D-IR spectra of 30 mg/mL BSA samples obtained using ULTRA (Figure 3f, open circles). Now, all of the samples show the same water signal (vertical axis), as expected following normalization, but the spread of protein signal sizes along the horizontal axis is significantly reduced.
Concluding Remarks
We have demonstrated a method for using the thermal response of water to normalize 2D-IR spectra of proteins in aqueous solutions, providing a route to producing difference spectra with reduced impact from instrumental variations. Furthermore, this goes significantly beyond recent work showing that 2D-IR can be applied to study aqueous (H2O) biofluids in transmission without prior sample preparation steps by adding the ability to determine absolute protein concentrations via the amide I band, which cannot be achieved using absorption spectroscopy methods.
It is noted that improvements in sample cell design could be made to limit the path length variability as, for example, when using standard transmission cells. However, the issues of spectrometer alignment and laser fluctuation would remain and therefore our simple analytical approach provides a means of avoiding complex and costly engineering solutions. While current 2D-IR spectrometers are not designed for routine high-throughput work, we believe that the type of application demonstrated here serves to motivate a trajectory toward faster, more hands-free 2D-IR data acquisition, stimulating more commercially available instruments. Finally, we believe the advanced capability of 2D-IR to analyze biofluids has much potential for further analytical applications able to exploit the additional information content of 2D-IR spectroscopy in comparison to IR absorption in the healthcare arena.
Acknowledgments
Funding is gratefully acknowledged from STFC for programme access to the Central Laser Facility systems.
Author Contributions
The manuscript was written through contributions of all authors.
The authors declare no competing financial interest.
References
- Hamm P.; Zanni M. T.. Concepts and Method of 2D Infrared Spectroscopy; Cambridge University Press: Cambridge, U.K., 2011. [Google Scholar]
- Simpson N.; Hunt N. T. Ultrafast 2D-IR spectroscopy of haemoproteins. Int. Rev. Phys. Chem. 2015, 34, 361–383. 10.1080/0144235X.2015.1061793. [DOI] [Google Scholar]
- Rubtsova N. I.; Rubtsov I. V. Vibrational energy transport in molecules studied by relaxation-assisted two-dimensional infrared spectroscopy. Annu. Rev. Phys. Chem. 2015, 66, 717–738. 10.1146/annurev-physchem-040214-121337. [DOI] [PubMed] [Google Scholar]
- Kim H.; Cho M. Infrared probes for studying the structure and dynamics of biomolecules. Chem. Rev. 2013, 113, 5817–5847. 10.1021/cr3005185. [DOI] [PubMed] [Google Scholar]
- Hunt N. T. Ultrafast 2D-IR spectroscopy – Applications to biomolecules. Chem. Soc. Rev. 2009, 38, 1837–1848. 10.1039/b819181f. [DOI] [PubMed] [Google Scholar]
- Hithell G.; Ramakers L. A. I.; Burley G. A.; Hunt N. T., Applications of 2D-IR spectroscopy to probe the structural dynamics of DNA. In Frontiers in Molecular Spectroscopy; Laane J., Ed.; Elsevier, 2018; pp 77–100. [Google Scholar]
- Hunt N. T. Transient 2D-IR spectroscopy of inorganic excited states. Dalton Trans 2014, 43, 17578–17589. 10.1039/C4DT01410C. [DOI] [PubMed] [Google Scholar]
- Adamczyk K.; Candelaresi M.; Robb K.; Gumiero A.; Walsh M. A.; Parker A. W.; Hoskisson P. A.; Tucker N. P.; Hunt N. T. Measuring protein dynamics with ultrafast two-dimensional infrared spectroscopy. Meas. Sci. Technol. 2012, 23, 062001. 10.1088/0957-0233/23/6/062001. [DOI] [Google Scholar]
- Ghosh A.; Ostrander J. S.; Zanni M. T. Watching proteins wiggle: Mapping structures with two dimensional infrared spectroscopy. Chem. Rev. 2017, 117, 10726–10759. 10.1021/acs.chemrev.6b00582. [DOI] [PMC free article] [PubMed] [Google Scholar]
- Shim S. H.; Zanni M. T. How to turn your pump–probe instrument into a multidimensional spectrometer: 2D IR and Vis spectroscopies via pulse shaping. Phys. Chem. Chem. Phys. 2009, 11, 748–761. 10.1039/B813817F. [DOI] [PMC free article] [PubMed] [Google Scholar]
- Strasfeld D. B.; Ling Y. L.; Shim S. H.; Zanni M. T. Tracking fiber formation in human islet amyloid polypeptide with automated 2D-IR Spectroscopy. J. Am. Chem. Soc. 2008, 130, 6698. 10.1021/ja801483n. [DOI] [PMC free article] [PubMed] [Google Scholar]
- Donaldson P. M.; Greetham G. M.; Shaw D. J.; Parker A. W.; Towrie M. A 100 kHz pulse shaping 2D-IR spectrometer based on dual Yb:KGW amplifiers. J. Phys. Chem. A 2018, 122, 780–787. 10.1021/acs.jpca.7b10259. [DOI] [PubMed] [Google Scholar]
- Tracy K. M.; Barich M. V.; Carver C. L.; Luther B. M.; Krummel A. T. High-throughput two-dimensional infrared (2D IR) spectroscopy achieved by interfacing microfluidic technology with a high repetition rate 2D IR spectrometer. J. Phys. Chem. Lett. 2016, 7, 4865–4870. 10.1021/acs.jpclett.6b01941. [DOI] [PubMed] [Google Scholar]
- Fritzsch R.; Donaldson P. M.; Greetham G. M.; Towrie M.; Parker A. W.; Baker M. J.; Hunt N. T. Rapid screening of DNA-ligand complexes via 2D-IR spectroscopy and ANOVA-PCA. Anal. Chem. 2018, 90, 2732–2740. 10.1021/acs.analchem.7b04727. [DOI] [PubMed] [Google Scholar]
- Hume S.; Hithell G.; Greetham G. M.; Donaldson P. M.; Towrie M.; Parker A. W.; Baker M. J.; Hunt N. T. Measuring proteins in H2O with 2D-IR spectroscopy. Chem. Sci. 2019, 10, 6448–6456. 10.1039/C9SC01590F. [DOI] [PMC free article] [PubMed] [Google Scholar]
- Grechko M.; Zanni M. T. Quantification of transition dipole strengths using 1D and 2D spectroscopy for the identification of molecular structures via exciton delocalization: Application to alpha-helices. J. Chem. Phys. 2012, 137, 184202. 10.1063/1.4764861. [DOI] [PMC free article] [PubMed] [Google Scholar]
- Dunkelberger E. B.; Grechko M.; Zanni M. T. Transition dipoles from 1D and 2D infrared spectroscopy help reveal the secondary structures of proteins: Application to amyloids. J. Phys. Chem. B 2015, 119, 14065–14075. 10.1021/acs.jpcb.5b07706. [DOI] [PMC free article] [PubMed] [Google Scholar]
- Baiz C. R.; Peng C. S.; Reppert M. E.; Jones K. C.; Tokmakoff A. Coherent two-dimensional infrared spectroscopy: Quantitative analysis of protein secondary structure in solution. Analyst 2012, 137, 1793–1799. 10.1039/c2an16031e. [DOI] [PubMed] [Google Scholar]
- Minnes L.; Shaw D. J.; Cossins B.; Donaldson P. M.; Greetham G. M.; Towrie M.; Parker A. W.; Baker M. J.; Henry A.; Taylor R.; Hunt N. T. Quantifying secondary structure changes in calmodulin using 2D-IR spectroscopy. Anal. Chem. 2017, 89, 10898–10906. 10.1021/acs.analchem.7b02610. [DOI] [PubMed] [Google Scholar]
- Greetham G. M.; Burgos P.; Cao Q.; Clark I. P.; Codd P. S.; Farrow R. C.; George M. W.; Kogimtzis M.; Matousek P.; Parker A. W.; Pollard M. R.; Robinson D. A.; Xin Z.-J.; Towrie M. ULTRA: A unique instrument for time-resolved spectroscopy. Appl. Spectrosc. 2010, 64, 1311–1319. 10.1366/000370210793561673. [DOI] [PubMed] [Google Scholar]
- Shim S. H.; Strasfeld D. B.; Ling Y. L.; Zanni M. T. Automated 2D IR spectroscopy using a mid-IR pulse shaper and application of this technology to the human islet amyloid polypeptide. Proc. Natl. Acad. Sci. U. S. A. 2007, 104, 14197–14202. 10.1073/pnas.0700804104. [DOI] [PMC free article] [PubMed] [Google Scholar]
- Ashihara S.; Huse N.; Espagne A.; Nibbering E. T. J.; Elsaesser T. Vibrational couplings and ultrafast relaxation of the O-H bending mode in liquid H2O. Chem. Phys. Lett. 2006, 424, 66–70. 10.1016/j.cplett.2006.04.051. [DOI] [Google Scholar]
- Kraemer D.; Cowan M. L.; Paarmann A.; Huse N.; Nibbering E. T. J.; Elsaesser T.; Miller R. J. D. Temperature dependence of the two-dimensional infrared spectrum of liquid H2O. Proc. Natl. Acad. Sci. U. S. A. 2008, 105, 437–442. 10.1073/pnas.0705792105. [DOI] [PMC free article] [PubMed] [Google Scholar]
- Chuntonov L.; Kumar R.; Kuroda D. G. Non-linear infrared spectroscopy of the water bending mode: direct experimental evidence of hydration shell reorganization?. Phys. Chem. Chem. Phys. 2014, 16, 13172–13181. 10.1039/C4CP00643G. [DOI] [PMC free article] [PubMed] [Google Scholar]
- Johnson P. J. M.; Koziol K. L.; Hamm P. Quantifying biomolecular recognition with site-specific 2D infrared probes. J. Phys. Chem. Lett. 2017, 8, 2280–2284. 10.1021/acs.jpclett.7b00742. [DOI] [PubMed] [Google Scholar]
- Shaw D. J.; Hill R. E.; Simpson N.; Husseini F. S.; Robb K.; Greetham G. M.; Towrie M.; Parker A. W.; Robinson D.; Hirst J. D.; Hoskisson P. A.; Hunt N. T. Examining the role of protein structural dynamics in drug resistance in Mycobacterium tuberculosis. Chem. Sci. 2017, 8, 8384–8399. 10.1039/C7SC03336B. [DOI] [PMC free article] [PubMed] [Google Scholar]


