

Abstract
In modern biochemistry, protein stability and ligand interactions are of high interest. These properties are often studied with methods requiring labeled biomolecules, as the existing methods utilizing luminescent external probes suffer from low sensitivity. Currently available label-free technologies, e.g., thermal shift assays, circular dichroism, and differential scanning calorimetry, enable studies on protein unfolding and protein–ligand interactions (PLI). Unfortunately, the required micromolar protein concentration increases the costs and predisposes these methods for spontaneous protein aggregation. Here, we report a time-resolved luminescence method for protein unfolding and PLI detection with nanomolar sensitivity. The Protein-Probe method is based on highly luminescent europium chelate-conjugated probe, which is the key component in sensing the hydrophobic regions exposed to solution after protein unfolding. With the same Eu-probe, we also demonstrate ligand-interaction induced thermal stabilization with model proteins. The developed Protein-Probe method provides a sensitive approach overcoming the problems of the current label-free methodologies.
Macromolecular function and activity depend on their structure and stability in a given environment. These properties are affected not only by multiple different biological factors, e.g., ions, small molecules, protein complexes, but also by chemical and physical factors such as pH, temperature, and mechanical stress.1−5 Stable macromolecular structures are highly important when providing consistent industrial products, storing precious components, obtaining functional information for native and synthetic macromolecules, and administrating intact high-quality biologics as medicine.6,7 Nature has evolved mechanisms to improve the stability of macromolecules in their natural environment, but researchers have also enabled macromolecule structure stabilization through knowledge-driven mechanisms.8 Multiple strategies have been designed to follow protein interactions and stability using labeled macromolecules such as in Förster resonance energy transfer (FRET) assays.9−12 Nowadays, label-free methods utilizing target protein intrinsic properties or external probes have become especially popular. The most widely used label-free method is differential scanning calorimetry (DSC), referred as a “gold standard” for thermal stability analysis.13,14 Circular dichroism (CD), on the other hand, provides more information on the target molecule conformation and is also applicable to determine protein stability.15,16 In some label-free methods, an external probe is used to detect structural integrity and interactions of the target protein. This class of methods is called thermal stability or shift assays (TSA). These methods are based on inherent fluorescence of tryptophan moieties or external probes, e.g., SYPRO Orange and 1-anilinonaphthalene-8-sulfonic acid.17−20 In aqueous solution, fluorescence of these external dyes is strongly quenched by water and increased as dyes bind to the revealed hydrophobic surface of unfolded protein. TSA is typically applied to characterize protein–ligand interaction (PLI) with changing thermal stability compared to the protein without the bound ligand.21,22 However, all of these methods suffer from micromolar sensitivity, increasing the protein consumption and costs and exposing the method for, e.g., spontaneous protein aggregation.
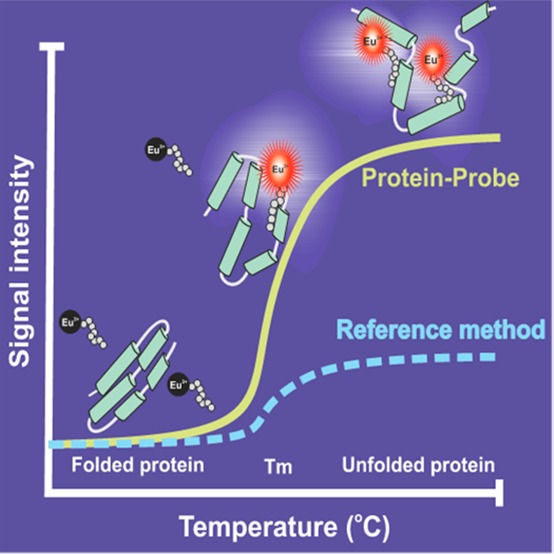
To address these issues limiting the functionality of the current methods, we have developed a thermal analysis method for proteins and PLIs utilizing time-resolved luminescence (TRL) detection. Stable lanthanide chelates have previously shown to improve the detection sensitivity compared to conventional fluorochromes in bulk measurements.23−25 Thus, we hypothesized that lanthanide chelates enabling TRL-signal detection can overcome problems related to high protein concentrations in existing technologies. In the developed Protein-Probe method, Eu3+-chelate was conjugated to the N-terminus of the peptide sequence serving as a sensor in the analysis. The peptide was negatively charged possessing high water-solubility due to glutamic-acid-rich residues. This Eu-probe has minimal interaction with low concentration of intact protein providing a low TRL-signal when assayed in the modulation solution (Figure 1). Immediate increase in the TRL-signal is monitored after Eu-probe interaction with the thermally denatured protein. This is due to an enhanced probe interaction with the exposed hydrophobic core of the protein.
Figure 1.
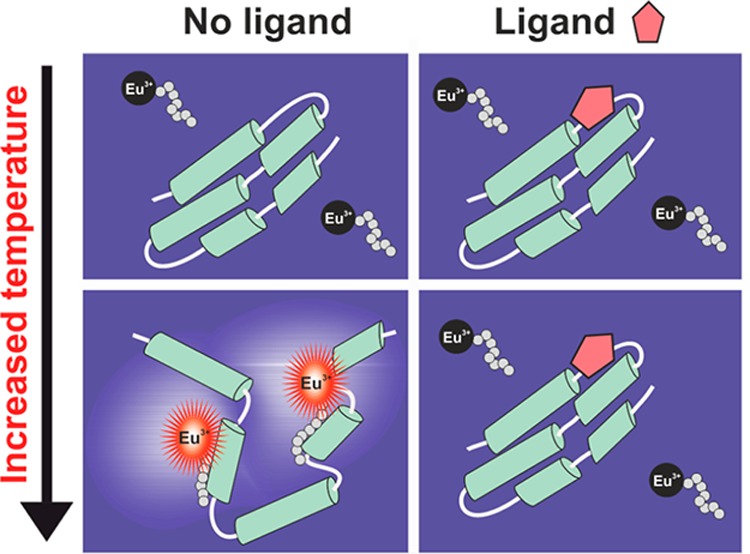
Principle of the label-free Protein-Probe method. In the presence of native intact protein, the TRL-signal of the Eu-probe is low when monitored in the modulation solution. Thermal denaturation induces the Eu-probe interaction with the hydrophobic core of the target, increasing the monitored TRL-signal. Ligand-interaction stabilizes the protein structure and increases the melting temperature, enabling the monitoring of protein–ligand interaction as a result of a thermal shift.
To demonstrate the Protein-Probe method applicability, we measured a series of assays with selected model proteins and PLI pairs. Eu-probe functionality was first tested with a single model protein, monoclonal IgG1 antibody (anti-h TSH 5409). IgG1 antibody was selected since there is a wide range of studies performed with antibodies and a constant need to study and improve their stability. The Protein-Probe assay was performed with a two-step protocol where the studied protein in 8 μL of sample buffer was heated to the desired temperature, before adding the Eu-probe-containing modulation solution in 65 μL. By adding the modulation solution in high volume, the protein solution was rapidly cooled to RT, reducing potential temperature related variation. The two-step protocol also enabled the study of different sample buffer compositions, e.g., pH and salt concentration.
During the first tests, the Eu-probe was found to prefer acidic pH in signal modulation, while the sample during the heating cycle was kept neutral (Figure 2A). In the modulation solution with pH < 5, the Eu-probe signal responded to the temperature-denatured IgG1 (80 nM). The highest signal-to-background (S/B) ratio after denaturation was monitored with the modulation solution at pH 4. Lowering the pH further, to below 3, already had a detrimental effect on the S/B ratio. The data indicates that protonation of the acidic amino acid residues promotes hydrophobicity of the peptides and the target protein, improving the Eu-probe interaction with the target and thus resulting in increased TRL-signal. We did not observe any temperature independent IgG1 unfolding even at pH 4, which is already below the pK values of the acidic amino acid residues (Figure 2A). The Eu-probe was also found to be stable at pH 4 and above (Figure S1). Thus, pH 4, with the highest S/B ratio of 65, was selected for all subsequent tests.
Figure 2.

Functionality of the Protein-Probe thermal stability assay. A) Eu-probe (1 nM) response to 80 nM IgG1 was monitored at various pH by comparing signals obtained at room temperature (RT) and 80 °C. At RT, the Eu-probe does not bind to IgG1 leading to the low TRL-signal, whereas at 80 °C, the high TRL-signal was monitored. The highest S/B ratio (80 °C/RT) was obtained at pH 4. B) TRL-signals at RT were stable over the 60 min time period when monitored without (black) or with 7 (red), 21 (blue), 62 (magenta), and 128 nM (green) of IgG1. C) Temperature melting curves for IgG1 were measured up to 80 °C with Protein-Probe (black, 80 nM IgG1) and SYPRO Orange (red, 2 μM IgG1). The calculated Tm values were essentially equal between these two methods. D) Based on the IgG1 titration (0–5 μM), 50-fold improved sensitivity was calculated with the Protein-Probe (black) compared to SYPRO Orange (red) at 80 °C, as calculated from the S/B ratio of 3. Data represent mean ± SD (n = 3).
To understand the functionality of the method further, we tested the method robustness by varying the protein sample buffer. Tris, HEPES, and PBS with and without Triton X-100 were tested with 80 nM IgG1 at 80 °C without a major difference between the buffers (Figure S2). In all buffers, the IgG1 gave an S/B ratio between 19 and 50, being the highest with Tris and the lowest with HEPES. The most obvious reason for the modest sample buffer effect is the high volume of the modulation solution, which overrides the effect of the sample buffer and equalizes conditions for the detection. Also, the sample buffer was not supplemented with components expected to change IgG1 stability. However, we found more differences in repeatability related to the sample buffer. The lowest variation was measured with 0.1× PBS with 0.001% Triton X-100, which was therefore selected for all subsequent tests (Figure S2). Next, we studied the signal stability of the Eu-probe in the modulation solution using varying IgG1 concentrations but found no major changes in TRL-signal levels over a 60 min time period at any of the tested IgG1 concentrations (Figure 2B). The TRL-signal also responded to IgG1 concentration gradually. Based on this, we selected a 5 min time point after addition of the modulation solution for all forthcoming TRL-signal measurements.
The IgG1 denaturation was further performed using temperature ramping up to 80 °C. Melting curves were carried out in parallel with the widely used SYPRO Orange method as a reference. The curves were highly similar as the Tm values observed with the Protein-Probe and SYPRO Orange were 67.0 and 66.6 °C, respectively (Figure 2C). When these methods were compared for sensitivity at 80 °C, corresponding to S/B = 3 in IgG1 titration, a 50-fold improvement was observed with the Protein-Probe (Figure 2D). The calculated thresholds based on the S/B ratio were at 3.0 and 144 nM using the Protein-Probe or SYPRO Orange, respectively. All tests were performed using the same sample buffer. The improvement in sensitivity with the Protein-Probe method is significant, providing an affordable assay option and reducing the risk for spontaneous aggregation. In addition, the coefficient of variation (CV%) of the sample replicates was on average 2% with the Protein-Probe, compared to 10% variation monitored with the SYPRO Orange. This further simplifies the result interpretation and enables the detection of minor changes in Tm. To investigate the reproducibility of the Protein-Probe assay, we monitored melting curves using ten individual IgG1 dilutions (80 nM) with three replicates of each dilution (Figure S3). The average Tm was 70.9 °C with CV under 1%. The average CV between the dilutions was 8%, and between the replicates the average CV was 4%.
Next, we determined melting curves for four TSA model proteins: malate dehydrogenase (MDH), carbonic anhydrase (CA), IgG1, and streptavidin (SA). These proteins were selected based on their varying molecular weights (MWs), and tests were performed using 2–5 °C temperature step intervals. The observed Tm values for MDH, CA, IgG1, and SA were 44.6, 67.9, 70.7, and 75.7 °C, respectively (Table 1 and Figure S4). Measured Tm values for these proteins with varying MW and isoelectric points (pIs) were comparable to those published previously (Table 1).26−29 Thus, the method is expected to monitor inherent melting properties of different proteins.
Table 1. Protein Properties and the Obtained Melting Temperatures.
|
Tm |
|||||||
|---|---|---|---|---|---|---|---|
| without ligand |
with ligand |
||||||
| Mw (kDa) | pI | ng per well | measd | lit. | measd | lit. | |
| CA | 30 | 6.6 | 48 | 67.9 ± 0.9 | 71.8a | 69.8 ± 0.7 | 73.2a |
| SA | 53 | 5 | 170 | 75.7 ± 0.1 | 75.5b | >90 | 112b |
| MDH | 70 | 6.1–6.4 | 51 | 44.6 ± 0.5 | 46c | ND | ND |
| IgG1 | 150 | 6.5–9 | 60 | 70.7 ± 0.2 | 71d | ND | ND |
2 μM CA(II) in 100 mM Tris buffer (pH 7.5) with 0.36 μM AZA using absorbance 280 measurement.
66 μM SA in 100 mM phosphate buffer (pH 7.4) with 132 μM biotin using DSC.
0.7 μM MDH in 20 mM sodium phosphate buffer (pH 7.0) using CD spectroscopy.
130 μM IgG in 10 mM phosphate buffer (pH 8.1) using DSC.
As the Protein-Probe method responded well to the used individual proteins, we next determined its functionality in protein–ligand interaction assay (PLI). As targets, we selected two highly studied PLI pairs, which, according to the literature, possess modest and extremely large thermal shift upon ligand interaction. Acetazolamide (AZA) is a potent inhibitor of CA at low nanomolar range, and it is known to increase Tm for approximately 2 degrees when bound to CA.27,28 Biotin is known to have a femtomolar dissociation constant to tetrameric SA, and it highly stabilizes the SA structure.26 We first performed ligand titrations with AZA (0–10 μM) and biotin (0–20 μM) with constant CA (200 nM) and SA (400 nM) concentrations, respectively. Protein concentrations were selected to provide sufficient TRL-signal change, which is to some extent protein-dependent. Based on the Tm values observed before (Figure S3), titrations were carried out at selected temperatures, 70 °C for CA and 95 °C for SA. Ligand titration showed concentration-dependent stabilization in stoichiometry with protein concentration, which was expected as the ligand affinity was below the used protein concentration (Figure 3A). Monitored EC50 values for AZA and biotin were 248 nM and 597 nM, respectively. Based on this data, saturating AZA and biotin concentrations were selected for the stability shift determination. The detected melting curves of CA and SA showed a clear thermal shift compared to individual proteins (Figure 3B). The ΔTm values for CA and SA were 2.1 and >15 °C higher with AZA and biotin compared to individual proteins, respectively (Table 1 and Figure 3B). The melting point for the biotin–SA complex could not be determined exactly as it has been reported to be above 100 °C, which was not measurable with our test setup.26
Figure 3.

Protein–ligand interaction (PLI) detection. A) Biotin (black) and AZA (magenta) were titrated with a constant concentration of SA (400 nM) and CA (200 nM), respectively, using a 1 nM Eu-probe. The monitored EC50 values with both ligands are in stoichiometry with their target proteins. B) Tm values for SA (red, 400 nM) and CA (blue, 200 nM) were monitored with and without the saturating ligand concentration of biotin (black 10 μM) and AZA (magenta, 5 μM), respectively. Data represent mean ± SD (n = 3).
Based on the presented data with the model proteins, Protein-Probe has demonstrated to be a highly efficient option to replace SYPRO Orange and other external probes in TSA type protein stability and PLI assays. Due to the increased sensitivity and TRL-signal detection, the developed method enables the use of low protein concentration, thus reducing aggregation and lowering the costs and inhibitor-derived artifacts. We have shown the method functionality with multiple different types of proteins varying in terms of MW and pI. We expect the developed Protein-Probe method to be applicable to other targets by simply adjusting the target protein concentration to provide a detectable TRL-signal.
In summary, we have developed an ultrasensitive label-free method for protein stability and PLI detection using a novel external Eu-probe and TRL-signal detection. In the presented Protein-Probe method, the Eu-probe interacts with the unfolded target protein providing an increasing TRL-signal when assayed in the modulation solution at low pH. Compared to the existing technologies such as thermofluor with SYPRO Orange dye, a 50-fold improved sensitivity was detected. High sensitivity reduces the method cost and decreases adverse effects, such as spontaneous aggregation. This improves the solidity of the acquired data. In addition to protein stability, we further successfully presented a thermal shift assay in PLI with two model protein–ligand pairs. The method has high potential to be a label-free platform for protein stability and PLI monitoring. Further studies are required to demonstrate the applicability, for example, to monitor protein–protein interactions.
Acknowledgments
This work was supported by the Academy of Finland (296225/K.K., 323433/K.K., and 296093/H.H.), the Vilho, Yrjö and Kalle Väisälä foundation (V.E.), the Drug Research Doctoral Programme at the University of Turku, and the University of Turku.
Supporting Information Available
The Supporting Information is available free of charge at https://pubs.acs.org/doi/10.1021/acs.analchem.9b05712.
Materials and methods and additional graphs (PDF)
Author Contributions
All authors have given approval to the final version of the manuscript.
The authors declare no competing financial interest.
Supplementary Material
References
- Brooijmans N.; Sharp K. A.; Kuntz I. D. Stability of Macromolecular Complexes. Proteins: Struct., Funct., Genet. 2002, 48 (4), 645–653. 10.1002/prot.10139. [DOI] [PubMed] [Google Scholar]
- Du X.; Li Y.; Xia Y. L.; Ai S. M.; Liang J.; Sang P.; Ji X. L.; Liu S. Q. Insights into Protein–Ligand Interactions: Mechanisms, Models, and Methods. Int. J. Mol. Sci. 2016, 17, 144. 10.3390/ijms17020144. [DOI] [PMC free article] [PubMed] [Google Scholar]
- Petukh M.; Alexov E. Ion Binding to Biological Macromolecules. Asian J. Phys. Int. Q. Res. J. 2014, 23 (5), 735–744. [PMC free article] [PubMed] [Google Scholar]
- Talley K.; Alexov E. On the PH-Optimum of Activity and Stability of Proteins. Proteins: Struct., Funct., Genet. 2010, 78 (12), 2699–2706. 10.1002/prot.22786. [DOI] [PMC free article] [PubMed] [Google Scholar]
- Zbacnik T. J.; Holcomb R. E.; Katayama D. S.; Murphy B. M.; Payne R. W.; Coccaro R. C.; Evans G. J.; Matsuura J. E.; Henry C. S.; Manning M. C. Role of Buffers in Protein Formulations. J. Pharm. Sci. 2017, 106, 713–733. 10.1016/j.xphs.2016.11.014. [DOI] [PubMed] [Google Scholar]
- Frokjaer S.; Otzen D. E. Protein Drug Stability: A Formulation Challenge. Nat. Rev. Drug Discovery 2005, 4, 298–306. 10.1038/nrd1695. [DOI] [PubMed] [Google Scholar]
- Manning M. C.; Chou D. K.; Murphy B. M.; Payne R. W.; Katayama D. S. Stability of Protein Pharmaceuticals: An Update. Pharm. Res. 2010, 27, 544–575. 10.1007/s11095-009-0045-6. [DOI] [PubMed] [Google Scholar]
- Kazlauskas R. Engineering More Stable Proteins. Chem. Soc. Rev. 2018, 47 (24), 9026–9045. 10.1039/C8CS00014J. [DOI] [PubMed] [Google Scholar]
- Ergin E.; Dogan A.; Parmaksiz M.; Elçin A.; Elçin Y. Time-Resolved Fluorescence Resonance Energy Transfer [TR-FRET] Assays for Biochemical Processes. Curr. Pharm. Biotechnol. 2016, 17 (14), 1222–1230. 10.2174/1389201017666160809164527. [DOI] [PubMed] [Google Scholar]
- Lee M. M.; Peterson B. R. Quantification of Small Molecule–Protein Interactions Using FRET between Tryptophan and the Pacific Blue Fluorophore. ACS Omega 2016, 1 (6), 1266–1276. 10.1021/acsomega.6b00356. [DOI] [PMC free article] [PubMed] [Google Scholar]
- Okamoto K.; Sako Y. Recent Advances in FRET for the Study of Protein Interactions and Dynamics. Curr. Opin. Struct. Biol. 2017, 46, 16–23. 10.1016/j.sbi.2017.03.010. [DOI] [PubMed] [Google Scholar]
- Schuler B.; Eaton W. A. Protein Folding Studied by Single-Molecule FRET. Curr. Opin. Struct. Biol. 2008, 18, 16–26. 10.1016/j.sbi.2007.12.003. [DOI] [PMC free article] [PubMed] [Google Scholar]
- Johnson C. M. Differential Scanning Calorimetry as a Tool for Protein Folding and Stability. Arch. Biochem. Biophys. 2013, 531, 100–109. 10.1016/j.abb.2012.09.008. [DOI] [PubMed] [Google Scholar]
- Lang B. E.; Cole K. D. Differential Scanning Calorimetry and Fluorimetry Measurements of Monoclonal Antibodies and Reference Proteins: Effect of Scanning Rate and Dye Selection. Biotechnol. Prog. 2017, 33 (3), 677–686. 10.1002/btpr.2464. [DOI] [PubMed] [Google Scholar]
- Matsuo K.; Sakurada Y.; Yonehara R.; Kataoka M.; Gekko K. Secondary-Structure Analysis of Denatured Proteins by Vacuum-Ultraviolet Circular Dichroism Spectroscopy. Biophys. J. 2007, 92 (11), 4088–4096. 10.1529/biophysj.106.103515. [DOI] [PMC free article] [PubMed] [Google Scholar]
- Siligardi G.; Hussain R.; Patching S. G.; Phillips-Jones M. K. Ligand- and Drug-Binding Studies of Membrane Proteins Revealed through Circular Dichroism Spectroscopy. Biochim. Biophys. Acta, Biomembr. 2014, 1838, 34–42. 10.1016/j.bbamem.2013.06.019. [DOI] [PubMed] [Google Scholar]
- Hawe A.; Sutter M.; Jiskoot W. Extrinsic Fluorescent Dyes as Tools for Protein Characterization. Pharm. Res. 2008, 25, 1487–1499. 10.1007/s11095-007-9516-9. [DOI] [PMC free article] [PubMed] [Google Scholar]
- Lavinder J. J.; Hari S. B.; Sullivan B. J.; Magliery T. J. High-Throughput Thermal Scanning: A General, Rapid Dye-Binding Thermal Shift Screen for Protein Engineering. J. Am. Chem. Soc. 2009, 131 (11), 3794–3795. 10.1021/ja8049063. [DOI] [PMC free article] [PubMed] [Google Scholar]
- Pantoliano M. W.; Petrella E. C.; Kwasnoski J. D.; Lobanov V. S.; Myslik J.; Graf E.; Carver T.; Asel E.; Springer B. A.; Lane P.; et al. High-Density Miniaturized Thermal Shift Assays as a General Strategy for Drug Discovery. J. Biomol. Screening 2001, 6 (6), 429–440. 10.1177/108705710100600609. [DOI] [PubMed] [Google Scholar]
- Semisotnov G. V.; Rodionova N. A.; Razgulyaev O. I.; Uversky V. N.; Gripas’ A. F.; Gilmanshin R. I. Study of the “Molten Globule” Intermediate State in Protein Folding by a Hydrophobic Fluorescent Probe. Biopolymers 1991, 31 (1), 119–128. 10.1002/bip.360310111. [DOI] [PubMed] [Google Scholar]
- Grøftehauge M. K.; Hajizadeh N. R.; Swann M. J.; Pohl E. Protein-Ligand Interactions Investigated by Thermal Shift Assays (TSA) and Dual Polarization Interferometry (DPI). Acta Crystallogr., Sect. D: Biol. Crystallogr. 2015, 71, 36–44. 10.1107/S1399004714016617. [DOI] [PMC free article] [PubMed] [Google Scholar]
- Huynh K.; Partch C. L. Analysis of Protein Stability and Ligand Interactions by Thermal Shift Assay. Curr. Protoc. protein Sci. 2015, 79, 28.9.1–28.9.14. 10.1002/0471140864.ps2809s79. [DOI] [PMC free article] [PubMed] [Google Scholar]
- Hagan A. K.; Zuchner T. Lanthanide-Based Time-Resolved Luminescence Immunoassays. Anal. Bioanal. Chem. 2011, 400, 2847–2864. 10.1007/s00216-011-5047-7. [DOI] [PMC free article] [PubMed] [Google Scholar]
- Hemmilä I.; Laitala V. Progress in Lanthanides as Luminescent Probes. J. Fluoresc. 2005, 15 (4), 529–542. 10.1007/s10895-005-2826-6. [DOI] [PubMed] [Google Scholar]
- Selvin P. R. Principles and Biophysical Applications of Lanthanide-Based Probes. Annu. Rev. Biophys. Biomol. Struct. 2002, 31, 275–302. 10.1146/annurev.biophys.31.101101.140927. [DOI] [PubMed] [Google Scholar]
- González M.; Argaraña C. E.; Fidelio G. D. Extremely High Thermal Stability of Streptavidin and Avidin upon Biotin Binding. Biomol. Eng. 1999, 16 (1–4), 67–72. 10.1016/S1050-3862(99)00041-8. [DOI] [PubMed] [Google Scholar]
- Jaindl M.; Popp M. Cyclitols Protect Glutamine Synthetase and Malate Dehydrogenase against Heat Induced Deactivation and Thermal Denaturation. Biochem. Biophys. Res. Commun. 2006, 345 (2), 761–765. 10.1016/j.bbrc.2006.04.144. [DOI] [PubMed] [Google Scholar]
- Safarian S.; Bagheri F.; Moosavi-Movahedi A. A.; Amanlou M.; Sheibani N. Competitive Inhibitory Effects of Acetazolamide upon Interactions with Bovine Carbonic Anhydrase II. Protein J. 2007, 26 (6), 371–385. 10.1007/s10930-007-9073-4. [DOI] [PubMed] [Google Scholar]
- Vermeer A. W. P.; Norde W. The Thermal Stability of Immunoglobulin: Unfolding and Aggregation of a Multi-Domain Protein. Biophys. J. 2000, 78 (1), 394–404. 10.1016/S0006-3495(00)76602-1. [DOI] [PMC free article] [PubMed] [Google Scholar]
Associated Data
This section collects any data citations, data availability statements, or supplementary materials included in this article.