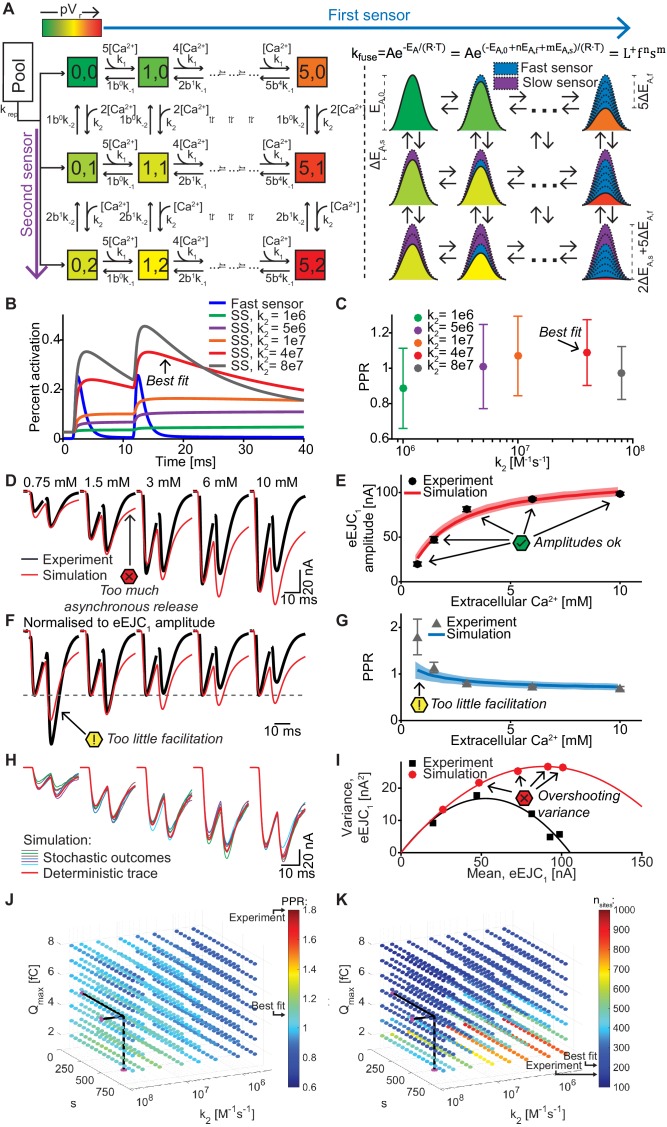
Figure 6. A dual fusion-sensor model of Ca2+ sensors cooperating for SV fusion improves STP behavior, but suffers from too little STF, asynchronous release and too much variance.
(A) Diagram of the dual fusion-sensor model (left). A second Ca2+ sensor for fusion with slower kinetics can increase pVr (indicated by color of each Ca2+ binding state). The second fusion sensor is assumed to act on the energy barrier in a similar way as the first sensor (right). The top right equation shows the relation between the fusion constant, kfuse, and energy barrier modulation with n and m being the number of Ca2+ bound to the first and second Ca2+ sensor, respectively. Ca2+ binding to the second sensor is described by similar equations as for the first sensor, but with different rate constants and impact on the energy barrier. (B) Simulation of Ca2+ binding to the fast (blue) and slow (other colors) Ca2+ sensor in simulations at 0.75 mM extracellular Ca2+ with different k2 values but with constant affinity (i.e. fixed ratio of k-2/k2). The binding is normalized to the maximal number of bound Ca2+ to each sensor (5 and 2, respectively). For illustration purposes in this graph the fusion rate was set to 0 (because otherwise the fast sensor (blue line) would be consumed by SV fusion). k2 = 4e7 M-1s-1 (red trace) illustrates the situation for the optimal performance of the model (approximately best fit value). (C) PPR values in stochastic simulations with the same parameter choices as in (B) but allowing fusion. (D) Experimental eEJC traces (black) together with average simulated traces (red). Simulations show too much asynchronous release compared to experiments. (E) eEJC1 amplitudes of experiment (black) and simulation (red). Error bars and colored bands show standard deviations of data and simulations, respectively. Simulations reproduce eEJC1 amplitudes well. (F) Average, normalized eEJC traces of experiment (black) and simulation (red). Simulations show too little facilitation compared to experiment. (G) PPR values of experiment (gray) and simulation (blue). Error bars and colored bands show standard deviation. Simulations show too little facilitation compared to experiment. (H) Average simulated traces (red) and examples of different outcomes of the stochastic simulation (colors). (I) Plot of the mean synaptic variance vs. the mean eEJC1 values, both from the experiment (black) and the simulations (red). Curves are the best fitted parabolas with forced intercept at (0,0) (simulation: Var = −0.0034*<eEJC1>2+0.5992 nA*<eEJC1>, corresponding to nsites = 294 and q = 0.60 nA when assuming a classical binomial model (Clements and Silver, 2000), see Materials and methods). Simulations lead to too much variance at the highest Ca2+ concentrations. (J) Parameter exploration of the second sensor varying the parameters Qmax, k2, and s. Each ball represents a choice of parameters and the color indicates the average PPR value in stochastic simulations with 0.75 mM extracellular Ca2+. None of the PPR values match the experiment (indicated by the black arrow). Black lines show the best fit parameters. (K) Same parameter choices as in (I). The colors indicate the number of RRP SVs in order to fit the eEJC1 amplitudes at the five different experimental Ca2+ concentrations. Black lines show the best fit parameters, and arrows show the experimental and best fit simulation values. Note that the best fit predicted more release sites than fluctuation analysis revealed in the experiment. Experimental data (example traces and means) depicted in panels D-G,I are replotted from Figure 2A–D,F. Parameters used for simulations can be found in Tables 1–3. Simulation scripts can be found in Source code 1. Results from simulations (means and SDs) can be found in the accompanying source data file (Figure 6—source data 1). Simulations of the dual fusion-sensor model with cooperativity 5 are summarized in Figure 6—figure supplement 1.


