Abstract
During mouse embryonic development, pluripotent cells rapidly divide and diversify, yet the regulatory programs that define the cell repertoire for each organ remain ill-defined. To delineate comprehensive chromatin landscapes during early organogenesis, we mapped chromatin accessibility in 19,453 single nuclei from mouse embryos at 8.25 days post-fertilisation. Identification of cell type-specific regions of open chromatin pinpointed two TAL1-bound endothelial enhancers, which we validated using transgenic mouse assays. Integrated gene expression and transcription factor motif enrichment analyses highlighted cell type-specific transcriptional regulators. Subsequent in vivo experiments in zebrafish revealed a role for the ETS factor FEV in endothelial identity downstream of ETV2 (Etsrp in zebrafish). Concerted in vivo validation experiments in mouse and zebrafish thus illustrate how single-cell open chromatin maps, representative of a mammalian embryo, provide access to the regulatory blueprint for mammalian organogenesis.
In the mouse, early organogenesis around embryonic days (E) 8 encapsulates a key period of cell type diversification, as the precursor cells for most major organs are specified. Because of the very limiting cell numbers in early embryos and a paucity of marker proteins to isolate individual cell types, a global description of the cellular complexity during early organogenesis has only recently become possible due to the advent of single-cell molecular profiling techniques1–4. As illustrated by single-cell profiling in Drosophila5, information on open chromatin represents a route into identifying the molecular processes that underlie the establishment of diverse cellular identities. In mammalian embryos however, single-cell molecular profiling analysis of organogenesis has so far been limited to single-cell transcriptomics6–8.
Results
Single-nucleus chromatin profiles reveal the regulatory landscape of E8.25 mouse embryos
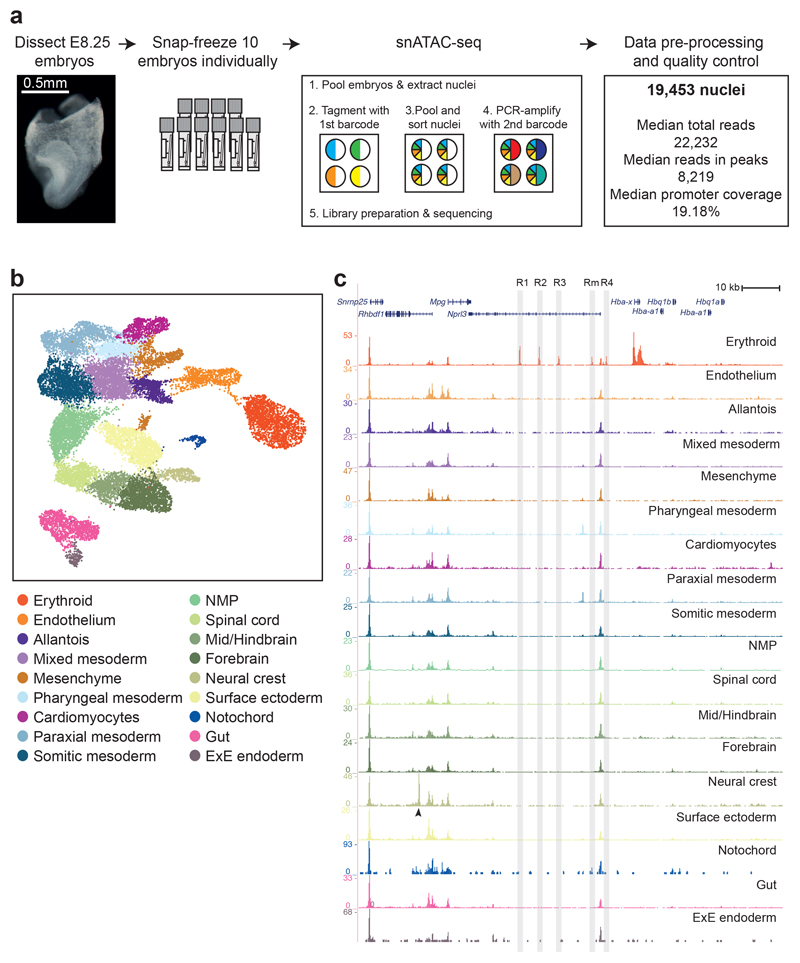
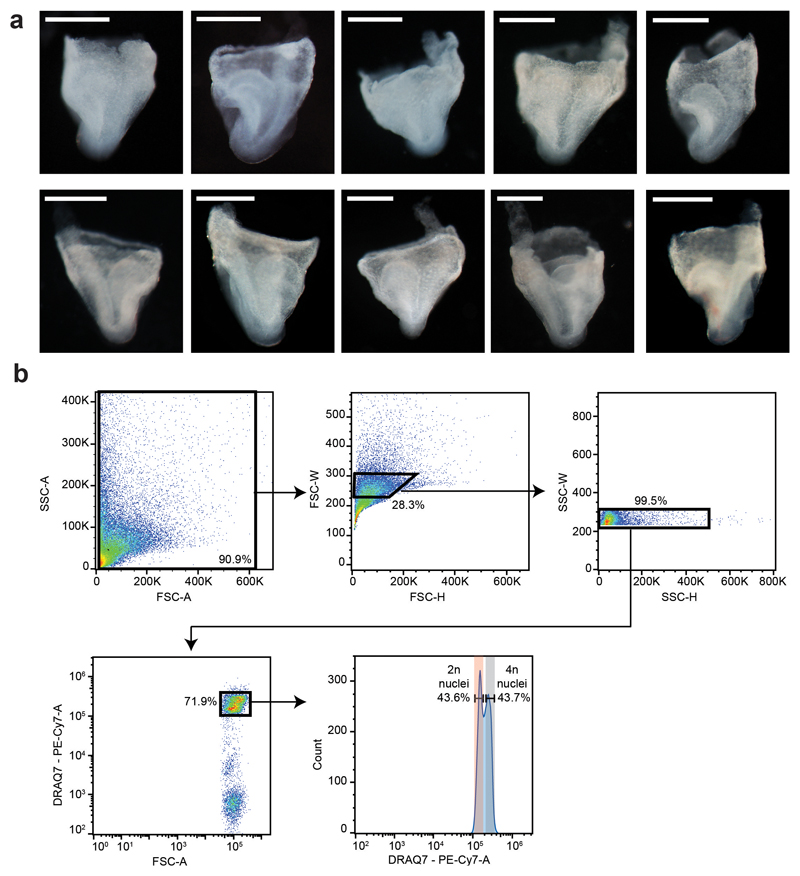
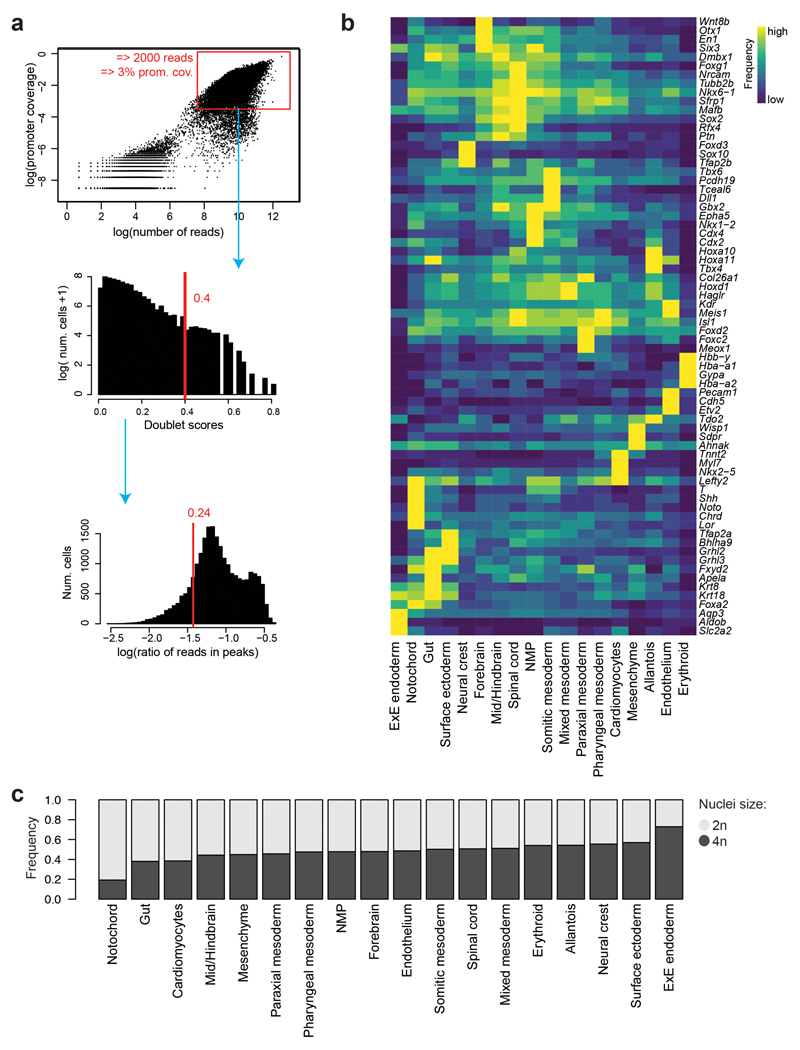
To delineate the regulatory landscape of early organogenesis, we generated chromatin accessibility profiles of single nuclei from 10 mouse embryos at E8.25 using single-nucleus Assay for Transposase Accessible Chromatin (ATAC)-seq4 (Fig. 1a, Extended Data Fig. 1a,b and Supplementary Table 1). During the sort, two populations, corresponding to nuclei with 2 (2n) and 4 copies (4n) of DNA, respectively, were detected (Extended Data Fig. 1b). To minimize differences in DNA content from influencing the subsequent analysis, we collected most of the nuclei regardless of DNA content as well as sorted 2,443 2n and 2,335 presumptive 4n nuclei separately (see Methods; Extended Data Fig. 1b). After data processing (see Methods; Extended Data Fig. 2a and Supplementary Tables 2-4), 19,453 nuclei were retained, with a median of 22,232 uniquely aligned and distinct nuclear reads with a mapping quality at or above 20, and 19.18% promoter coverage per nucleus. To explore the resulting chromatin landscape, we defined open chromatin regions (OCRs) by pooling all the data, called peaks in the pooled sample, and merged the resulting peak list with known transcription start sites (TSS) to help identifying rare cell populations. Following dimensionality reduction with cisTopic9 and Louvain clustering, a second round of peak calling was performed for each cluster to recover OCRs in small cell groups (see Methods). This resulted in a combined list of 305,187 genomic regions.
Fig. 1. Single-cell chromatin maps of early mouse organogenesis.
a, Diagram illustrating the experimental pipeline. The second panel represents cryovials used for snap-freezing, containing a parafilm strip with the embryo on top. Different colours in the pie charts from the single-nucleus ATAC-seq (snATAC-seq) diagram represent different barcodes; “sort” refers to sorting nuclei using Fluorescence Activated Cell Sorting (FACS). b, UMAP visualisation of the dataset (n=19,453 nuclei) coloured by cell type annotation. Each dot represents a nucleus in the chromatin accessibility space. c, Normalised genome browser tracks of the alpha globin locus for all cell types. Each track represents a pool of cells with a specific cell type annotation. Shadowed regions highlight the known alpha globin enhancers R1-R4 and Rm. Black arrowhead points to the neural crest-specific peak within the Rhbdf1 gene. ExE: Extra-embryonic; NMP: Neuro-mesodermal progenitor.
Using these regions, nuclei were re-clustered, and annotated by inspecting the TSS of marker genes previously reported for cell types present at E8.258 (Extended Data Fig. 2b and Supplementary Table 5). The resulting 18 cell populations cover all three embryonic germ layers and extra-embryonic tissues (Fig. 1b). Notably, most cell types were composed of a relatively even number of nuclei with different DNA content, except for the notochord with ~80% 2n cells consistent with previously reported quiescence10, and extra-embryonic endoderm with ~73% 4n nuclei, in line with previously reported polyploidy11 (Extended Data Fig. 2c).
To explore the accessibility profiles of all 18 cell types, we pooled nuclei based on their annotation and generated a genome browser session (https://tinyurl.com/snATACseq-GSE133244-UCSC). To further assess data quality and also characterise the erythroid lineage, we investigated the alpha globin cluster, which is composed of embryonic (Hba-x) and adult (Hba-a1, Hba-a2) globin genes with a well-characterised set of upstream enhancers (R1-R4 and Rm)12–14. These enhancers were only accessible in the erythroid cluster (Fig. 1c, shaded areas), and only the embryonic Hba-x gene was in open chromatin, in stark contrast to the adult genes, which are accessible later in development and in the adult14–16. The alpha globin locus also contained regions that are accessible across cell types, and a neural crest-specific peak within the Rhbdf1 gene (Fig. 1c, arrowhead), thus illustrating the specificity and quality of the open chromatin maps.
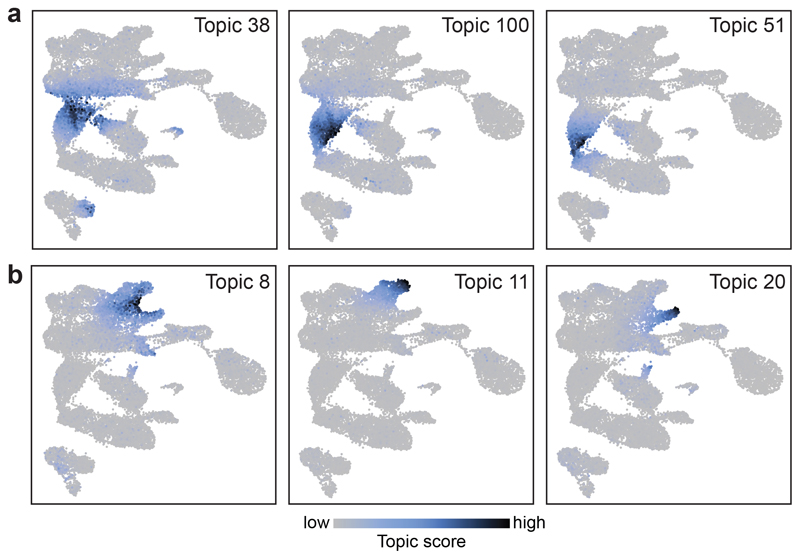
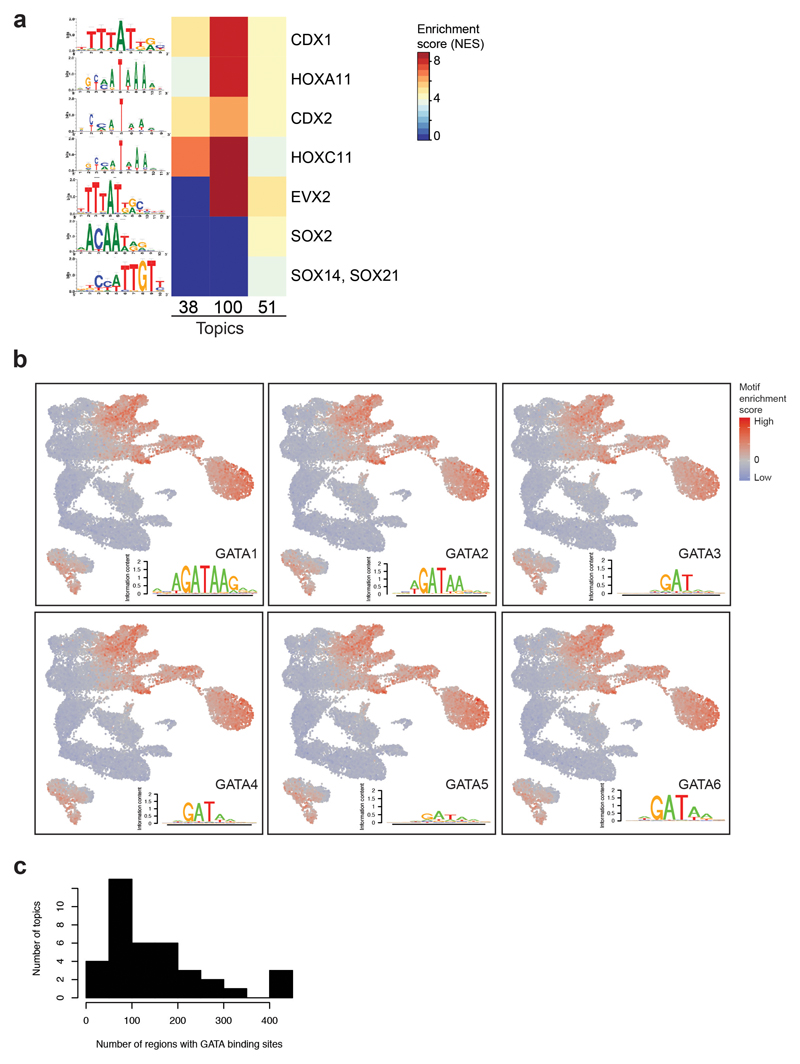
Further substructure within cell populations was revealed by cisTopic9 analysis, which groups genomic regions by their co-accessibility and computes a cell-based score for each group of co-accessible regions (termed topic) for each cell. For instance, three different topics contributed to the segregation of cells within the neuro-mesodermal progenitor cluster (NMPs), thought to contain bipotential progenitors for neural and mesodermal cells17 (Fig. 2a). Topic 38 was most prominent in NMPs closer to somitic mesoderm in the UMAP, topic 100 was higher in the middle, and topic 51 contributed more in NMPs nearer to neural cells. Motif enrichment analysis of the regions uniquely contributing to each topic (Supplementary Table 6) revealed that all three topics were enriched for HOX and CDX-binding sites (Extended Data Fig. 3a). Topic 51 was additionally enriched for SOX-binding sites (Extended Data Fig. 3a), highlighting that cells may enter neural differentiation. We also encountered topics that contributed to more than one population, such as topic 8, with high scores in cardiomyocytes and mesenchymal cells (Fig. 2b). Other topics and their enriched motifs can be explored at: https://gottgens-lab.stemcells.cam.ac.uk/snATACseq_E825.
Fig. 2. cisTopic analysis reveals complex patterns including restriction to subpopulations and sharing between cell types.
a, UMAP visualisations (n=19,453 nuclei) showing the topic score per cell for topics contributing to subpopulations within the NMP cell type (n=1,926 cells). b, UMAP visualisations (n=19,453 cells) showing the topic score per cell for Topic 8, which contributes to both Mesenchyme (n=762 cells) and Cardiomyocytes (n=717 cells) (left); Topic 11, which contributes only to Mesenchyme (middle); and Topic 20, which contributes to Cardiomyocytes (right). Scale bar for (a) and (b) is shown at the bottom of the Figure. Low: grey. High: dark blue.
It is well known that GATA factors are important in multiple embryonic lineages18. We therefore explored which cell types are significantly enriched for OCRs with GATA motifs at the single-cell level using chromVAR19. Consistent with previous literature, GATA motifs were enriched in endothelium, erythrocytes, mesenchyme, cardiomyocytes, pharyngeal mesoderm as well as in the allantois and some endodermal cells (Extended Data Fig. 3b). To refine which OCRs with a GATA motif are likely to contribute to each cell type, we assessed which topics were enriched for GATA factors (Extended Data Fig. 3c). 38 topics presented GATA motif enrichment, with topics 82, 11 and 36 most highly enriched (> 400 regions per topic) and mostly contributing towards erythrocytes, cardiomyocytes and endothelium, respectively. This was followed by topic 8, described above (309 GATA-containing regions), and topics contributing to pharyngeal mesoderm (topic 59), allantois (topic 95) and extra-embryonic endoderm (topic 31) with 271, 271 and 242 GATA-motif OCRs, respectively. Together, this analysis highlights how OCRs and their putative upstream regulators contribute to the regulatory wiring of specific lineages.
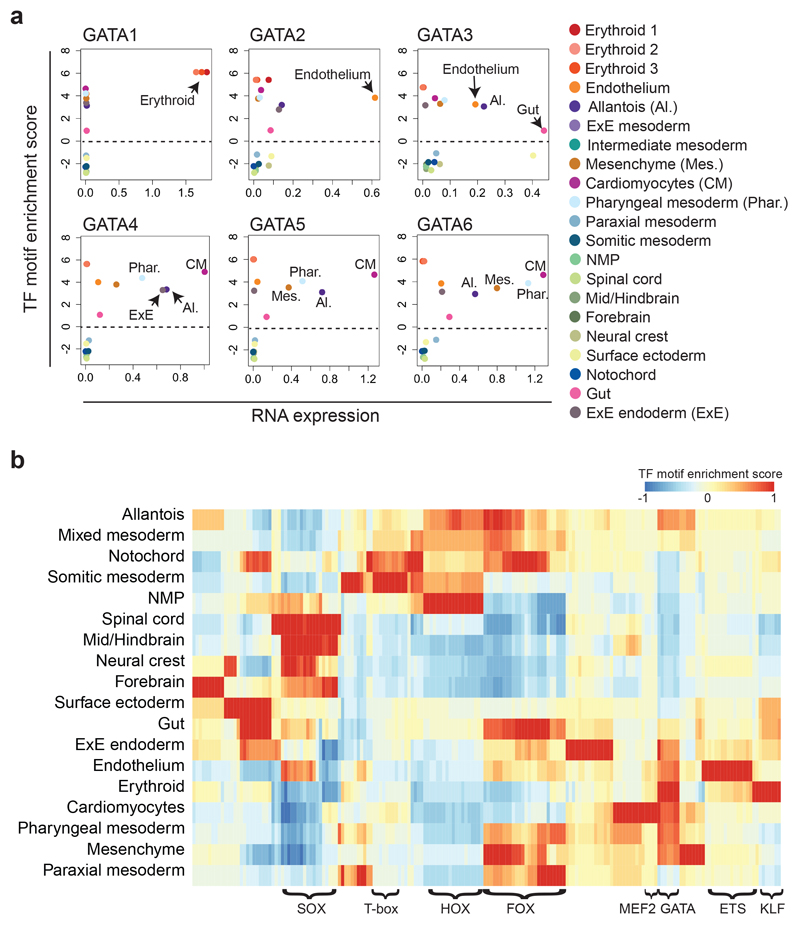
The consensus binding motifs for the six GATA factors (GATA1-6) are highly similar (Extended Data Fig. 3b). We therefore integrated our chromatin dataset with our previously reported E8.25 single-cell transcriptome data7,8 (Fig. 3a). Consistent with previous literature18, this integrated analysis highlighted GATA1 as a key erythroid regulator, GATA2 for endothelium, and GATA4-6 in cardiomyocytes. Moreover, it also suggested a potential role for GATA3 in the gut, supporting previous evidence showing its expression in endodermal precursors and its ability to induce endodermal genes in vitro20,21.
Fig. 3. Combining motif overrepresentation analysis with RNA expression highlights cell type-specific transcription factor regulators.
a, X-Y plots showing the RNA expression levels (x-axis) and the transcription factor (TF) motif enrichment Z-scores (mean values) (y-axis) for the GATA transcription factors. Each plot corresponds to one factor (GATA1-6) and each dot corresponds to the values for a specific cell type. Dashed horizontal line represents the neutral value of TF motif enrichment. If above this line, the TF motif is enriched in that particular cell type. b, Heatmap showing the normalised mean motif enrichment Z-score for TFs listed in the cisBP database and curated for chromVAR19. Values are represented by a colour gradient from blue (-1) to red (1). Rows correspond to each cell type. Columns correspond to each TF. A few selected TF families have been annotated in this panel for a clearer visualisation. For a fully annotated heatmap, refer to Extended Data Fig. 4a. Cell type labels are a consensus between ref. 8 and those defined in this study. For those labels differing between datasets, the following matching strategy is used: “Erythroid1-3” in ref. 8 refer to “Erythroid” in snATAC-seq, “Forebrain/Midbrain/Hindbrain” to “Forebrain” and “Midbrain/Hindbrain”, “Intermediate mesoderm” and “ExE mesoderm” to “Mixed mesoderm”. ExE: Extra-embryonic; NMP: Neuro-mesodermal progenitor.
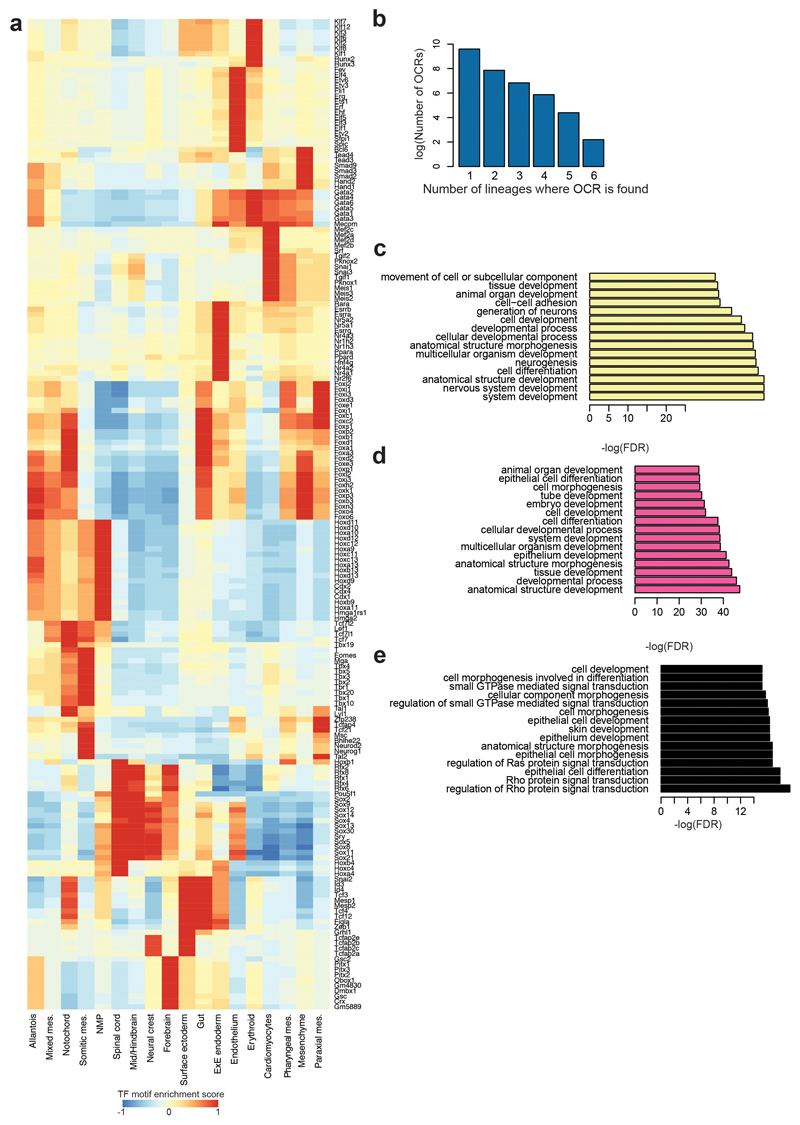
Following on from the computation of transcription factor motif enrichment, we next explored motif overrepresentation in specific cell types (Fig. 3b and Extended Data Fig. 4a), which broadly supported our cell type annotations. For example, KLF motifs were enriched in erythrocytes, consistent with the regulatory role for KLF1 in erythropoiesis22,23, and the MEF2 motif was overrepresented in cardiomyocytes, supporting their known role in this cell type24. Further examination of the enrichment of these motifs at the single-cell level can be performed on our website (https://gottgens-lab.stemcells.cam.ac.uk/snATACseq_E825).
Defining cell-type specific chromatin identifies common biological processes
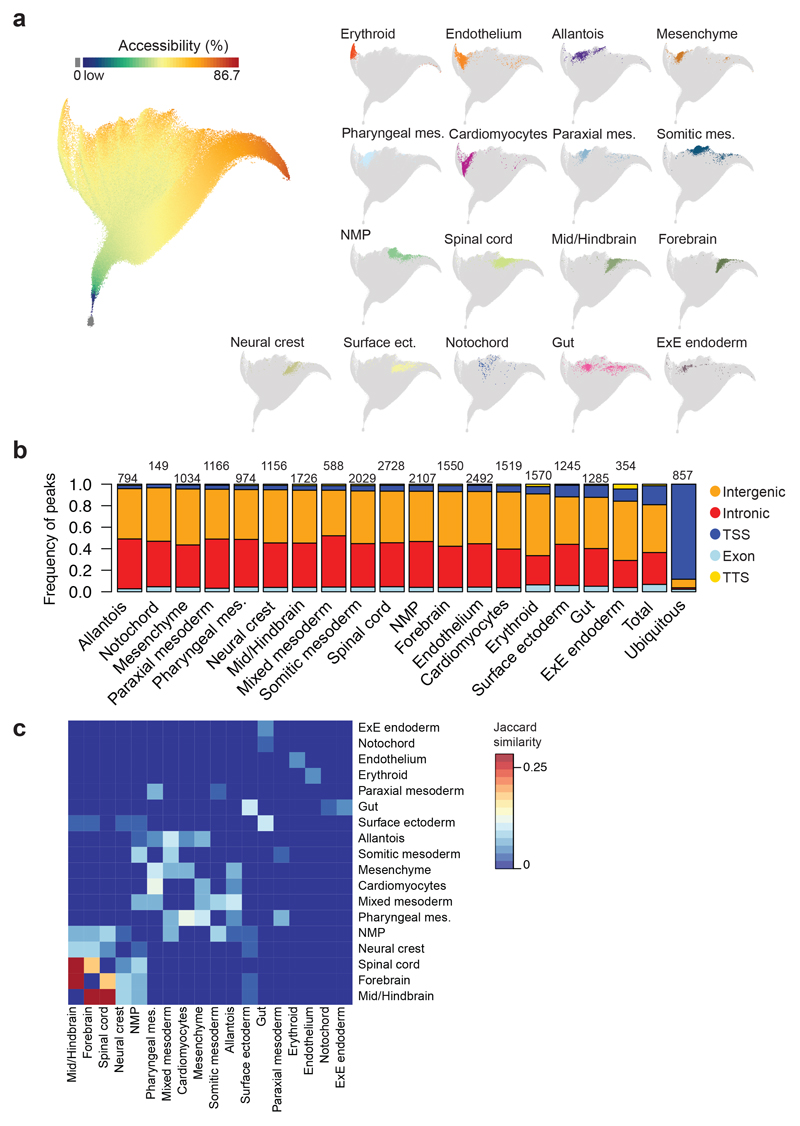
Cis-regulatory topics capture modular patterns but may fail to identify non-modular OCRs with cell type specificity. We therefore listed cell type-enriched OCRs more accessible in cells from one cell type compared to all the other cells (Fisher’s exact test, q-value < 0.01, Bonferroni-corrected). Further filtering by pairwise comparisons between all cell types only retained those regions with differential accessibility in at least half of these comparisons (Fisher’s exact test, q-value < 1x10⁻¹⁰, Bonferroni-corrected), thus allowing inclusion of OCRs involved in closely related lineages (see Methods; Supplementary Table 6). To characterize these cell type-specific OCRs across cells, we visualised the 305,187 genomic regions using their differential accessibility by projecting them into a two-dimensional space using the 19,453 nuclei as variables (Fig. 4a and Supplementary Table 6). The resulting landscape showed segregation of cell type-specific OCRs in different territories (Fig. 4a). Moreover, OCRs specific for the same germ layer were adjacent, and NMPs located in between spinal cord and somitic mesoderm, thus reflecting developmental lineage relationships. Cell type-specific OCRs are mostly intergenic and intronic, while regions present in more than 25% of the nuclei mostly coincide with promoters (Fig. 4b).
Fig. 4. Cell type-specific genomic regions are co-regulated.
a, UMAP visualisation of the dataset where each dot represents a genomic region and their position highlights how their accessibility varies across cells. n=305,187 genomic regions. Left: Genomic regions are coloured by the percentage of nuclei that have that specific region open that ranges from dark blue (low) to dark red (86.7%), with those genomic regions with 0% accessibility in grey. Colour scale has been log-transformed. Right: Only cell type-specific genomic regions are coloured. b, Barplot showing the frequency of genomic regions that fall in intergenic (orange), intronic (red), promoter-TSS (dark blue), exonic (light blue) and TTS (yellow) regions for each cell type. “Ubiquitous”: regions that are open in more than 25% of the nuclei. “Total”: all genomic regions (n=305,187). Numbers on top of the bars refer to the number of genomic regions specific for each cell type and for ubiquitous regions. c, Heatmap showing the degree of overlap (Jaccard similarity) between cell type-specific regions from different lineages. Jaccard similarity index ranges from 0 (dark blue) to 0.283 (dark red). Jaccard similarity was set to 0 in the diagonal. mes.: mesoderm. ect.: ectoderm. ExE: Extra-embryonic; NMP: Neuro-mesodermal progenitor.
Our definition of cell type-specific OCRs permitted presence in a small number of cell types, yet close to 80% were in fact unique for a single cell type, and only about 21% were shared between multiple lineages, potentially underpinning shared regulatory programs (Extended Data Fig. 4b). Subsequent examination of the number of regions shared between lineages highlighted expected relationships (Fig. 4c). For instance, forebrain, mid/hindbrain and spinal cord contained several overlapping cell type-specific OCRs, whereas cardiomyocytes shared many cell type-specific OCRs with pharyngeal mesoderm. Unexpectedly at first, surface ectoderm and gut shared many cell type-specific OCRs. We annotated all genomic regions to their nearest gene (Supplementary Table 6) and performed GO term enrichment analysis on the genes assigned to cell type-specific OCRs unique to either surface ectoderm (n=1,018) or gut (n=1,058), as well as those shared OCRs (n=227) (Extended Data Fig. 4c-e). Genes associated to OCRs unique to surface ectoderm pointed towards tissue development and included the terms “nervous system development” and “neurogenesis” (adjusted p < p < 1x10⁻⁵, BH-corrected). Genes associated with gut-specific and unique OCRs were assigned to terms such as “tube development” and “animal organ development” (adjusted p < 1x10⁻⁵, BH-corrected). Shared OCRs were near genes associated with terms related to epithelialisation (adjusted p < 1x10⁻⁵, BH-corrected), consistent with both cell types forming epithelial tissues. This analysis therefore illustrates how determining cell type-specific regions may find regulatory programs shared between lineages.
Flt1 +67kb and Maml3 +360kb are two TAL1-bound endothelial enhancers
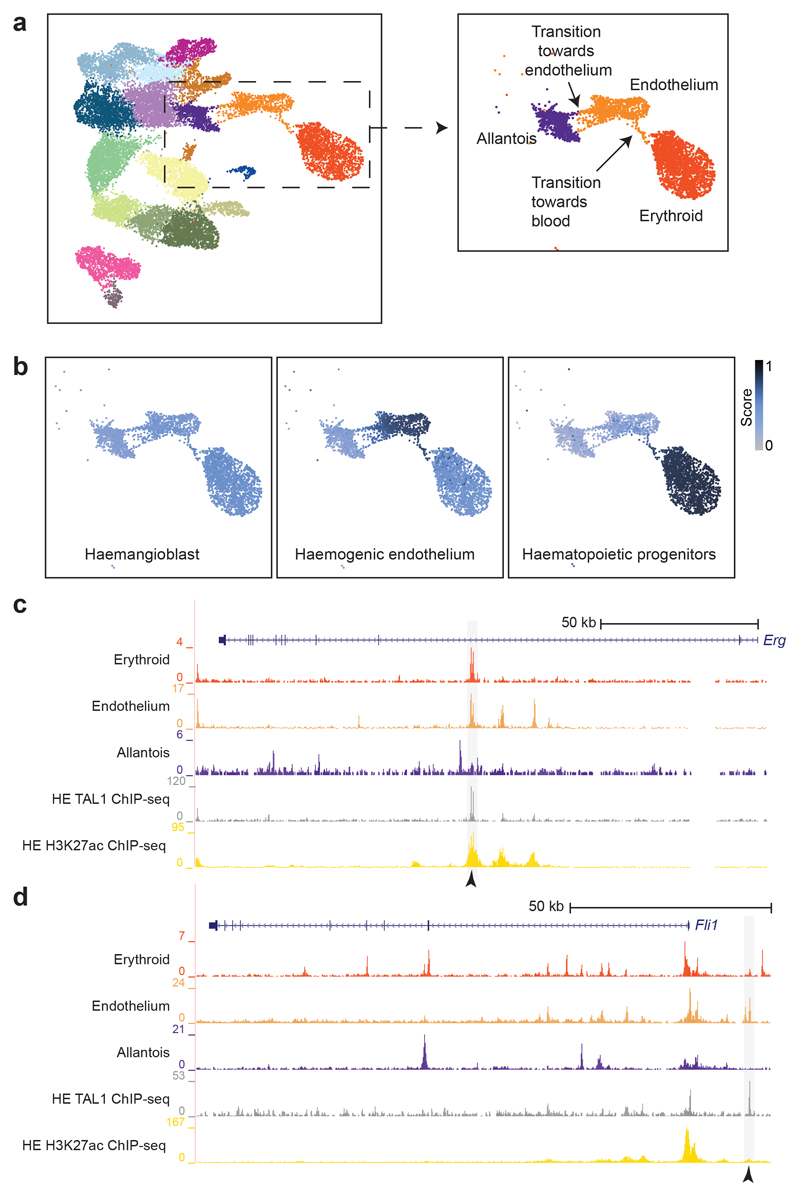
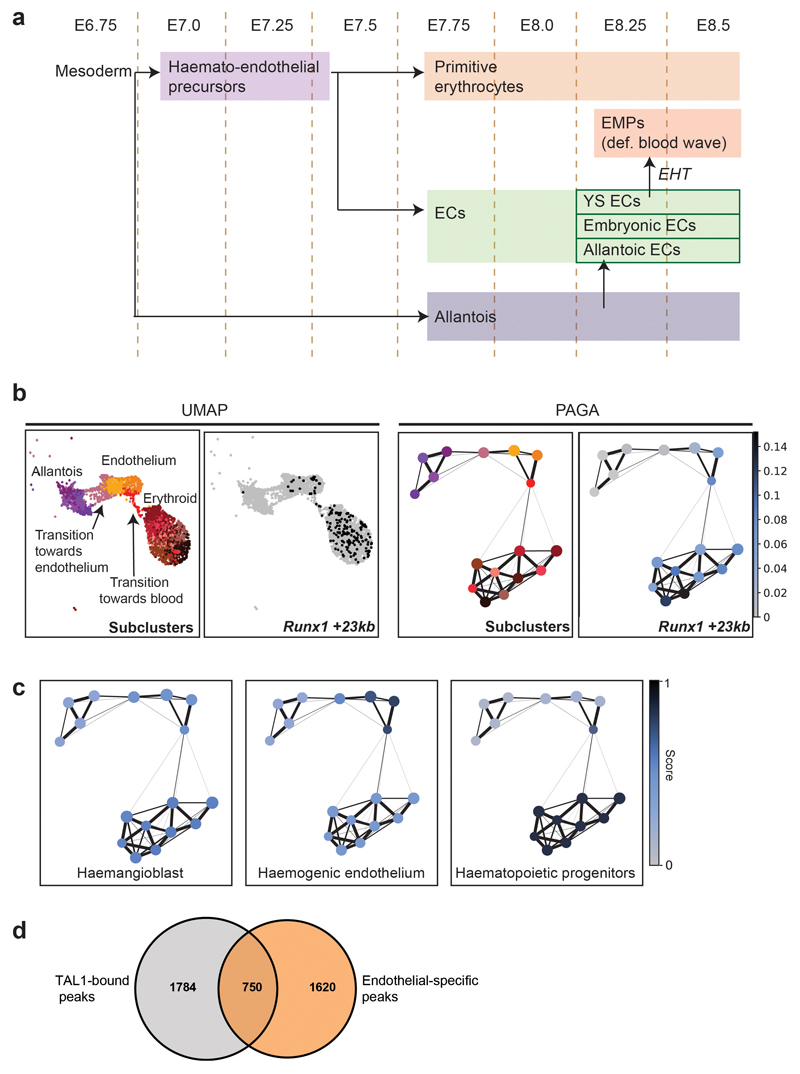
The growing mouse embryo critically depends on early establishment of the circulatory system for appropriate oxygenation. The development of blood and endothelium is tightly linked through common precursor cells, shared marker genes as well as regulatory signalling and proteins25–27 (Extended Data Fig. 5a). In the early mouse embryo, a first wave of so-called primitive blood cells emerges from a mesodermal precursor at around E7.5 that transiently expresses genes commonly associated with endothelium28. Subsequently, at around E8.25, a second blood wave arises from already formed endothelial cells (termed haemogenic endothelium)28. At E8.25, endothelium can also originate from allantoic cells, thus contributing to the endothelial pool29. To assess how some endothelial cells transition towards blood while some others originate from the allantois at this stage, we next re-evaluated the accessibility profiles of cells annotated as allantois, erythroid and endothelium (3,284 cells). Importantly, considering the time-point at which these cells have been collected, the cells annotated as “erythroid” are likely to originate from the first blood wave; therefore, in this evaluation, erythroid cells have been principally used to pull those endothelial cells transitioning towards a blood phenotype from the rest of endothelium. In the UMAP, we could observe a string of endothelial cells transitioning towards blood (Fig. 5a), suggestive of their haemogenic endothelial nature. Many of these cells presented accessibility at the Runx1 +23kb enhancer, which has been reported as a regulator of endothelial-to-haematopoietic transition30,31 Extended Data Fig. 5b). In the UMAP, we could also detect a group of emerging endothelial cells likely to be transitioning from the allantois population, consistent with previous literature29 (Fig. 5a).
Fig. 5. Endothelial-specific sites bound by TAL1 in vitro highlight known haemato-endothelial enhancers.
a, UMAP as in Fig. 1b with a box around the allantoic-haemato-endothelial cells (left). Zoomed in UMAP (right) shows and describes the cells found in this landscape only. b, UMAP of allantoic-haemato-endothelial cells (n=3,284 cells) showing the enrichment scores (colour gradient from grey=0 to dark blue=1) for TAL1 ChIP-seq peaks obtained from in vitro-derived haemangioblasts, haemogenic endothelium and haematopoietic progenitors from32. ChIP-seq peaks were taken from http://codex.stemcells.cam.ac.uk/. c, Genome browser tracks showing the Erg (top) and the Fli1 (bottom) loci. Black arrowheads indicate the Erg +85kb (top) and the Fli1 -15kb (bottom) enhancers. Tracks correspond to the snATAC-seq profiles of the erythroid, endothelium and allantois cell types after cell pooling, the TAL1 ChIP-seq for haemogenic endothelial cells (“TAL1 ChIP-seq HE”, grey) and H3K27ac ChIP-seq for haemogenic endothelial cells from32 (“H3K27ac HE”, gold). Haemogenic endothelial TAL1 and H3K27ac ChIP-seq tracks were obtained from http://codex.stemcells.cam.ac.uk/.
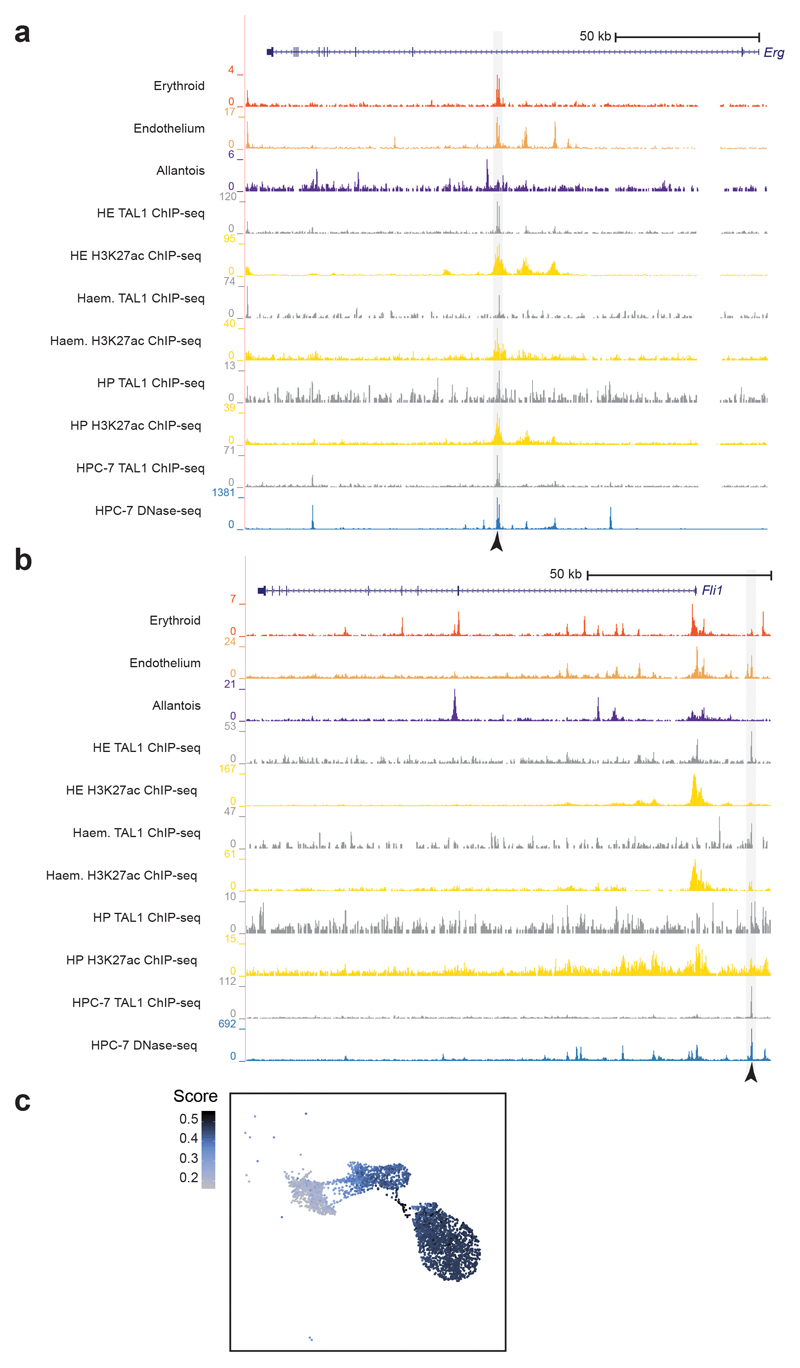
We recently reported at the single-cell transcriptomic level how the transcriptional regulator TAL1 disrupts the first and second blood waves, and that Tal1-/- endothelial cells acquire an aberrant mesodermal profile8. To explore how TAL1 binding relates to chromatin accessibility in our landscape, we compared the accessibility profiles of each nucleus with three lists of TAL1-bound peaks computed from previously reported TAL1 ChIP-seq experiments performed in haemangioblasts, haemogenic endothelium (HE) and haematopoietic progenitors (HP) derived from mouse embryonic stem cells (mESCs)32. TAL1-bound peaks from HE and HP were highly enriched in the transition of endothelial cells towards blood, with higher scores in the HE on average (mean scores of 0.47 for haemangioblast, 0.74 for HE and 0.46 for HP) (Fig. 5b, Extended Data Fig. 5c). Intersecting our endothelial-specific OCRs with TAL1 ChIP-seq peaks from HE resulted in 750 TAL1-bound endothelial-specific OCRs (Extended Data Fig. 5d and Supplementary Table 7), including the known endothelial enhancers Erg +85kb and Fli1 -15kb 33,34 (Fig. 5c,d and Extended Data Fig. 6a,b).
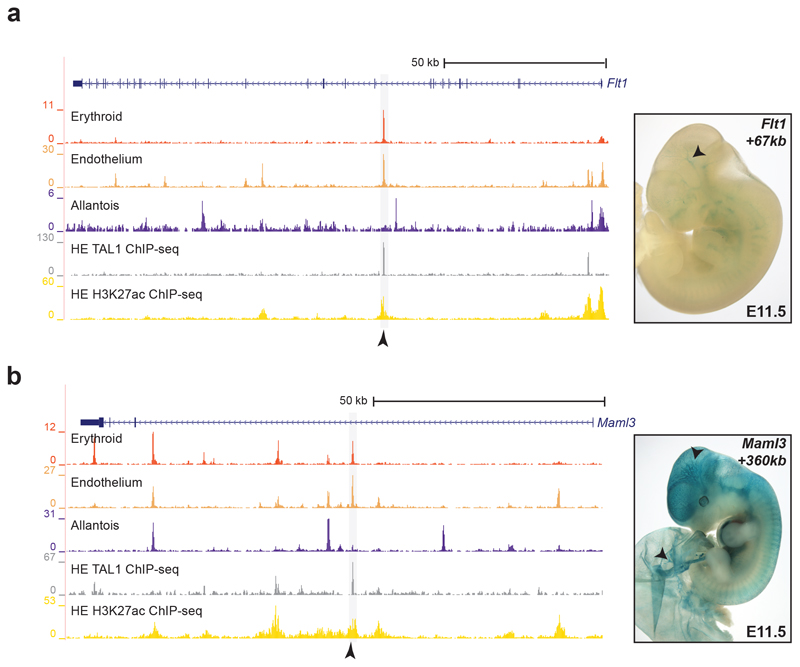
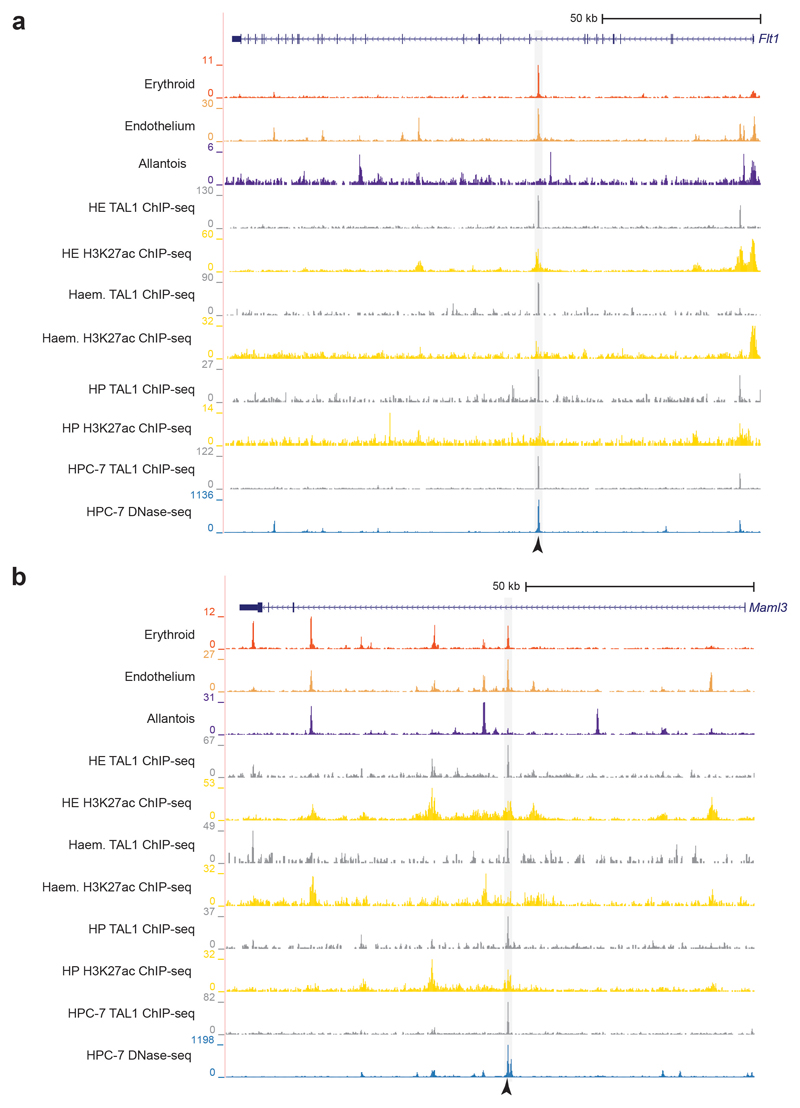
The Erg +85kb and Fli1 -15kb OCRs are bound in the haematopoietic progenitor cell line (HPC-7)35 by a heptad of transcription factors, consisting of TAL1, LYL1, LMO2, GATA2, RUNX1, ERG and FLI-134 (Extended Data Fig. 6a,b). When computing the enrichment of heptad peaks, we observed that cells in the transition presented higher scores compared to the rest, suggesting that some heptad-bound enhancers may already be accessible in endothelium at the time of the endothelial-to-haematopoietic transition (Extended Data Fig. 6c). We therefore reduced our list of 750 endothelial TAL1-bound regions to 151 regions also bound by the heptad in HPC-7 (Supplementary Table 8). In addition to previously characterised enhancers (Fig. 5c,d), this included candidate enhancers in the Flt1 and Maml3 genes (Flt1 +67kb and Maml3 +360kb, respectively) (Fig. 6, Extended Data Figs. 7 and 8). FLT1 is a member of the vascular endothelial growth factor receptor family, and MAML3 a member of the mastermind gene family that act as mediators of Notch signalling, previously reported to be important for haematopoietic stem cell emergence36. Transgenic mouse assays37,38 showed that both candidate enhancers were active in the vasculature at E11.5 (Fig. 6 and Supplementary Table 9), not only validating the role of the Flt1 +67kb and Maml3 +360kb as potential nodal points of the endothelial program, but also illustrating a much broader utility of our dataset for identifying tissue-specific regulatory regions.
Fig. 6. Flt1 +67kb and Maml3 +360kb are two endothelial-specific enhancers.
Left: Genome browser tracks showing the Flt1 (a) and the Maml3 (b) loci. Black arrowheads indicate the Flt1 +67kb (top) and the Maml3 +360kb (bottom) enhancers. Tracks correspond to the snATAC-seq profiles of the erythroid, endothelium and allantois cell types after cell pooling, the TAL1 ChIP-seq for haemogenic endothelial cells (“TAL1 ChIP-seq HE”, grey) and H3K27ac ChIP-seq for haemogenic endothelial cells from32 (“H3K27ac HE”, gold). Haemogenic endothelial TAL1 and H3K27ac ChIP-seq tracks were obtained from http://codex.stemcells.cam.ac.uk/. Right: E11.5 transgenic mouse embryos generated by pronuclear injection of lacZ reporter constructs into fertilized zygotes, followed by transfer into pseudopregnant recipient females. LacZ activity was visualised with X-Gal staining. Both the Flt1 +67kb (top) and Maml3 +360kb (bottom) enhancers show specific staining in the vasculature (black arrowheads as example). This was observed in 8/15 and 2/5 stained embryos for Flt1 +67kb and Maml3 +360kb, respectively. See Supplementary Table 9 for numbers of transgenic embryos analysed.
fev - a player in the establishment of the haemato-endothelial program
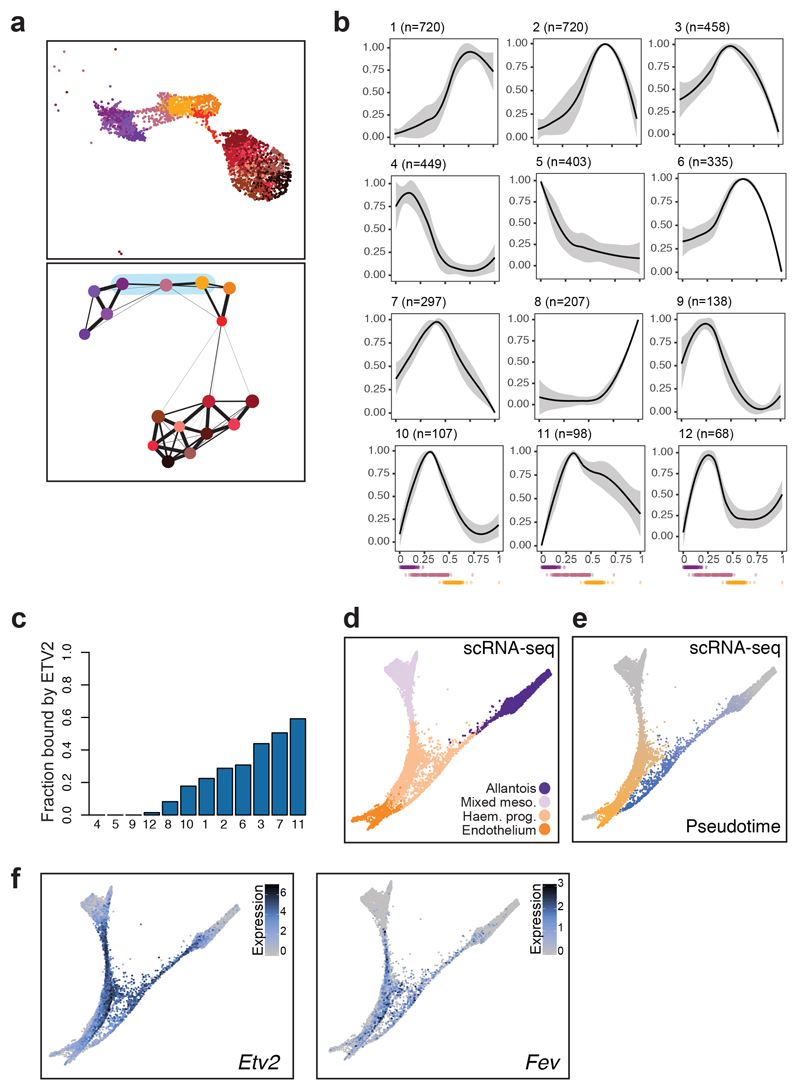
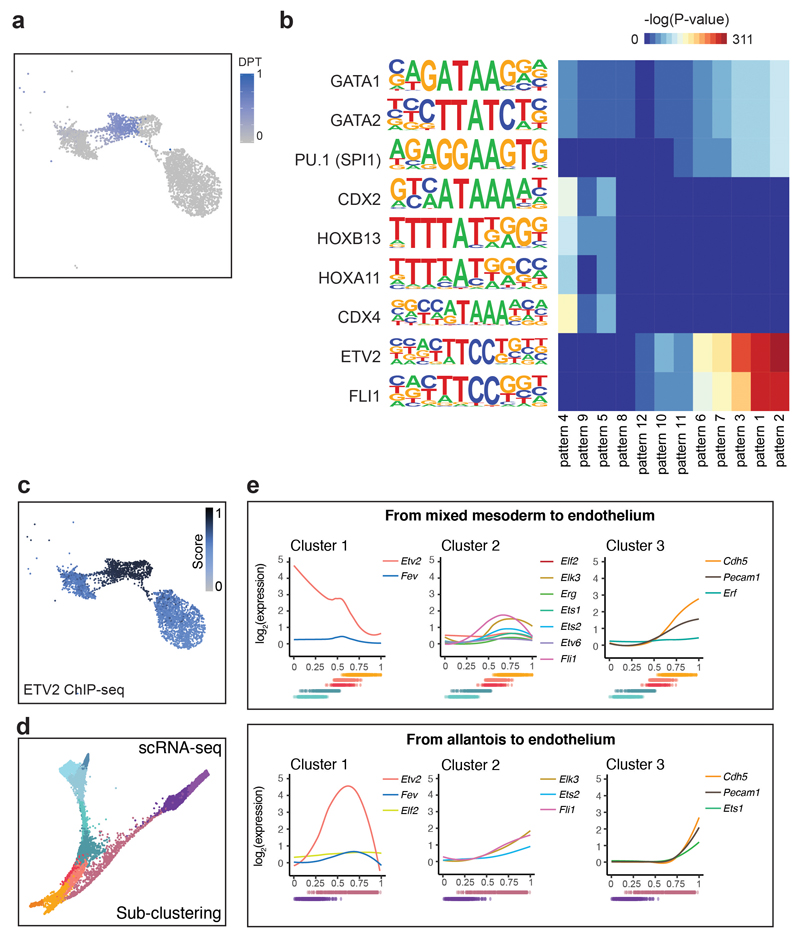
As mentioned above, allantoic cells can transition towards endothelium at E8.25. We therefore used this differentiation process to investigate regulatory programs associated with the establishment of endothelium during embryonic development. We first subclustered our landscape of Fig. 5a and performed pseudotime inference on those sub-clusters associated with the transition (Fig. 7a and Extended Data Fig. 9a). Subsequent identification of dynamic accessibility patterns revealed 12 major patterns, mainly divided into OCRs becoming inaccessible early or becoming accessible in the middle or late (Fig. 7b). Genomic regions with accessibility peaking in the middle or towards the end of the transition (patterns 1-3, 6-7, 10-12) were enriched for ETS-binding sites, whereas pattern 8, which peaked at the very end of the trajectory, was more enriched for GATA motifs (Extended Data Fig. 9b). Regions that lost accessibility (patterns 4, 5, 9) were enriched for binding sites of transcription factors associated with an allantoic identity, such as HOX.
Fig. 7. Fev as a potential regulator of the endothelial program.
a, UMAP visualisation (top) and PAGA representation (bottom) of allantoic-haemato-endothelial cells (n=3,284 cells). Colours represent different sub-clusters. Blue shade in PAGA marks the clusters involved in the transition from allantois to endothelium and that were used for pseudotime analyses. b, Dynamic patterns of chromatin accessibility along the trajectory from allantois to endothelium. The black line is the mean fitted accessibility across all OCRs in each pattern; the grey shading indicates the standard deviation along the trend across all OCRs in the pattern. Dots below plots represent the ordered cells coloured by sub-clusters in (a). n=number of genomic regions that were assigned to the pattern. c, Barplot showing the fraction of peaks within each of the patterns in (b) that are bound by ETV2 in a published ChIP-seq dataset41. d-f, Force-directed graph showing cells from the “Mixed mesoderm”, “Allantois”, “Haemato-endothelial progenitors” and “Endothelium” that have been profiled with scRNA-seq in8 (n=7,631 cells). Cell colours in (d) represent the original cell types from8. Colour gradients in (e) show the pseudotime trajectories from mixed mesoderm to endothelium (from grey to orange) and from allantois to endothelium (from grey to blue). Cells coloured in grey were not considered for pseudotime analyses. Colour gradient in (f) indicate log2-normalised expression levels of Etv2 (left) and Fev (right).
ETS transcription factors are well-known for their role in endothelium39 with ETV2 recognized as an essential regulator of early specification of the endothelial and blood lineages40. We therefore interrogated a previously reported ETV2 ChIP-seq dataset obtained from mESCs during their differentiation towards haemato-endothelium41, which revealed substantial overlap of ETV2-bound peaks with the chromatin accessibility profiles of endothelial cells (Extended Data Fig. 9c), and also confirmed that many of our defined patterns contained genomic regions bound by ETV2 (Fig. 7c).
However, not all OCRs were bound by ETV2 and not all ETS factors have been tested for potential roles in defining the endothelial transcriptional programs during embryonic development. Since many ETS factors can bind to a similar motif, we next examined the expression dynamics of other ETS factors during the emergence of endothelium either from mesoderm or from allantois in our previously published transcriptomic atlas8. Computational isolation of single-cell transcriptomes from mixed mesoderm, haemato-endothelial progenitors, endothelium and allantois (7,631 cells) (Supplementary Table 10) was followed by visualisation on a force-directed graph, which highlighted the two expected trajectories towards endothelium, namely from mesoderm or from allantois (Fig. 7d). We next inferred the two differentiation paths by pseudotime analysis and examined the expression of highly dynamic ETS factors (Fig. 7e,f and Extended Data Fig. 9d,e). Interestingly, the ETS factor Fev clustered together with Etv2, with a specific expression peak in the middle of each trajectory, consistent with a potential role in the establishment of embryonic endothelium.
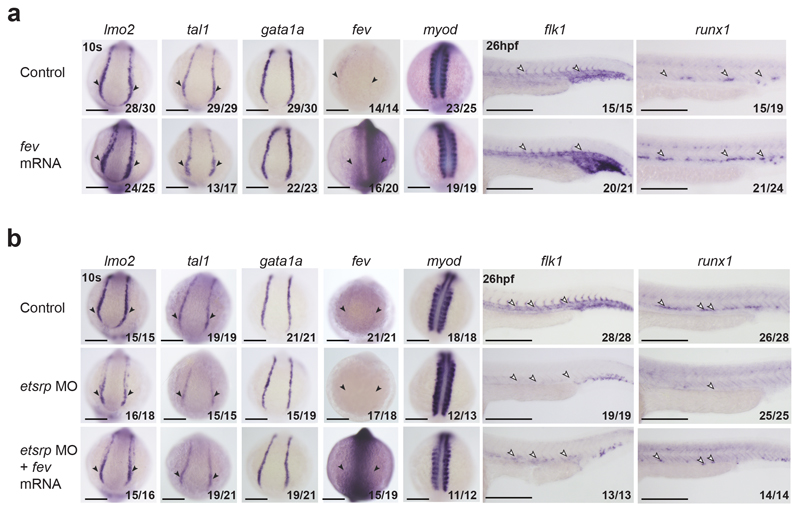
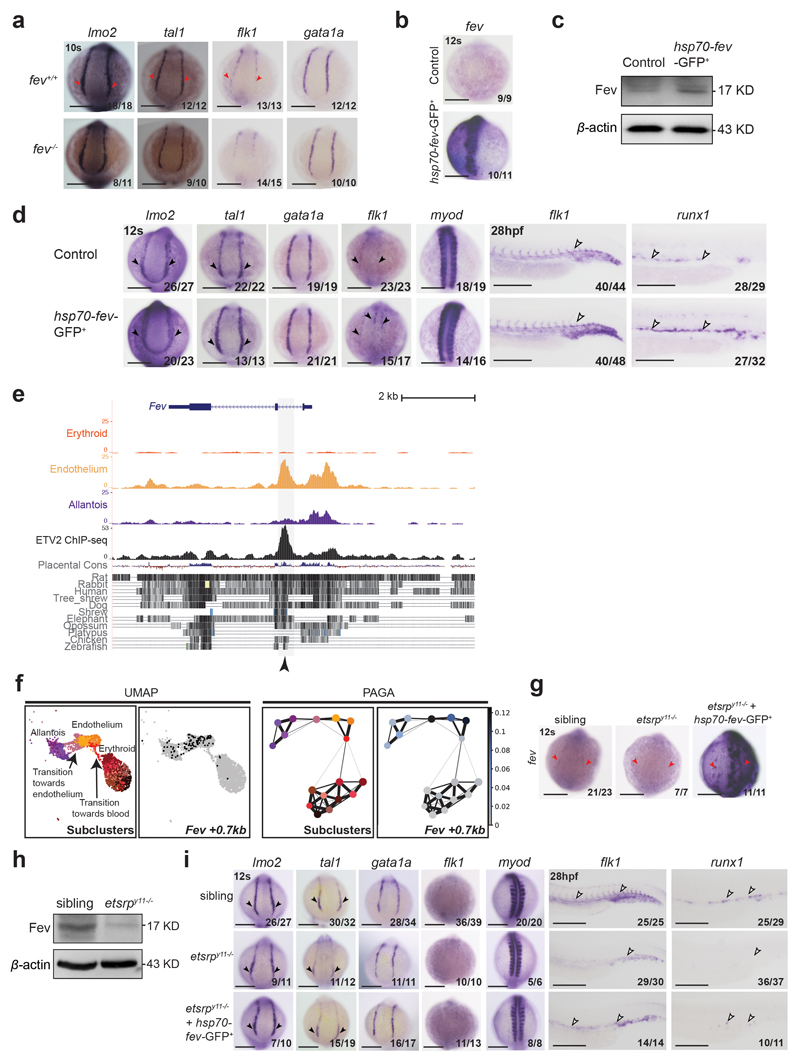
Previous fev loss of function experiments in zebrafish had revealed a specific role during haematopoietic emergence from endothelium42, which placed FEV at the opposite end of haemato-endothelial development compared to the early regulator ETV2. However, our analyses suggested a role in conferring endothelial cell identity. We therefore tested this hypothesis in zebrafish by first examining fev-/- zebrafish embryos42. At 10-somite (10s) stage, the haemato-endothelial progenitor genes lmo2 and tal1, and the endothelial progenitor gene flk1 presented relatively lower expression levels compared to control zebrafish (Extended Data Fig. 10a), suggesting that Fev has a partial impact on endothelial development. Next, we evaluated the effect of fev overexpression by injecting fev mRNA into 1-2 cell-stage zebrafish wildtype embryos. In addition to an increase of fev RNA, this resulted in the upregulation of lmo2 and tal1 at 10s, flk1 at 26 hours post-fertilisation (hpf), but not the primitive haematopoietic marker gata1a at 10s (Fig. 8a), thus supporting a role for fev in conferring endothelial identity. Furthermore, consistent with the definitive blood wave emerging from endothelium, the definitive haematopoietic marker runx1 was overexpressed in the dorsal aorta at 26hpf (Fig. 8a). We obtained similar results when inducing fev at the 3-somite (3s) stage using a heatshock-inducible system, where hsp70-fev-eGFP was injected (Extended Data Figs. 10b-d).
Fig. 8. fev rescues haemato-endothelial defects in etsrp morphants.
a, Whole-mount in situ hybridization (WISH) of haematopoietic and endothelial progenitor markers lmo2 and tal1, primitive blood marker gata1a, endothelial marker flk1, definitive blood marker runx1 and somitic marker myod (used as control) in control embryos (top) and embryos injected with fev mRNA at 1-2 cell-stage. b, WISH of lmo2, tal1, gata1a, fev, flk1, runx1 and myod (used as control) in control embryos (top), etsrp morphant embryos (etsrpMO, middle), and etsrp morphant embryos co-injected with fev mRNA at 1-2 cell-stage (bottom). Black arrowheads highlight the expression (control), the reduction or absence of expression (etsrp MO) and the expanded expression (fev mRNA injection) in the posterior lateral plate mesoderm (PLPM). White arrowheads indicate these patterns in the trunk vessels. Embryos are shown on the dorsal view at 10 somite (10s) stage, and the lateral view at 26 hours postfertilization (26hpf). Fractions in the panels depict the number of embryos that showed similar results out of the total number of embryos analysed. Scale bars: 200 μm.
In our whole embryo single-cell expression atlas8, Fev appears to be expressed after Etv2 along the differentiation journey towards endothelium (Fig. 7f and Extended Data Fig. 9e), suggesting that Fev could be regulated by ETV2. Consistently, the previously published ETV2 ChIP-seq dataset41 showed ETV2 binding on the major OCR associated with Fev in our dataset (Fev +0.7kb) (Extended Data Fig. 10e). Moreover, accessibility of this region peaked in the middle of the reconstructed differentiation trajectory from allantois to endothelium described in Fig. 7b (pattern 7) (Extended Data Fig. 10f). We therefore hypothesised that FEV might play a previously unrecognized role in establishing the endothelial program downstream of ETV2 which could be revealed by demonstrating that Fev expression can rescue the haemato-endothelial defects seen in Etv2 mutants. To test this, we first assessed the expression of fev in etsrp morphants (etsrp is the zebrafish equivalent of mouse Etv2), which was absent (Fig. 8b). Furthermore, lmo2, tal1 and flk1 were reduced in the morphants (Fig. 8b). Next, we overexpressed fev in etsrp morphants by injecting fev mRNA at 1-2 cell-stage embryos, which partially rescued the expression of lmo2 and tal1 at 10s, as well as flk1 and runx1 at 26 hpf (Fig. 8b). Importantly, we also obtained similar findings when examining etsrp mutants (etsrpy11)43 and when overexpressing fev at 3s stage in the etsrp-null background using the fev heatshock-inducible overexpression system (Extended Data Figs. 10g-i). Taken together, these functional in vivo experiments place fev as a regulator of the first stages of haemato-endothelial development downstream of etsrp. Of note, endothelial-specific OCRs near the Tal1 and Lmo2 loci overlap with previously validated transcriptional enhancers containing functional ETS factor motifs44–46, consistent with a potentially direct control of these key regulators by ETV2 and FEV. More broadly, we illustrate how integrated analysis of complementary expression and chromatin single-cell whole embryo datasets can illuminate the transcriptional programs responsible for establishing the diverse cell lineages required to build a complex mammalian organism.
Discussion
Establishing cell type-specific transcriptional programs represents a hallmark of all metazoan development. Understanding the nature of these programs is thus key to decoding how cell type diversity is generated. Since the underlying gene regulatory information is encoded in the primary genome sequence, an intuitive way to access this information is to directly map regions of open chromatin, because regulatory elements are depleted of nucleosomes specifically in those cell types where they are functionally active. Recently developed single-cell chromatin mapping techniques obviate the need for cell type purification, thus enabling analysis of complex tissues with low cell numbers, such as the early mouse embryo, as single-cell chromatin profiles are grouped retrospectively1,2,4. Here we have shown how this approach can reveal the chromatin landscapes for all the major cell types in a developing mammal. Moreover, targeted functional validation focused on the endothelium demonstrates how embryo-wide maps of open chromatin can be used to identify gene regulatory sequences and regulatory transcription factors. Defining these key building blocks of transcriptional regulatory networks, especially if performed across a developmental time-course, holds great promise for the future decoding of the mechanistic blueprint underpinning mammalian development.
Online Methods
Mouse embryo collection
All procedures were performed in strict accordance to the UK Home Office regulations for animal research and under the licence number 70/8406. Mice were bred and maintained at the University of Cambridge, in ventilated cages with sterile bedding; sterile food and water were provided ad libitum. All animals were kept in pathogen-free conditions. Timed-matings were set up between C57BL/6 mice, purchased from Charles River. Mouse embryos were not selected for gender and were dissected at embryonic day (E) 8.25 in 1X PBS + 2% FCS and placed individually onto a parafilm strip. Overflowing liquid was removed and each parafilm strip was inserted into a cryovial, which was subsequently snap-frozen in liquid nitrogen. Frozen cryovials were stored at -80C.
Single-nucleus ATAC-seq
Combinatorial barcoding single nuclear ATAC-seq was performed as described previously with slight modifications2,4,47. Ten mouse embryos were suspended in 1 ml nuclei permeabilization buffer: 10mM Tris-HCL (pH 7.5), 10mM NaCl, 3mM MgCl2, 0.1% Tween-20 (Sigma), 0.1% IGEPAL-CA630 (Sigma) and 0.01% Digitonin (Promega) in water48 and homogenized by pipetting 10 times. Homogenized embryos were filtered with a 30 μm filter (CellTrics). Nuclei were pelleted with a swinging bucket centrifuge (500 x g, 5 min, 4°C; 5920R, Eppendorf) and resuspended in 500 μL high salt tagmentation buffer (36.3 mM Tris-acetate (pH = 7.8), 72.6 mM potassium-acetate, 11 mM Mg-acetate, 17.6% DMF) and counted using a haemocytometer. Concentration was adjusted to 1,500 nuclei/5 μl, and 1,500 nuclei were dispensed into each well of two 96-well plates (total of 192 wells). For tagmentation, 1 μL barcoded Tn5 transposomes (Supplementary Table 1) were added using a BenchSmart™ 96 (Mettler Toledo), mixed five times and incubated for 60 min at 37 °C with shaking (500 rpm). To inhibit the Tn5 reaction, 6 μL of 40 mM EDTA were added to each well with a BenchSmart™ 96 (Mettler Toledo) and the plate was incubated at 37 °C for 15 min with shaking (500 rpm). Next, 12 μL 2 x sort buffer (2 % BSA, 2 mM EDTA in PBS) were added using a BenchSmart™ 96 (Mettler Toledo). All wells were combined into a FACS tube and stained with 3 μM Draq7 (Cell Signaling Technology #7406; LOT# 31DR71000). Using a SH800 (Sony), 40 nuclei were sorted per well into eight 96-well plates (total of 768 wells) containing 10.5 μL EB (25 pmol primer i7, 25 pmol primer i5, 200 ng BSA (Sigma) (see Supplementary Table 1 for barcodes). During the sort, two populations, corresponding to nuclei with 2 (2n) and 4 copies (4n) of DNA, respectively, were detected. We sorted one 96 well plate each for 2n and 4n nuclei, respectively, and 6 plates for both populations of nuclei (Extended Data Fig. 1b). Preparation of sort plates and all downstream pipetting steps were performed on a Biomek i7 Automated Workstation (Beckman Coulter). After addition of 1 μL 0.2% SDS, samples were incubated at 55 °C for 7 min with shaking (500 rpm). 1 μL 12.5% Triton-X was added to each well to quench the SDS. Next, 12.5 μL NEBNext High-Fidelity 2× PCR Master Mix (NEB) were added and samples were PCR-amplified (72 °C 5 min, 98 °C 30 s, (98 °C 10 s, 63 °C 30 s, 72°C 60 s) × 12 cycles, held at 12 °C). After PCR, all wells were combined. Libraries were purified according to the MinElute PCR Purification Kit manual (Qiagen) using a vacuum manifold (QIAvac 24 plus, Qiagen) and size selection was performed with SPRI Beads (Beckmann Coulter, 0.55x and 1.5x). Libraries were purified one more time with SPRI Beads (Beckmann Coulter, 1.5x). Libraries were quantified using a Qubit fluorimeter (Life technologies) and the nucleosomal pattern was verified using a Tapestation (High Sensitivity D1000, Agilent). Libraries were sequenced with NextSeq500 (three 50 paired-end sequencing runs), and HiSeq2500 (one 100 paired-end run) (Illumina) (Supplementary Table 2) using custom sequencing primers with following read lengths: 50 + 10 + 12 + 50 (Read1 + Index1 + Index2 + Read2). Sequences for sequencing primers are as follows: Read1: 5’ – GCG ATC GAG GAC GGC AGA TGT GTA TAA GAG ACA G – 3’, Read2: 5’ – CAC CGT CTC CGC CTC AGA TGT GTA TAA GAG ACA G – 3’, Index1: 5’ – CTG TCT CTT ATA CAC ATC TGA GGC GGA GAC GGT G – 3’, Index2 for NextSeq500: 5’ – GCG TGG AGA CGC TGC CGA CGA – 3’ (for HiSeq2500, we used the original Illumina primer for Index2).
Data processing
To make a consistent annotation of barcodes between the different platforms, we reverse complemented the I2 barcode sequence of the reads obtained with HiSeq2500. Fastq files were merged and mapped using Bowtie249 with -t -X 2000 --no-mixed --no-discordant and the mm10 genome. Next, SAM files were pre-processed using samtools and the snATAC_pre script developed in4 (https://github.com/r3fang/snATAC/blob/master/bin/snATAC_pre) with parameters -m 20 (filter out MAPQ < 20) -f 2000 (maximum fragment length) -e 75 (read extension) and with slight modifications. More specifically, we centred the reads in the cutting site (i.e. 5’ end of each read) and considered each one a fragment: for reads in the forward strand, we considered the start position of the read + 4 bp as the centre of the fragment and extended +/- 75 bp each way; for reads in the reverse strand, we considered the end position of the read – 5 bp as the centre of the fragment and extended +/- 75 bp each way. The number of reads that passed each pre-processing step can be found in Supplementary Table 3.
Visualisation
A binary accessibility matrix was taken as input. Regions with 0 counts were discarded. cisTopic9 was applied to the binarized data by running “runModels” (cisTopic v0.2.2, R package) on a cisTopic object containing the data. In all cases, the best model was selected using “selectModel” (cisTopic v0.2.2, R package). A neighbourhood graph was subsequently calculated on the resulting topics using pp.neighbours with default parameters from Scanpy v1.4.4 (Python), and a UMAP was then computed with tl.umap (Scanpy v1.4.4; Python) using default parameters.
Nucleus quality control, doublet removal and peak calling
Barcodes were filtered out if they satisfied the following two criteria: (a) a total number of reads less than or equal to 2,000 and (b) coverage of constitutive promoters less than or equal to 3% (Extended Data Fig. 2a) – the list of constitutive promoters contains the coordinates of 5,006 promoters (TSS / TSS – 2 kb) that are accessible in the majority of datasets based on ENCODE DNase Hypersensitive Sites and ATAC-seq data, and that was generated in ref. 44 (Supplementary Table 4). Next, we called peaks on the pooled sample of high-quality barcodes using macs2 callpeak50 (macs2 2.1.0.20150420) with p-value 0.05, --nomodel, --shift 0, --extsize 150 and discarded peaks falling in blacklisted mm10 genomic regions from the ENCODE Project Consortium51 using bedtools intersect (v2.21.0). The resulting peak summits were extended +/- 250 bp and subsequently merged with the promoter coordinates of genes from ensembl GRCm38.92 (from TSS to TSS – 500 bp) using bedtools merge (v2.21.0). An accessibility matrix was then generated using the snATAC_bmat script developed in4 (https://github.com/r3fang/snATAC/blob/master/bin/snATAC_bmat). Using the binary accessibility matrix as input, doublet scores were computed using the scrublet module v0.2 (Python)52. Nuclei with a score above 0.4 were considered a doublet and were removed. The remaining nuclei were then visualised by computing the steps in the “Visualisation” section, and clustered using tl.louvain from Scanpy v1.4.4 with resolution = 1 on the matrix obtained after running cisTopic. For each cluster, peaks were subsequently called and only those with – log(q-value) > 30 were retained. Peak summits were extended +/- 250 bp and merged with the previous list of coordinates using bedtools merge (v2.21.0), which resulted in a final list of 305,187 genomic regions. An accessibility matrix was then generated using the snATAC_bmat script developed in4 (https://github.com/r3fang/snATAC/blob/master/bin/snATAC_bmat). Nuclei with a percentage of reads in called genomic regions less than or equal to 24% were discarded and 19,453 nuclei were retained. All metadata for these nuclei, including cell type annotation, can be found in Supplementary Table 5.
Generation of bigWig tracks
A BED file was generated for each cell type, containing all the reads belonging to the nuclei annotated with that specific cell type label. BED files were converted to BedGraph files using bedtools genomecov -bg (v2.21.0) and chromosome sizes for the mm10 genome. The coverage of each region was normalised by multiplying it times 107 and dividing by the total coverage. A bigWig file was then generated using bedGraphToBigWig (v4).
Cell type annotation
The resulting binary matrix containing 19,453 nuclei and 305,187 genomic regions was visualised following the steps in the “Visualisation” section, and nuclei were clustered using tl.louvain from Scanpy v1.4.4 with resolution = 1 on the cisTopic matrix. Clusters were subsequently annotated using the transcription start sites (TSS) of gene markers previously reported for cell types present at this embryonic stage8. For the heatmap in Extended Data Fig. 2b, for each cell type, the frequency of nuclei with open chromatin in the TSS of genes that are expressed specifically in them was calculated, and the values for each gene were subsequently normalised so that the maximum value was 1. The marker gene list was curated by using the transcriptomic atlas from8 containing cells from E8.25 mouse embryos.
Transcription factor motif enrichment analysis
To calculate the transcription factor (TF) motif enrichment on regions uniquely contributing to each topic from cisTopic, genomic regions were lifted over to the mm9 genome with the “liftOver” function (rtracklayer v1.42.2, R package). Using cisTopic v0.2.2 (R package) and with only those genomic regions uniquely contributing to each topic, TF motif enrichment analyses were performed with the “topicsRcisTarget” function, with nesThreshold=3, rocthr=0.005, maxRank=20000. To calculate TF motif enrichment at the single-cell level, chromVAR19 was run in the raw accessibility matrix using the “mouse_pwms_v2” motif collection. To find the most significantly enriched transcription factor motifs in each cell type, we first performed a Wilcoxon rank-sum test with tl.rank_genes_groups (Scanpy v1.4.4; Python) using the calculated chromVAR Z-scores for each motif and nucleus. Next, we selected those motifs with adjusted p-value < 0.0001 for each cell type and ranked them based on the Z-score computed with tl.rank_genes_groups (Scanpy v1.4.4; Python). Finally, we used the top 15 motifs as a signature for each cell type. To display the chromVAR Z-scores in the heatmap of Fig. 3b and Extended Data Fig. 4a, we averaged them by cell type and the values for each transcription factor motif were standardised so that the maximum value was 1.
Analysis of RNA of expression and integration with chromatin accessibility
To assess the expression of specific transcription factors, we used the transcriptomic profiles of cells collected from E8.25 mouse embryos, generated in7,8. Raw counts were normalised as follows: first, for the computation of size factors, genes with an average count below 0.1 were discarded. Next, size factors were computed using computeSumFactors (scran package v1.10.2, R), with clusters calculated using the quickCluster function (scran package v1.10.2, R), sizes 48, 72, 145 and a maximum cluster size of 3,000. The raw counts matrix was then normalised using these size factors and log-transformed. Gene expression levels were then averaged by cell type and used for integration with snATAC-seq by matching cell type labels from both datasets. For those cell type labels that did not match between datasets, we used the following matching strategy: “Erythroid1-3” in the RNA expression matrix were assigned to “Erythroid” in snATAC-seq, , “Forebrain/Midbrain/Hindbrain” to “Forebrain” and to “Midbrain/Hindbrain”, “Intermediate mesoderm” and “ExE mesoderm” to “Mixed mesoderm”.
Peak annotation
Genomic regions were annotated using “assignGenomeAnnotation” from the HOMER Software53 (v4.10.3), with gene annotations from Mus musculus GRCm38.92. Annotation to exons and introns was prioritised. If peaks fell within the TSS or within TSS-1kb, they were annotated as TSS. Each region was associated to its closest gene(s) as follows: if the region was within a gene or within - 1kb from the TSS, it was associated to that gene. For those regions that were unassigned to a gene, if the region was +/- 50kb from a gene, that gene was associated to the region. Of note, if multiple genes were found within +/- 50kb from the region, all of them were associated to that region.
Analysis of co-regulation across genomic regions
The binary accessibility matrix was taken as input. Regions with 0 counts were discarded. Data was then TF-IDF transformed using the TfidfTransformer function from scikit-learn v0.20.2 module in Python, with smooth_idf = True. The TF-IDF transformed matrix was transposed and principal component analysis (PCA) was computed on it using tl.pca from Scanpy v1.4.4 (Python). Subsequently, a neighbourhood graph was calculated using pp.neighbours from Scanpy v1.4.4 (Python), with number of neighbours = 15 and number of principal components (PCs) = 50. Using the principal components, a UMAP was then computed with tl.umap (Scanpy v1.4.4; Python). Accessibility was computed as the percentage of nuclei with a specific genomic region open. Data for this analysis can be found in Supplementary Table 6.
Definition of cell type-specific regions and analysis
First, we generated a matrix containing the number of open regions in each cell type for each genomic region. Then, for each of these regions, we computed whether the number of open regions in each cell type was significantly more compared to all the rest of cell types using one-sided Fisher’s tests. P-values were BH-corrected. Those genomic regions with a q-value < 0.01 for at least one cell type were retained. For those genomic regions, another round of testing using one-sided Fisher’s test was performed, where cell types were compared pairwise for each genomic region. P-values were BH-corrected and those genomic regions with a q-value < 1x10⁻¹⁰ in at most 9 cell types were retained and categorised as a cell type-specific for those cell types where it resulted significantly more open. Cell type-specific regions can be found in a column in Supplementary Table 6. To compute the overlap of cell type-specific regions between cell types, the Jaccard similarity index was computed. For this, a binary matrix of cell types (columns) and cell type-specific regions (rows) was generated, where “1” was assigned if a particular region was cell type-specific in a determined cell type. Adjacency and union matrices were computed from it and were used to compute the Jaccard similarity index (= adjacency/union). Before plotting the heatmap with heatmap.2 (gplots package v3.0.1.1), the diagonal was set to 0. To perform GO term enrichment analyses, the R packages org.Mm.eg.db (v3.7.0), GO.db (v3.7.0), topGO (v2.34.0) and GOstats (v2.48.0) were used and the hyperGTest function was applied for statistical testing with p-value cutoff threshold set to 0.001, and with the alternative hypothesis being above the mean. FDR was obtained by adjusting the p-values with BH correction.
Analysis of ChIP-seq datasets
The TAL1 ChIP-seq tracks and peaks for haemogenic endothelium reported in32, the HPC-7 ChIP-seq tracks for TAL1, LYL1, LMO2, GATA2, RUNX1, ERG and FLI-1 reported in34, and the HPC-7 DNase-seq track were obtained from http://codex.stemcells.cam.ac.uk/. Heptad peaks (mm9) were obtained from34 and lifted over to mm10 using the LiftOver tool from UCSC. Overlaps between these files and the endothelial-specific genomic region list were computed using bedtools intersect (v2.21.0) and results can be found in Supplementary Tables 7-8. cisTopic (R package v0.2.2) was used to compute the ChIP-seq enrichment scores in the allantois, endothelium and erythroid cell types from the snATAC-seq dataset. Briefly, the likelihood of each genomic region contributing to each cell was computed using the “predictiveDistribution” function on the previously computed cisTopic object. Next, ChIP-seq signatures were obtained from the called peaks for each dataset using “getSignaturesRegions” and only unique peaks were kept. Cell rankings were subsequently computed with “AUCell_buildRankings” on the likelihood matrix and the signature enrichment was calculated using the “signatureCellEnrichment” function. The ETV2 ChIP-seq datasets were downloaded from the GEO repository (accession codes: GSM1436367-8) and reads were pooled together and processed as one sample using the pipeline established at http://codex.stemcells.cam.ac.uk/. Briefly, sequencing reads were mapped to the mm10 mouse reference genome using Bowtie249 and peaks were called with MACS250. Mapped reads were converted to density plots and displayed as UCSC genome browser tracks.
Dynamic accessibility patterns from allantois to endothelium
Topics were recalculated on the subset containing “Allantois”, “Endothelium” and “Erythroid” cell types using cisTopic v0.2.2 (R package). A neighbourhood graph was computed using pp,neighbours with the number of nearest neighbours set to 15 (Scanpy 1.4.4, Python). The landscape was re-clustered with tl.louvain (Scanpy 1.4.4, Python). The resulting sub-clusters were visualised with PAGA using tl.paga (Scanpy 1.4.4, Python). Pseudotime was performed on sub-clusters 0 (EC1), 4 (Al_EC) and 7 (Al1) using tl.dpt (Scanpy 1.4.4, Python), with the starting cell as the one having the highest value on the x-axis in a pre-computed force-directed graph (tl.draw_graph function, Scanpy 1.4.4, Python). To find the different accessibility patterns, we applied the same pipeline as in the endoderm analysis from8 on the accessibility matrix containing regions that present accessibility in 10 or more cells. Motif enrichment analyses on the regions contributing to the different patterns were performed with HOMER53 (v4.10.3) “findMotifsGenome.pl” function. To calculate the number of regions bound in vitro by ETV2 in each pattern, regions were intersected with ETV2 peaks with bedtools intersect (v2.21.0).
Expression profiles of the ETS factors during the establishment of endothelium
Cells from a previously published scRNA-seq dataset8 with labels “Mixed mesoderm”, “Allantois”, “Haematoendothelial progenitors” and “Endothelium” were isolated and normalised as in8. Batch correction was applied as in8. Using the first 50 batch-corrected PCs, a force-directed graph was performed with tl.draw_graph from Scanpy 1.4.4 (Python). Sub-clusters were computed using tl.louvain, resolution =1 (Scanpy 1.4.4, Python). To perform pseudotime from allantois to endothelium, sub-clusters 1 and 4 were isolated and diffusion pseudotime was applied to them with tl.dpt (Scanpy 1.4.4, Python) with the starting cell as the one located on the top corner of the force-directed graph of the subset. To perform pseudotime from Mixed mesoderm to endothelium, sub-clusters 0, 3, 7, 8, and 11 were isolated and diffusion pseudotime was computed on them with tl.dpt (Scanpy 1.4.4, Python) with the starting cell as the one located on the top of the force-directed graph of the subset. Sub-cluster information can be found in Supplementary Table 10. To define the expression profile of the ETS genes, we applied the same pipeline as in the endoderm analysis from8, without standardising the counts, on the expression matrix containing the ETS genes with a variance > 0.15 (these were considered highly variable).
In vivo mouse transgenic assays
DNA fragments were amplified from mouse genomic DNA using standard molecular biology protocols and the primer sequences 5' – AGGGGATCCCAAAATGGCTGCACTTGAGG – 3’ (forward primer) and 5' – GAGGTCGACGCTGGCACTTTGGTGATTTC – 3’ (reverse primer) for Maml3 +360kb, and 5' – TAAGGATCCACATTTCAACCCCAGAGCAG – 3’ (forward primer) and 5' – TAAGTCGACCAGGTCCTGTGGCTCTTTTC – 3’ (reverse primer) for Flt1 +67kb. The amplified DNA was digested with BamHI and SalI (New England Biolabs) and inserted into β-galactosidase (lacZ) reporter constructs containing the SV40 minimal promoter by ligation with T4 DNA ligase (New England Biolabs). Cloning success was confirmed by sequencing using the service provided by SourceBioSciences. For microinjection, DNA was digested with restriction enzymes to remove the plasmid backbone. The correct size of the DNA fragment was recovered by DNA extraction from an agarose gel using the QIAquick Gel Extraction Kit (Qiagen) and diluted to 100 ng/μl. E11.5 F0 transgenic embryos were generated through pronuclear injection of the β-galactosidase reporter constructs by Cyagen Biosciences Inc (Guangzhou, China). Whole-mount embryos were stained with 5-bromo-4-chloro-3-indolyl-β-d-galactopyranoside (X-Gal) for β-galactosidase expression. Stained embryos from Cyagen Biosciences were fixed in PBS containing 10 % formaldehyde overnight. Embryos were stored in 70 % ethanol at 4°C. Whole mount images were acquired using a Nikon Digital Sight DS-FL1 camera attached to a Nikon SM7800 microscope (Nikon, Kingston-upon-Thames, UK).
Zebrafish strains
Adult zebrafish strains including AB, fev-/-42 and etsrpy11 ref.43 were raised in system water at 28.5°C and staged as previously described54. Embryos were not selected for gender and were collected at 10-12 somite stages and between 26-28 hpf. This study was approved by the Ethical Review Committee of Institute of Zoology, Chinese Academy of Sciences, China and is compliant with all relevant ethical regulations regarding animal research.
Morpholino, mRNA synthesis, plasmid construction and microinjection
The antisense morpholinos (MO) for etsrp were purchased from GeneTools and prepared as 1mM stock solutions using ddH2O. The sequence of etsrp MO is: 5' - TTGGTACATTTCCATATCTTAAAGT - 3', described as previously reported55. Capped fish fev full-length mRNA for injection was synthesized from NotI-digested pCS2+ expression plasmid using the mMessage mMachine SP6 kit (mMessage mMachine SP6 kit; Ambion, AM1340). For fish embryo injections, etsrp MO (0.4mM) with capped fev mRNA (100pg) were injected alone or in combination, into 1-2 cell-stage zebrafish wildtype embryos at the yolk/blastomere boundary. For temporal-controlled overexpression of fev, the fev full-length cDNA was cloned into a pDNOR221 vector by BP reaction (Gateway BP Clonase II Enzyme mix; Invitrogen, 11789020) and then subcloned into pDestTol2pA2 with hsp70 promoter and EGFP reporter by LR reaction (LR Clonase II Plus enzyme; Invitrogen, 12538200) by Gateway systems. After injection of hsp70-fev-eGFP together with tol2 mRNA to wildtype and etsrpy11, the embryos were heat-shocked at 37°C for 1 hour at 3s.
Whole-mount in situ hybridization
Whole-mount in situ hybridization (WISH) for zebrafish embryos was performed with RNA probes, including tal1, lmo2, gata1a, flk1, myod and runx1 as described previously56. The fixed embryos were dehydrated with methyl alcohol and washed with PBST, then hybridized with DIG-labeled antisense RNA probe at 65°C for more than 12 hours (h). After washing with 2X SSC, 0.2X SSC and blocking with MAB block reagent, embryos were incubated with anti-DIG-AP antibody (anti-DIG-AP, Roche, 11093274910; AB_2734716) (1:5000) at 4°C overnight. After removing antibody and washing the embryos with MABT and BCL buffer, embryos were stained with BM-purple reagent (BM purple, Roche, 11621) (1:1).
Western blotting
Zebrafish etsrpy11-/- sibling, etsrpy11-/-, control and hsp70-fev-eGFP embryos at 10-12s were manually homogenized with a 1-ml syringe and needle in cell lysis buffer (10mM Tris-HCl, pH 8.0, 10mM NaCl and 0.5% NP-40) containing protease inhibitor at 1X concentration (one tablet in 2ml redistilled water as 25× concentration). Lysate was centrifuged at 12,000 g for 2 min at 4 °C and the resulting supernatant was loaded as protein samples. The protocol was described previously42. The following antibodies were used: anti-Fev antibody42 (AbMax Biotechnology Co., Ltd., DWS009, 1:1000), anti-β-Actin antibody (Cell Signaling Technology, 4967, 1:2000). Quantification of each band was carried out on the Quantity One software (Bio-Rad, v4.3.0).
Statistics and Reproducibility
Statistical analyses were performed using R. Full statistical details for each experiment can be found in the corresponding subsection of Methods. Statistical tests used and sample sizes are also provided in the figure legends. Mouse transgenic assays were performed at least 5 times. All zebrafish WISH experiments were performed at least 10 times. Western blots were repeated 3 times.
Extended Data
Extended Data Fig. 1. snATAC-seq experiment.
a, E8.25 embryos used for snATAC-seq. This panel includes the embryo in Fig. 1a (top right in this panel). Scale bar: 0.5mm. Experiment was performed with 10 embryos. b, Representative FACS gating strategy. The gate used to sort the nuclei regardless of DNA ploidy can be found in the bottom left panel. Gates for nuclei with 2 (2n) and 4 copies (4n) of DNA can be found in the bottom right panel.
Extended Data Fig. 2. Data quality control and cell type annotation.
a, Quality control (QC) thresholds. Top: X-Y plot showing the number of reads in peaks and promoter coverage for each barcode. Promoter coverage is defined as the number of reads in constitutive promoters divided by the total number of constitutive promoters. Values have been log-transformed. Red square box delimits the nuclei that passed QC for these parameters. Middle: Histogram showing the doublet scores for the nuclei that passed the first QC. Red line delimits the threshold; those below the line passed QC. y-axis has been log-transformed. Bottom: Histogram showing the ratio of reads in peaks for those nuclei that passed QC in the panels above. Red line delimits the threshold; nuclei above this line passed QC. b, Heatmap illustrating the row-normalised frequency (from dark blue/low to yellow/high) of nuclei for each cell type with open chromatin in the transcription start site (TSS) of genes that are expressed specifically in them. Marker gene list has been curated by using a previously reported transcriptomic atlas, containing this stage8. c, Frequency of nuclei based on their DNA content per cell type. For this plot, we only considered the nuclei sorted with the “4n” and “2n” gates from Extended Data Fig. 1b.
Extended Data Fig. 3. Transcription factor motif enrichment analyses.
a, Heatmap showing the motif enrichment scores (NES) for transcription factor (TF) motifs enriched in OCRs uniquely contributing to topics 38, 51 and/or 100. Values are represented by a colour gradient from dark blue (0) to dark red (8.9). Sequence logos are shown on the left. b, UMAP visualisation showing the motif enrichment scores for GATA1-6 using chromVAR on the 19,453 cells. Values are represented by a colour gradient from dark blue (low, below 0) to red (high, above 0). Cells with values of 0 are depicted in grey. Sequence logos for each member can be found at the bottom right corner of each plot. c, Histogram showing the number of regions containing GATA binding sites per topic.
Extended Data Fig. 4. Motif enrichment scores and sharing between gut and surface ectoderm.
a, Complete heatmap of transcription factor motif enrichment Z-scores (from blue/low/-1 to red/high/+1) showing all transcription factor (TF) names (extended from Fig. 3b). b, Barplot showing the number of cell type-specific OCRs that are shared in a defined number of cell types, highlighted on the x-axis. c, GO terms for genes associated with regions specific for surface ectoderm that are not shared with gut (n=1,018). d, GO terms for genes associated with regions specific for gut that are not shared with surface ectoderm (n=1,058). e, GO terms for genes associated with regions specific for gut and surface ectoderm that are shared between these lineages (n=227). Values obtained from one-sided hyperGTest and BH-corrected.
Extended Data Fig. 5. allantoic-haemato-endothelial development.
a, Simplified diagram of allantoic-haemato-endothelial development. Early mesoderm generates different lineages including allantoic cells, erythrocytes and endothelial cells (ECs). The precursors of the first wave of primitive erythrocytes express genes commonly associated with ECs, thus making the distinction between erythroid and endothelial precursors (Haemato-endothelial precursors) difficult by their transcriptomes. Yolk sac (YS) ECs give rise to the definitive blood wave by generating erythro-myeloid progenitors (EMPs). The allantois also contributes to the EC pool by generating allantoic ECs. b, UMAP visualisation (left) and PAGA representation as in Fig. 7a (right) of the allantoic-haemato-endothelial landscape (n=3,284 cells) showing the chromatin accessibility at the Runx1 +23kb enhancer. Black dots in UMAP on the right correspond to nuclei where the region is accessible. Accessibility in PAGA is represented by the ratio of nuclei per cluster (from grey to dark blue) that have Runx1 +23kb accessible. c, PAGA representation as in Fig. 7a showing the mean enrichment scores per cluster (from gray=0 to dark blue=1) for TAL1 ChIP-seq peaks from haemangioblasts, haemogenic endothelium and haematopoietic progenitors. Sub-clusters for PAGA have been defined in Fig. 7a. d, Venn diagram showing the number of endothelial-specific regions from the snATAC-seq dataset, the number of TAL1-bound regions obtained by ChIP-seq in haemogenic endothelial cells from32, and their overlap. ChIP-seq peaks were taken from http://codex.stemcells.cam.ac.uk/.
Extended Data Fig. 6. Erg +85kb and Fli1 -15kb enhancers.
a-b, Genome browser tracks showing the Erg (a) and the Fli1 (b) loci. Black arrowheads indicate the Erg +85kb (top) and the Fli1 -15kb (bottom) enhancers. Tracks correspond to the snATAC-seq profiles of the erythroid, endothelium and allantois cell types after cell pooling, TAL1 ChIP-seq for haemogenic endothelial cells (“HE TAL1 ChIP-seq”, grey), H3K27ac ChIP-seq for haemogenic endothelial cells (“HE H3K27ac”, gold), TAL1 ChIP-seq for haemangioblasts (“Haem. TAL1 ChIP-seq”, grey), H3K27ac ChIP-seq for haemangioblasts (“Haem. H3K27ac”, gold), TAL1 ChIP-seq for haematopoietic progenitors (“HP TAL1 ChIP-seq”, grey), H3K27ac ChIP-seq for haematopoietic progenitors (“HP H3K27ac”, gold) from32, TAL1 ChIP-seq for HPC-7 cells (“HPC-7 TAL1 ChIP-seq”, grey) and DNase-seq for HPC-7 cells (blue). Publicly available tracks were obtained from http://codex.stemcells.cam.ac.uk/. c, UMAP visualisation of the allantoic-haemato-endothelial landscape (n=3,284 cells) showing the enrichment score (from grey/low to dark blue/high) for HPC-7 TAL1 ChIP-seq peaks.
Extended Data Fig. 7. Flt1 +67kb and Maml3 +360kb enhancers.
a-b, Genome browser tracks showing the Flt1 (a) and the Maml3 (b) loci. Black arrowheads indicate the Flt1 +67kb (top) and the Maml3 +360kb (bottom) enhancers. Tracks correspond to the snATAC-seq profiles of the erythroid, endothelium and allantois cell types after cell pooling, TAL1 ChIP-seq for haemogenic endothelial cells (“HE TAL1 ChIP-seq”, grey), H3K27ac ChIP-seq for haemogenic endothelial cells (“HE H3K27ac”, gold), TAL1 ChIP-seq for haemangioblasts (“Haem. TAL1 ChIP-seq”, grey), H3K27ac ChIP-seq for haemangioblasts (“Haem. H3K27ac”, gold), TAL1 ChIP-seq for haematopoietic progenitors (“HP TAL1 ChIP-seq”, grey), H3K27ac ChIP-seq for haematopoietic progenitors (“HP H3K27ac”, gold) from32, TAL1 ChIP-seq for HPC-7 cells (“HPC-7 TAL1 ChIP-seq”, grey) and DNase-seq for HPC-7 cells (blue). Publicly available tracks were obtained from http://codex.stemcells.cam.ac.uk/.
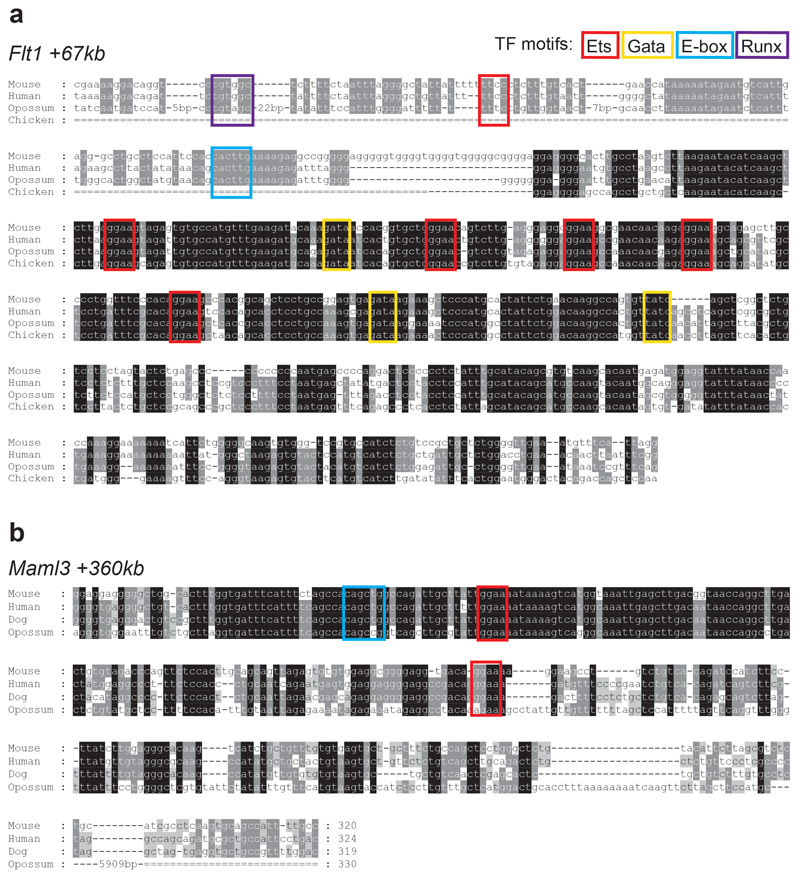
Extended Data Fig. 8. Evolutionary conservation of Flt1 +67kb and Maml3 +360kb.
Alignment of Flt1 +67kb (a) and Maml3 +360kb (b) across species. Transcription factor (TF) binding motifs are boxed: red: Ets sites; yellow: Gata sites; blue: E-box sites; purple box: Runx site.
Extended Data Fig. 9. Endothelial development from allantoic cells.
a, UMAP visualisation (n=3,284 cells) showing the pseudotime trajectory from allantois to endothelium as a gradient from grey to blue. Cells scored as 0 in the plot (grey) were not part of the trajectory. b, Heatmap showing the -log(P-value) obtained from a TF motif enrichment analysis on the accessibility patterns found in Fig. 7b using HOMER. -log(P-value) ranges from 0 (dark blue) to 311 (dark red). c, UMAP visualisation of the allantoic-haemato-endothelial landscape (n=3,284 cells) showing the enrichment score (from grey=0 to dark blue=1) for ETV2 ChIP-seq peaks from41. d, Force-directed graph showing cells from the “Mixed mesoderm”, “Allantois”, “Haemato-endothelial progenitors” and “Endothelium” that have been profiled with scRNA-seq in8 (n=7,631 cells). Cell colours show the different sub-clusters found when re-analysing this dataset. e, Expression dynamics of highly variable ETS factors (variance > 0.15) along the trajectory from mixed mesoderm to endothelium (top) and from allantois to endothelium (bottom). Cdh5 and Pecam1 have been added as positive controls for mature endothelium. Dots below plots represent the ordered cells coloured by the sub-clusters in panel (d).
Extended Data Fig. 10. fev plays a role in haematopoietic and endothelial development.
a, WISH showing the expression of lmo2, tal1, flk1 and gata1a in fev mutants at 10s. Dorsal view, anterior to the top. Red arrowheads indicate increased expression in fev+/+. b, WISH showing that the expression of fev at 12s was increased hsp70-fev-GFP transgenic embryos after heat-shock at 3s. c, Western blot showing the protein level of Fev increased in hsp70-fev-GFP transgenic embryos compared to control at 12s after heat-shock at 3s. d, WISH of lmo2, tal1, gata1a, flk1, myod and runx1 in control embryos (top) and embryos injected with hsp70-fev-GFP and tol2 mRNA and heat-shocked at 3s (bottom). Black arrowheads indicate the expression (top) and expanded expression (bottom) in the PLPM. White arrowheads indicate expression (top) and expanded expression (bottom) in the trunk vessels. Embryos are shown on the dorsal view at 12s stage, and the lateral view at 28 hpf. e, Genome browser tracks showing the Fev locus. Black arrowhead indicates the Fev +0.7kb region accessible in endothelium and bound by ETV2 in vitro. Tracks correspond to the snATAC-seq profiles of the erythroid, endothelium and allantois cell types after cell pooling, the ETV2 ChIP-seq from41 and evolutionary conservation tracks from UCSC. f, UMAP visualisation (left) and PAGA representation (right) of the allantoic-haemato-endothelial landscape (n=3,284 cells) showing the chromatin accessibility at the Fev +0.7kb region. Sub-clusters are as in Fig. 7a. Black dots in UMAP on the right correspond to nuclei where the region is accessible. Accessibility in PAGA is represented by the ratio of nuclei per cluster (from grey to dark blue) that have Fev +0.7kb accessible. g, WISH analyses showing the expression of fev in PLPM from etsrpy11-/- mutants, and etsrpy11-/- mutants with hsp70-fev-GFP and tol2 mRNA under heat-shock treatment at 3s. Red arrowheads highlight the area where fev is reduced in etsrpy11-/- mutants and where it is ectopically expressed after heat-shock treatment. h, Western blot analysis showing the protein level of Fev in sibling and etsrpy11-/- mutants. i, WISH of lmo2, tal1, gata1a, flk1, myod and runx1 in sibling embryos (top), etsrpy11-/- embryos (middle), and etsrpy11-/- embryos co-injected with hsp70-fev-GFP and tol2 mRNA and heat-shocked at 3s (bottom). Black arrowheads indicate the expression (top), reduction of expression (middle) and expanded expression (bottom) in the PLPM. White arrowheads indicate these patterns in the trunk vessels. Embryos are shown on the dorsal view at 12s stage, and the lateral view at 28 hpf. Fractions in the panels with zebrafish images depict the number of embryos that showed similar results out of the total number of embryos analyzed. Full, unmodified Western blots corresponding to panels (c) and (h) can be found in the Source Data file corresponding to this figure. Scale bars: 200 μm.
Supplementary Material
Acknowledgements
We thank Drs. Bing Ren and Kun Zhang for making this collaboration between the University of California San Diego and the University of Cambridge possible, Ivan Imaz-Rosshandler for statistical advice, Tina L. Hamilton and Central Biomedical Services for technical support in embryo collection, and Rongxin Fang for kindly providing us with the list of constitutive promoters. We also thank S. Kuan for sequencing and B. Li for bioinformatics support. We would like to extend our gratitude to the QB3 Macrolab at UC Berkeley for purification of the Tn5 transposase.
Funding
B.P.-S. is funded by the Wellcome Trust 4-Year PhD Programme in Stem Cell Biology and Medicine and the University of Cambridge, UK. B.P.-S was awarded a Travelling Fellowship from The Company of Biologists [DEV – 180505] to perform this study. Research in the authors’ laboratories is supported by the Wellcome, MRC, Bloodwise, CRUK and NIH-NIDDK; as well as core support grants from the Wellcome to the Wellcome-MRC Cambridge Stem Cell Institute. This work was funded as part of a Wellcome Strategic Award [105031/Z/14/Z] awarded to Wolf Reik, Berthold Göttgens, John Marioni, Jennifer Nichols, Ludovic Vallier, Shankar Srinivas, Benjamin Simons, Sarah Teichmann, and Thierry Voet. Work at the Center for Epigenomics was supported in part by the UC San Diego School of Medicine.
Footnotes
Code availability
All code is available upon request and at https://github.com/BPijuanSala/MouseOrganogenesis_snATACseq_2020.
Data availability statement
Raw sequencing data and processed data are available at GEO with accession number GSE133244. Previously published sequencing data that were re-analysed here are available under accession codes GSM1436367-8 (ETV2 ChIP-seq) and GSM1692843, GSM1692848 and GSM1692858 (TAL1 ChIP-seq). Processed TAL1 ChIP-seq data used in this publication is also available at http://codex.stemcells.cam.ac.uk/. Data are available in processed form for download and interactive browsing at https://gottgens-lab.stemcells.cam.ac.uk/snATACseq_E825. Cell type tracks can be explored at https://tinyurl.com/snATACseq-GSE133244-UCSC. All other data supporting the findings of this study are available from the corresponding author on reasonable request.
Author contributions
B.P.-S performed embryo dissections, bioinformatic analysis (both data pre-processing and biological analysis), created the website and coordinated the study. N.K.W., S.K. and F.J.C-N. performed enhancer validation experiments. J.X. performed experiments in zebrafish. X.H. performed snATAC-seq and was assisted by B.P.-S. R.L.H. processed the ETV2 ChIP-seq dataset. O.P. performed data demultiplexing and barcode extraction. S.P. supervised the snATAC-seq experiment, sequencing and initial data pre-processing. F.L. supervised experiments in zebrafish. B.G. supervised the study. B.P.-S. and B.G. wrote the manuscript. All authors read and approved the final manuscript.
Competing interests
The authors declare no competing interests.
References
- 1.Cao J, et al. Joint profiling of chromatin accessibility and gene expression in thousands of single cells. Science. 2018;361:1380–1385. doi: 10.1126/science.aau0730. [DOI] [PMC free article] [PubMed] [Google Scholar]
- 2.Cusanovich DA, et al. Multiplex single-cell profiling of chromatin accessibility by combinatorial cellular indexing. Science. 2015;348:910–914. doi: 10.1126/science.aab1601. [DOI] [PMC free article] [PubMed] [Google Scholar]
- 3.Pijuan-Sala B, Guibentif C, Göttgens B. Single-cell transcriptional profiling: a window into embryonic cell-type specification. Nat Rev Mol Cell Biol. 2018;19:399–412. doi: 10.1038/s41580-018-0002-5. [DOI] [PubMed] [Google Scholar]
- 4.Preissl S, et al. Single-nucleus analysis of accessible chromatin in developing mouse forebrain reveals cell-type-specific transcriptional regulation. Nat Neurosci. 2018;21:432–439. doi: 10.1038/s41593-018-0079-3. [DOI] [PMC free article] [PubMed] [Google Scholar]
- 5.Cusanovich DA, et al. The cis-regulatory dynamics of embryonic development at single-cell resolution. Nature. 2018;555:538–542. doi: 10.1038/nature25981. [DOI] [PMC free article] [PubMed] [Google Scholar]
- 6.Cao J, et al. The single-cell transcriptional landscape of mammalian organogenesis. Nature. 2019;566:496. doi: 10.1038/s41586-019-0969-x. [DOI] [PMC free article] [PubMed] [Google Scholar]
- 7.Ibarra-Soria X, et al. Defining murine organogenesis at single-cell resolution reveals a role for the leukotriene pathway in regulating blood progenitor formation. Nat Cell Biol. 2018;20:127–134. doi: 10.1038/s41556-017-0013-z. [DOI] [PMC free article] [PubMed] [Google Scholar]
- 8.Pijuan-Sala B, et al. A single-cell molecular map of mouse gastrulation and early organogenesis. Nature. 2019;566:490. doi: 10.1038/s41586-019-0933-9. [DOI] [PMC free article] [PubMed] [Google Scholar]
- 9.González-Blas CB, et al. cisTopic: cis-regulatory topic modeling on single-cell ATAC-seq data. Nat Methods. 2019;16:397–400. doi: 10.1038/s41592-019-0367-1. [DOI] [PMC free article] [PubMed] [Google Scholar]
- 10.Bellomo D, Lander A, Harragan I, Brown NA. Cell proliferation in mammalian gastrulation: The ventral node and notochord are relatively quiescent. Dev Dyn. 1996;205:471–485. doi: 10.1002/(SICI)1097-0177(199604)205:4<471::AID-AJA10>3.0.CO;2-4. [DOI] [PubMed] [Google Scholar]
- 11.Ilgren EB. Polyploidization of extraembryonic tissues during mouse embryogenesis. Development. 1980;59:103–111. [PubMed] [Google Scholar]
- 12.Anguita E, et al. Deletion of the mouse α-globin regulatory element (HS −26) has an unexpectedly mild phenotype. Blood. 2002;100:3450–3456. doi: 10.1182/blood-2002-05-1409. [DOI] [PubMed] [Google Scholar]
- 13.Hay D, et al. Genetic dissection of the α-globin super-enhancer in vivo. Nat Genet. 2016;48:895–903. doi: 10.1038/ng.3605. [DOI] [PMC free article] [PubMed] [Google Scholar]
- 14.Hughes JR, et al. Annotation of cis-regulatory elements by identification, subclassification, and functional assessment of multispecies conserved sequences. Proc Natl Acad Sci. 2005;102:9830–9835. doi: 10.1073/pnas.0503401102. [DOI] [PMC free article] [PubMed] [Google Scholar]
- 15.Craig ML, Russell ES. A developmental change in hemoglobins correlated with an embryonic red cell population in the mouse. Dev Biol. 1964;10:191–201. doi: 10.1016/0012-1606(64)90040-5. [DOI] [PubMed] [Google Scholar]
- 16.Hanssen LLP, et al. Tissue-specific CTCF–cohesin-mediated chromatin architecture delimits enhancer interactions and function in vivo. Nat Cell Biol. 2017;19:952–961. doi: 10.1038/ncb3573. [DOI] [PMC free article] [PubMed] [Google Scholar]
- 17.Tzouanacou E, Wegener A, Wymeersch FJ, Wilson V, Nicolas JF. Redefining the Progression of Lineage Segregations during Mammalian Embryogenesis by Clonal Analysis. Dev Cell. 2009;17:365–376. doi: 10.1016/j.devcel.2009.08.002. [DOI] [PubMed] [Google Scholar]
- 18.Tremblay M, Sanchez-Ferras O, Bouchard M. GATA transcription factors in development and disease. Development. 2018;145 doi: 10.1242/dev.164384. dev164384. [DOI] [PubMed] [Google Scholar]
- 19.Schep AN, Wu B, Buenrostro JD, Greenleaf WJ. chromVAR: inferring transcription-factor-associated accessibility from single-cell epigenomic data. Nat Methods. 2017;14:975–978. doi: 10.1038/nmeth.4401. [DOI] [PMC free article] [PubMed] [Google Scholar]
- 20.Moon KR, et al. Visualizing structure and transitions in high-dimensional biological data. Nat Biotechnol. 2019;37:1482–1492. doi: 10.1038/s41587-019-0336-3. [DOI] [PMC free article] [PubMed] [Google Scholar]
- 21.Ralston A, et al. Gata3 regulates trophoblast development downstream of Tead4 and in parallel to Cdx2. Development. 2010;137:395–403. doi: 10.1242/dev.038828. [DOI] [PubMed] [Google Scholar]
- 22.Nuez B, Michalovich D, Bygrave A, Ploemacher R, Grosveld F. Defective haematopoiesis in fetal liver resulting from inactivation of the EKLF gene. Nature. 1995;375:316. doi: 10.1038/375316a0. [DOI] [PubMed] [Google Scholar]
- 23.Parkins AC, Sharpe AH, Orkin SH. Lethal β-thalassaemia in mice lacking the erythroid CACCC-transcription factor EKLF. Nature. 1995;375:318. doi: 10.1038/375318a0. [DOI] [PubMed] [Google Scholar]
- 24.Desjardins CA, Naya FJ. The Function of the MEF2 Family of Transcription Factors in Cardiac Development, Cardiogenomics, and Direct Reprogramming. J Cardiovasc Dev Dis. 2016;3 doi: 10.3390/jcdd3030026. [DOI] [PMC free article] [PubMed] [Google Scholar]
- 25.Kallianpur AR, Jordan JE, Brandt SJ. The SCL/TAL-1 gene is expressed in progenitors of both the hematopoietic and vascular systems during embryogenesis. Blood. 1994;83:1200–1208. [PubMed] [Google Scholar]
- 26.Shivdasani RA, Mayer EL, Orkin SH. Absence of blood formation in mice lacking the T-cell leukaemia oncoprotein tal-1/SCL. Nature. 1995;373:432–434. doi: 10.1038/373432a0. [DOI] [PubMed] [Google Scholar]
- 27.Silver L, Palis J. Initiation of Murine Embryonic Erythropoiesis: A Spatial Analysis. Blood. 1997;89:1154–1164. [PubMed] [Google Scholar]
- 28.Palis J. Hematopoietic stem cell-independent hematopoiesis: emergence of erythroid, megakaryocyte, and myeloid potential in the mammalian embryo. FEBS Lett. 2016;590:3965–3974. doi: 10.1002/1873-3468.12459. [DOI] [PubMed] [Google Scholar]
- 29.Downs KM, Gifford S, Blahnik M, Gardner RL. Vascularization in the murine allantois occurs by vasculogenesis without accompanying erythropoiesis. Dev Camb Engl. 1998;125:4507–4520. doi: 10.1242/dev.125.22.4507. [DOI] [PubMed] [Google Scholar]
- 30.Ng CEL, et al. A Runx1 Intronic Enhancer Marks Hemogenic Endothelial Cells and Hematopoietic Stem Cells. STEM CELLS. 2010;28:1869–1881. doi: 10.1002/stem.507. [DOI] [PubMed] [Google Scholar]
- 31.Nottingham WT, et al. Runx1-mediated hematopoietic stem-cell emergence is controlled by a Gata/Ets/SCL-regulated enhancer. Blood. 2007;110:4188–4197. doi: 10.1182/blood-2007-07-100883. [DOI] [PMC free article] [PubMed] [Google Scholar]
- 32.Goode DK, et al. Dynamic Gene Regulatory Networks Drive Hematopoietic Specification and Differentiation. Dev Cell. 2016;36:572–587. doi: 10.1016/j.devcel.2016.01.024. [DOI] [PMC free article] [PubMed] [Google Scholar]
- 33.Beck D, et al. Genome-wide analysis of transcriptional regulators in human HSPCs reveals a densely interconnected network of coding and noncoding genes. Blood. 2013;122:e12–e22. doi: 10.1182/blood-2013-03-490425. [DOI] [PubMed] [Google Scholar]
- 34.Wilson NK, et al. Combinatorial Transcriptional Control In Blood Stem/Progenitor Cells: Genome-wide Analysis of Ten Major Transcriptional Regulators. Cell Stem Cell. 2010;7:532–544. doi: 10.1016/j.stem.2010.07.016. [DOI] [PubMed] [Google Scholar]
- 35.Pinto do OP, Kolterud A, Carlsson L. Expression of the LIM-homeobox gene LH2 generates immortalized steel factor-dependent multipotent hematopoietic precursors. EMBO J. 1998;17:5744–5756. doi: 10.1093/emboj/17.19.5744. [DOI] [PMC free article] [PubMed] [Google Scholar]
- 36.Butko E, Pouget C, Traver D. Complex regulation of HSC emergence by the Notch signaling pathway. Dev Biol. 2016;409:129–138. doi: 10.1016/j.ydbio.2015.11.008. [DOI] [PMC free article] [PubMed] [Google Scholar]
- 37.Kothary R, et al. A transgene containing lacZ inserted into the dystonia locus is expressed in neural tube. Nature. 1988;335:435. doi: 10.1038/335435a0. [DOI] [PubMed] [Google Scholar]
- 38.Pennacchio LA, et al. In vivo enhancer analysis of human conserved non-coding sequences. Nature. 2006;444:499. doi: 10.1038/nature05295. [DOI] [PubMed] [Google Scholar]
- 39.Craig MP, Sumanas S. ETS Transcription Factors in Embryonic Vascular Development. Angiogenesis. 2016;19:275–285. doi: 10.1007/s10456-016-9511-z. [DOI] [PMC free article] [PubMed] [Google Scholar]
- 40.Koyano-Nakagawa N, et al. Etv2 Is Expressed in the Yolk Sac Hematopoietic and Endothelial Progenitors and Regulates Lmo2 Gene Expression. STEM CELLS. 2012;30:1611–1623. doi: 10.1002/stem.1131. [DOI] [PMC free article] [PubMed] [Google Scholar]
- 41.Liu F, et al. Induction of hematopoietic and endothelial cell program orchestrated by ETS transcription factor ER71/ETV2. EMBO Rep. 2015;16:654–669. doi: 10.15252/embr.201439939. [DOI] [PMC free article] [PubMed] [Google Scholar]
- 42.Wang L, et al. Fev regulates hematopoietic stem cell development via ERK signaling. Blood. 2013;122:367–375. doi: 10.1182/blood-2012-10-462655. [DOI] [PubMed] [Google Scholar]
- 43.Pham VN, et al. Combinatorial function of ETS transcription factors in the developing vasculature. Dev Biol. 2007;303:772–783. doi: 10.1016/j.ydbio.2006.10.030. [DOI] [PMC free article] [PubMed] [Google Scholar]
- 44.Landry JR, et al. Expression of the leukemia oncogene Lmo2 is controlled by an array of tissue-specific elements dispersed over 100 kb and bound by Tal1/Lmo2, Ets, and Gata factors. Blood. 2009;113:5783–5792. doi: 10.1182/blood-2008-11-187757. [DOI] [PubMed] [Google Scholar]
- 45.Göttgens B. Establishing the transcriptional programme for blood: the SCL stem cell enhancer is regulated by a multiprotein complex containing Ets and GATA factors. EMBO J. 2002;21:3039–3050. doi: 10.1093/emboj/cdf286. [DOI] [PMC free article] [PubMed] [Google Scholar]
- 46.Göttgens B, et al. The scl +18/19 Stem Cell Enhancer Is Not Required for Hematopoiesis: Identification of a 5' Bifunctional Hematopoietic-Endothelial Enhancer Bound by Fli-1 and Elf-1. Mol Cell Biol. 2004;24:1870–1883. doi: 10.1128/MCB.24.5.1870-1883.2004. [DOI] [PMC free article] [PubMed] [Google Scholar]
- 47.Fang R, et al. Fast and Accurate Clustering of Single Cell Epigenomes Reveals Cis-Regulatory Elements in Rare Cell Types. bioRxiv. 2019 doi: 10.1101/615179. 615179. [DOI] [Google Scholar]
- 48.Corces MR, et al. An improved ATAC-seq protocol reduces background and enables interrogation of frozen tissues. Nat Methods. 2017;14:959–962. doi: 10.1038/nmeth.4396. [DOI] [PMC free article] [PubMed] [Google Scholar]
- 49.Langmead B, Salzberg SL. Fast gapped-read alignment with Bowtie 2. Nat Methods. 2012;9:357–359. doi: 10.1038/nmeth.1923. [DOI] [PMC free article] [PubMed] [Google Scholar]
- 50.Zhang Y, et al. Model-based Analysis of ChIP-Seq (MACS) Genome Biol. 2008;9:R137. doi: 10.1186/gb-2008-9-9-r137. [DOI] [PMC free article] [PubMed] [Google Scholar]
- 51.The ENCODE Project Consortium. An integrated encyclopedia of DNA elements in the human genome. Nature. 2012;489:57–74. doi: 10.1038/nature11247. [DOI] [PMC free article] [PubMed] [Google Scholar]
- 52.Wolock SL, Lopez R, Klein AM. Scrublet: computational identification of cell doublets in single-cell transcriptomic data. bioRxiv. 2018 doi: 10.1016/j.cels.2018.11.005. 357368. [DOI] [PMC free article] [PubMed] [Google Scholar]
- 53.Heinz S, et al. Simple Combinations of Lineage-Determining Transcription Factors Prime cis-Regulatory Elements Required for Macrophage and B Cell Identities. Mol Cell. 2010;38:576–589. doi: 10.1016/j.molcel.2010.05.004. [DOI] [PMC free article] [PubMed] [Google Scholar]
- 54.Kimmel CB, Ballard WW, Kimmel SR, Ullmann B, Schilling TF. Stages of embryonic development of the zebrafish. Dev Dyn. 1995;203:253–310. doi: 10.1002/aja.1002030302. [DOI] [PubMed] [Google Scholar]
- 55.Sumanas S, Lin S. Ets1-Related Protein Is a Key Regulator of Vasculogenesis in Zebrafish. PLOS Biol. 2006;4:e10. doi: 10.1371/journal.pbio.0040010. [DOI] [PMC free article] [PubMed] [Google Scholar]
- 56.Xue Y, et al. A 3D Atlas of Hematopoietic Stem and Progenitor Cell Expansion by Multi-dimensional RNA-Seq Analysis. Cell Rep. 2019;27:1567–1578.e5. doi: 10.1016/j.celrep.2019.04.030. [DOI] [PubMed] [Google Scholar]
Associated Data
This section collects any data citations, data availability statements, or supplementary materials included in this article.


