Abstract
PURPOSE
Published series of growth rates of renal tumors on active surveillance largely consist of tumors without pathologic or genetic data. Growth kinetics of genetically defined renal tumors are not well known. Here, we evaluate the growth of genetically defined renal tumors and their association with patient clinical and genetic characteristics.
PATIENTS AND METHODS
We evaluated patients with an inherited kidney cancer susceptibility syndrome as a result of a pathologic germline alteration of VHL, MET, FLCN, or BAP1 with at least 1 solid renal mass managed with active surveillance at our institution. Tumor growth rates (GR) were calculated and patients were stratified by genetic alteration and other clinical and genetic factors to analyze differences in growth rates using linear regression and comparative statistics.
RESULTS
A total of 292 patients with 435 genetically defined tumors were identified, including 286 VHL-deficient, 91 FLCN-deficient, 52 MET-activated, and 6 BAP1-deficient tumors. There were significant differences in GRs when stratified by genetic alteration. BAP1-deficient tumors had the fastest median GR (0.6 cm/y; interquartile range [IQR], 0.57-0.68 cm/y), followed by VHL-deficient tumors (GR, 0.37 cm/y; IQR, 0.25-0.57 cm/y), FLCN-deficient tumors (GR, 0.10 cm/y; IQR, 0.04-0.24 cm/y), and tumors with MET activation (GR, 0.15 cm/y; IQR, 0.053-0.32 cm/y; P < .001). Tumors from the same patient had similar GRs. Younger age was independently associated with higher GR (P = .005).
CONCLUSION
In a cohort of genetically defined tumors, tumor growth rates varied in a clinically and statistically different manner according to genetic subtype. Rapid growth of BAP1-deficient tumors indicates that these patients should be managed with caution. The faster growth of tumors in younger patients may support more frequent imaging, whereas the slower growth of other tumors may support extended surveillance beyond annual imaging in some instances.
INTRODUCTION
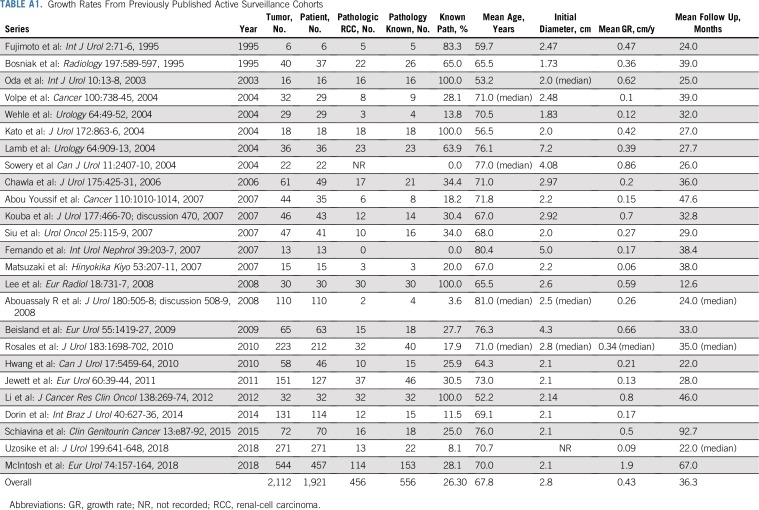
Active surveillance (AS) is an increasingly used management strategy for patients with small renal masses.1,2 Potential triggers for intervention for patients on AS include both absolute tumor size and tumor growth kinetics, with a tumor growth rate (GR) of 0.5 cm per year or more designated as a threshold for intervention.2 However, these parameters are applied broadly to renal tumors without regard for histology or genetic basis. Yet the cancers that arise in the kidney actually represent multiple diseases with different histologic subtypes, driven by different genetic alterations, and ultimately have different clinical courses that could benefit from more precise and specific treatments.3 Currently, information on tumor GRs is derived from multiple series in which the majority of tumors are neither biopsied, surgically resected, nor genetically profiled, making it unclear if different histologies or different genetic alterations are associated with different growth kinetics (Appendix Table A1, online only).
At our institution, patients with hereditary kidney cancer are managed on the basis of their germline alteration. For example, patients with VHL-deficient, MET-activated, or FLCN-deficient tumors are managed with AS until the largest tumor reaches 3 cm, at which time tumors are resected on the basis of the observation of limited metastatic potential at this threshold.4-7 Conversely, for patients with FH- or SDH-deficient tumors, AS is not recommended as even small tumors have the potential to spread.8-10 For more recently described genetic alterations, such as BAP1-deficient tumors, the role of AS is currently unclear.11 In contrast to most AS series, the majority of our patients on AS ultimately go on to have surgery, which enables us to correlate tumor growth kinetics with genetic subtypes and clinicopathologic features. The purpose of the current study was to determine whether renal tumor growth during AS is influenced by genetic subtype of the tumor and if clinical or other factors influence tumor growth.
PATIENTS AND METHODS
Patient Cohort and Clinical Stratification
Patients with germline pathogenic variations in the VHL (patients with von Hippel-Lindau disease), MET (patients with hereditary papillary renal-cell carcinoma), FLCN (patients with Birt-Hogg-Dubé syndrome), and BAP1 (patients with BAP1-tumor predisposition syndrome) genes with solid renal tumors managed with AS in a prospective fashion at the Urologic Oncology Branch of the National Cancer Institute were identified. All patients provided written, informed consent and were prospectively enrolled in a screening, treatment, and genetic analysis clinical protocol approved by the National Cancer Institute Institutional Review Board. Germline pathogenic variation analysis was performed using Clinical Laboratory Improvement Amendments–approved assays. Abdominal imaging was performed and we recorded maximum tumor diameter in any dimension for up to 5 solid index lesions. Cysts and mixed cystic–solid lesions were not included in the analysis. Demographic information, including sex, age at baseline tumor measurement, and baseline tumor size, was recorded. Patient follow-up interval, which varied from 6 months to 36 months, was individualized on the basis of current tumor size and previous GR of the largest solid tumors at each visit. Once the largest tumor reached the 3-cm threshold, partial nephrectomy for all lesions in the ipsilateral kidney was performed as previously described.12,13
GRs
Tumor GRs were calculated as the regression coefficient of a mixed-model linear regression of tumor size, measured as the largest single-dimension diameter in centimeters over follow-up time in years.
Genomic Stratification
Patients were stratified on the basis of their primary germline pathogenic variation into VHL, FLCN, MET, and BAP1 cohorts. Each genetic subtype was then further stratified according to the criteria below. For patients with tumors carrying VHL alterations, mutations were divided into the following five categories: missense mutations and in-frame insertion/deletions, partial deletions (one or two exons), nonsense and frameshift mutations, complete deletions (all three exons), and splice-site alterations. VHL missense mutations were further classified by gene location, including exon, corresponding protein domain (α, amino acid [AA] 155-193; β, AA 63-155 and AA 193-204), or protein functional region (nuclear export, AA 114-155; elongin C binding, AA 155-166).14 Partial and full gene deletions were further characterized by retention or deletion of the neighboring gene BRK1 (formerly designated as HSPC300), as previous work has demonstrated that loss of both VHL and BRK1 resulted in a lower prevalence of clear-cell renal carcinoma compared with other patients with only VHL loss.15,16
All mutations in patients with a germline MET alteration were missense. Patients were stratified on the basis of whether their mutation was classified as predisposing to early-onset disease (V1238I).17 Tumors carrying FLCN alterations were stratified according to four mutation type categories. Mutations were categorized into missense and in-frame insertion/deletions, partial deletions, nonsense and frameshift mutations, and splice-site alterations. Because the number of BAP1-deficient tumors was small, no substratification was performed.
Statistical Analysis
We assessed the association of tumor GRs with clinical and genetic features by comparing subgroups with Wilcoxon-rank sum or Kruskal-Wallis tests. Univariable and multivariable linear regression was performed to quantify the impact of clinical and genetic variables on tumor GRs. Statistical analysis was performed with Stata 15 (StataCorp, College Station, TX) and GraphPad Prism 7.00 (GraphPad Software, La Jolla, CA). Two-sided P values < .05 were considered significant.
RESULTS
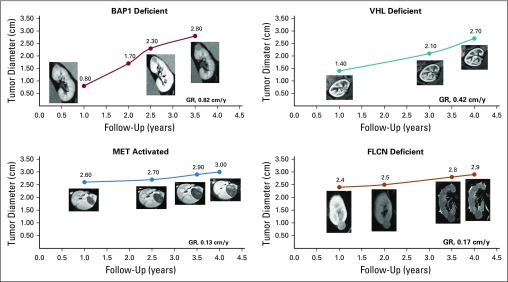
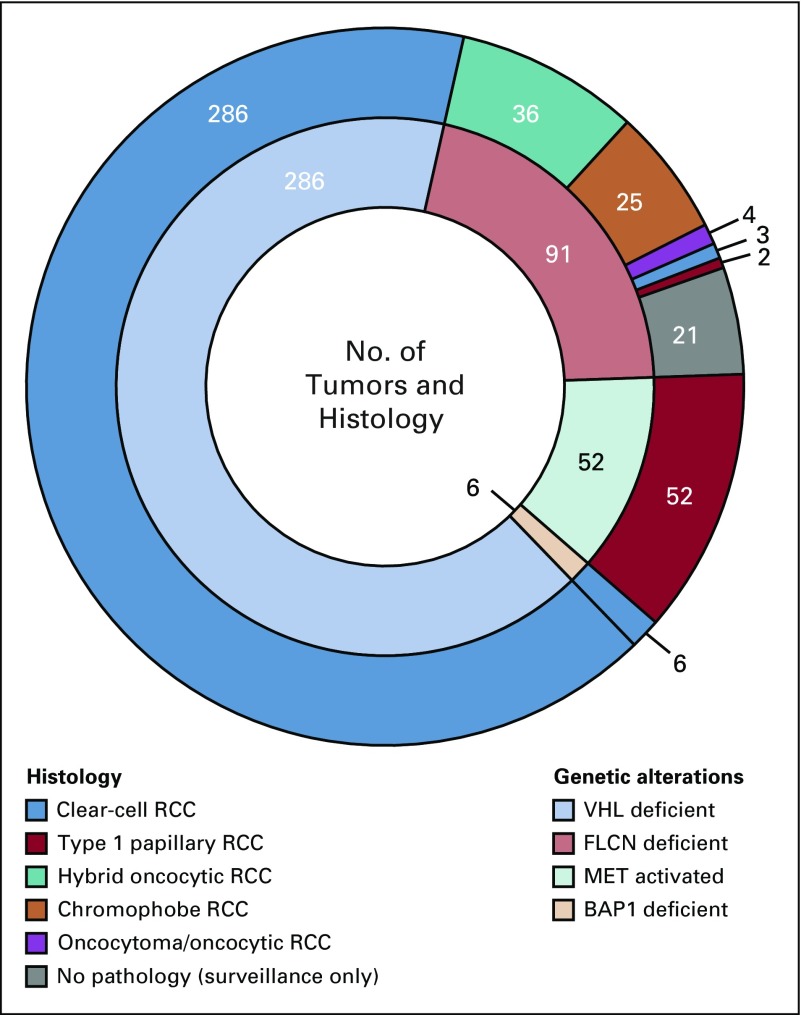
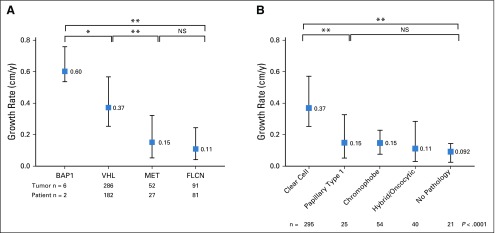
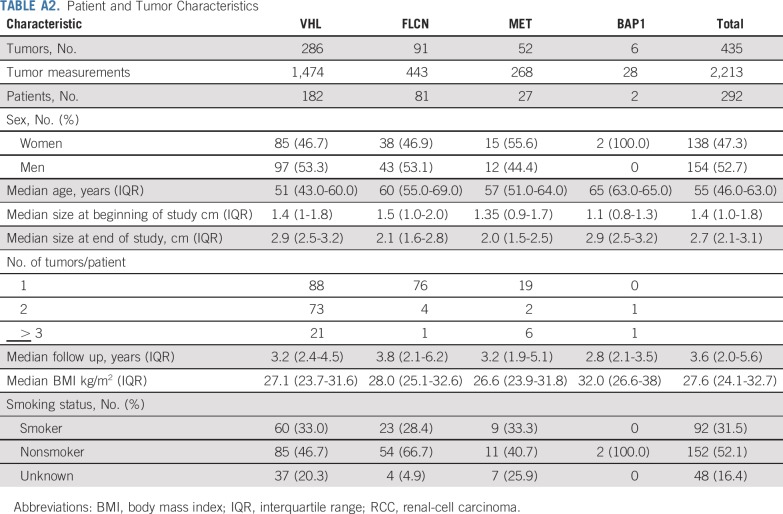
A total of 435 tumors in 292 patients with 2,213 tumor measurements were included for analysis. Of those, 286 were VHL deficient, 91 FLCN deficient, 52 MET activated, and 6 BAP1 deficient. Appendix Table A2 (online only) provides the demographic of the patients in the study. Median follow up was 3.6 years (interquartile range [IQR], 2.0-5.6 years). Tumors had a median starting and ending diameter of 1.4 cm and 2.7 cm, respectively. Median imaging interval was 0.81 years (IQR, 0.73-1.14 years). Figure 1 illustrates representative cross-sectional imaging of genetically defined tumors. Histologically, all VHL- and BAP1-deficient tumors were clear-cell renal-cell carcinoma (RCC) and all MET-activated tumors were type 1 papillary, whereas FLCN-deficient tumors had multiple histologies, including hybrid oncocytic, chromophobe, clear-cell RCC, and papillary type 1 RCC, as seen in Figure 2. Median tumor GR for the entire cohort was 0.31 cm per year. When stratified by genetic alterations, there was a significant difference across the four genetic subtypes (Fig 3A). BAP1-deficient tumors had the fastest median GR (0.6 cm/y; IQR, 0.57-0.68 cm/y), followed by VHL-deficient tumors (GR, 0.37 cm/y; IQR, 0.25-0.57 cm/y), MET-activation tumors (GR, 0.15 cm/y; IQR, 0.053-0.32 cm/y), and FLCN-deficient tumors (GR, 0.11 cm/y; IQR, 0.04-0.24 cm/y; P < .001 across all groups). When stratifying all tumors by histologic subtype, clear-cell RCC exhibited significant GR (0.37 cm/y), followed by papillary type 1 (0.15 cm/y), chromophobe (0.15 cm/y), and hybrid oncocytic tumors (0.11 cm/y; P < .0001 across all groups; Fig 3B).
FIG 1.
Representative patient examples of tumor growth rates (GRs) during active surveillance.
FIG 2.
Layered pie chart of histology and genetic alteration. The outer layer represents histology and the inner layer represents genetic alterations. RCC, renal-cell carcinoma.
FIG 3.
(A) Growth rates of genetically defined tumors stratified by gene. (B) Growth rates of renal tumors by histologic subtype. (*) P < .05. (**) P < .0001. NS, not significant.
Clinical Features
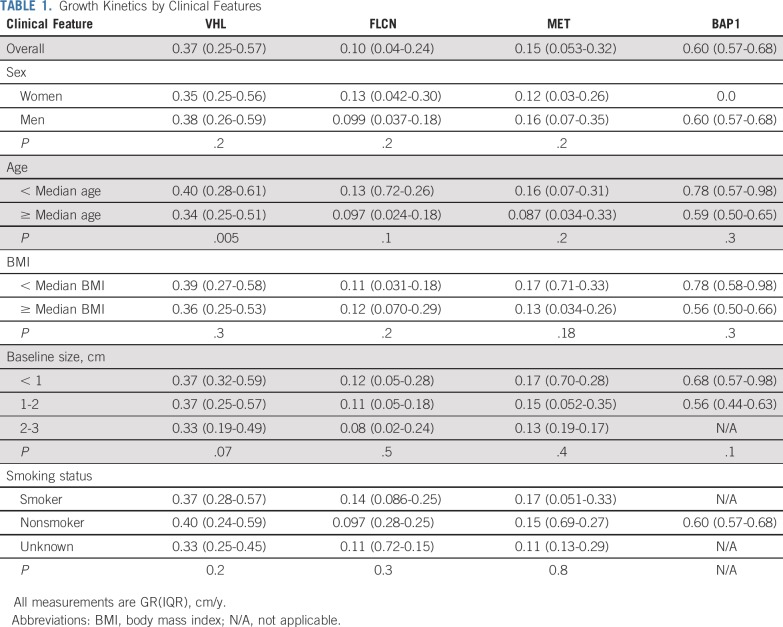
For all subsequent analyses, patients remained stratified by their primary genetic alteration. Table 1 lists the association of clinical factors with tumor GRs. There was no difference in GRs when stratified by sex, body mass index (BMI), or smoking status. To determine whether growth kinetics change as a function of starting tumor size, tumors were divided into three size groups on the basis of the tumor diameter at baseline: < 1 cm, 1-2 cm, and 2-3 cm. There was no difference in GRs by size group that indicated zero-order growth kinetics for this size range of tumors.
TABLE 1.
Growth Kinetics by Clinical Features
Among patients who had more than 1 index lesion, different tumors generally had similar GRs. Median standard deviation of the linear GR among all tumors from the same patient was 0.14 cm per year (IQR, 0.08-0.22 cm/y). The majority of patients with multiple tumors were a part of the VHL-deficient cohort.
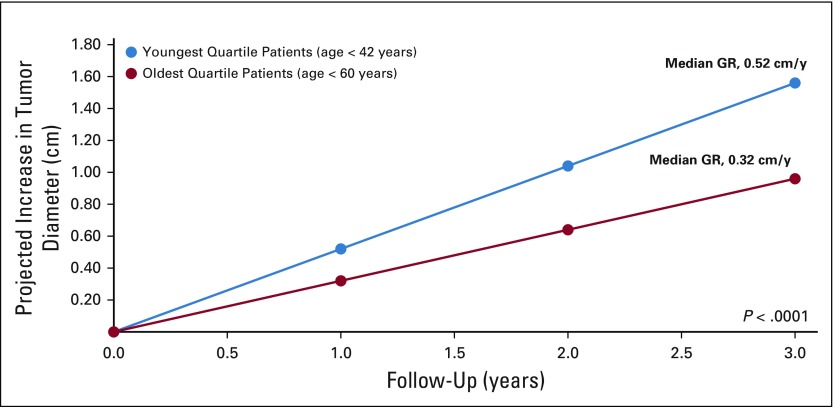
To evaluate the effect of age, patients were stratified by their age at the beginning of AS and dichotomized by those younger than the median age and older than the median age for each genetic subtype. For patients with VHL-deficient tumors, younger patients had faster-growing tumors (0.40 cm/y v 0.34 cm/y; P = .005; Table 1). The difference in growth was more apparent when patients were stratified into age quartiles. Patients in the youngest quartiles (age < 42 years) had a median GR of 0.52 cm per year (IQR, 0.34-0.75 cm/y) versus the oldest cohort (age > 60 years) with a median GR of 0.32 cm per year (IQR, 0.22-0.49 cm/y; P < .0001; Fig 4). For patients with FLCN-deficient, MET-activated, and BAP1-deficient tumors, there was a trend that favored faster growth in younger versus older patients, although these comparisons did not meet statistical significance (data not shown).
FIG 4.
VHL-deficient tumor growth by age. GR, growth rate.
To integrate potential genetic and environmental factors that may influence GRs, we performed univariable linear regression that included genetic alteration, sex, BMI, age, and smoking status (Appendix Table A3, online only). VHL-deficient and BAP1-deficient tumors had significantly faster GRs compared with the reference category of FLCN-deficient tumors. Age was negatively associated with growth, with each year increase in age associated with 0.0055-cm per year less growth. Sex, BMI, and smoking status were not associated with GRs. In a multivariable model that included genes and age, both remained independent predictors of GRs.
Genetic and Histologic Features
Association of GRs with genetic and histologic features is detailed in Table 2. For VHL-deficient tumors, there was no difference in GRs among the different types of VHL mutations. GRs of tumors with VHL missense mutations were independent of mutation location, whether stratified by exon, protein domain, or functional domain. For patients with a VHL deletion (partial or complete), no differences in GR were observed among tumors with retention or deletion of the adjacent gene BRK1.
TABLE 2.
Growth Rates of Tumors Stratified by Genetic Features and Histologies
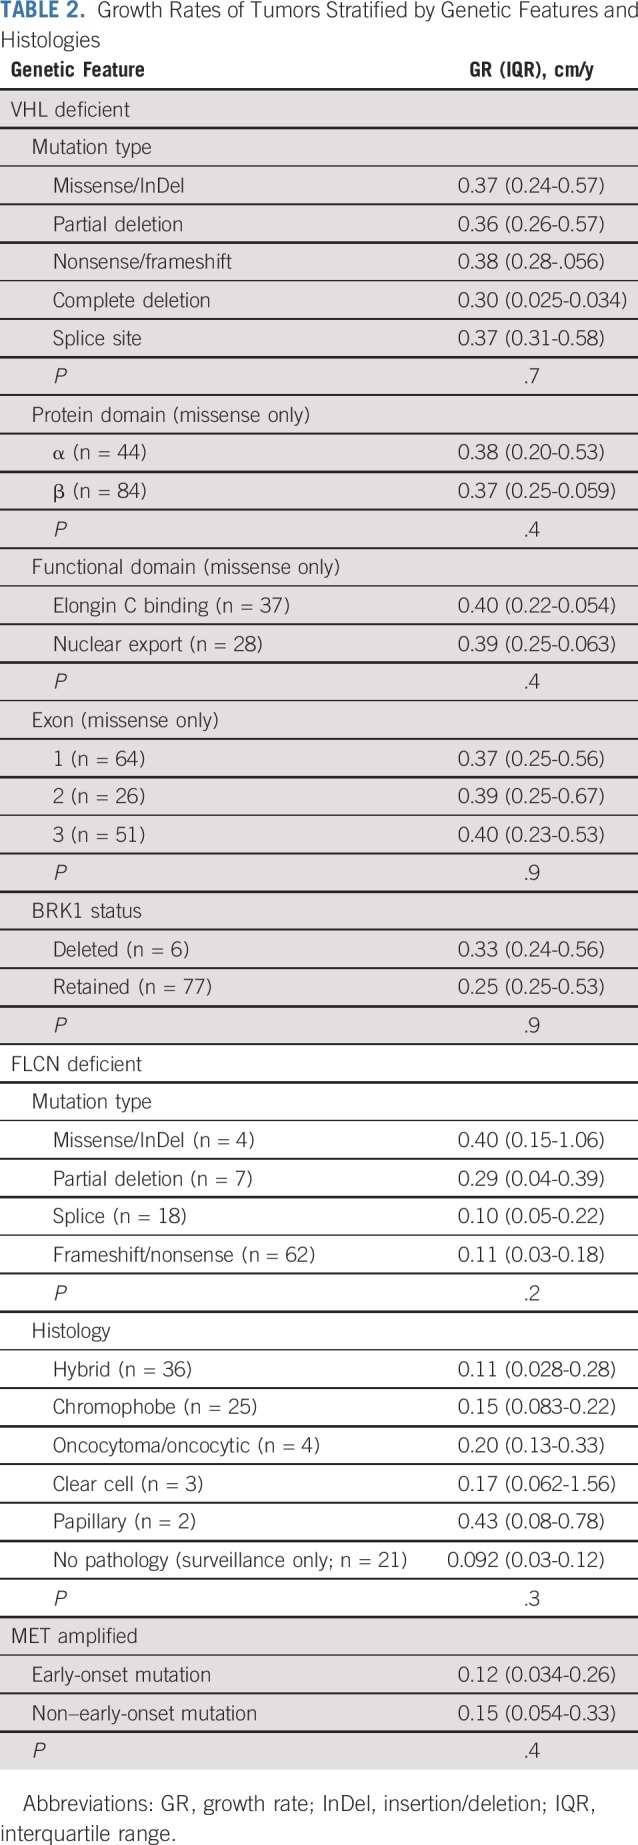
For patients with FLCN germline mutation, there was no difference in GRs on the basis of mutation type or histologic subtype. For patients with MET-activating mutations, there was no difference in tumor GRs in patients with early-onset and later-onset mutations.
DISCUSSION
In AS cohorts of patients with sporadic RCCs, tumor GRs are often used as a criterion for progression and a trigger for intervention2,18; however, these cohorts often lack even histologic data, as the majority of masses observed on AS never have a tissue diagnosis. In fact, in reviewing the series of AS from which GRs are calculated, histologically proven RCCs account for less than 30% of tumors in all series (Appendix Table A1). Of previous studies, only the AS cohort from Fox Chase reports GR in more than 100 pathologically proven RCC cases.19 In this study, we present one of the largest studies to date, to our knowledge, of renal tumor GRs in patients on AS and offer both histologic and genetic correlates. We found that there were significant differences in GRs stratified by genetic alteration, but within each gene the type of mutation did not affect GRs. Of note, BAP1-deficient tumors exhibited rapid GRs that exceeded 0.5 cm per year, which typically is used as a trigger for intervention. In addition, younger age was associated with faster GRs independent of genetic alterations. These findings have implications for guiding the development of AS schedules.
Whereas the current study evaluated patients with germline variants, these findings also have broader implications for patients with sporadic RCC. Alterations of VHL are present in more than 90% of patients with clear-cell RCC,20,21 and alteration of VHL is known to be an early, truncal event in sporadic RCC tumorigenesis.22 In addition, somatic BAP1 mutations were found in more than 10% of the Cancer Genome Atlas sporadic clear-cell RCC cohort.21 Similarly, 17% of type 1 papillary RCCs in the Cancer Genome Atlas data set had activating MET mutations, and 81% had altered MET status—defined as mutation, splice variant, or gene fusion—or gain of chromosome 7.23 Taken together, these data suggest that understanding the biology of hereditary kidney cancer informs our understanding of both the biology and clinical management of sporadic kidney cancer.
The observation that older patients have slower growing tumors than younger patients has been noted previously24; however, it is unclear if this observation is a result of genetics, environmental effect, or selection bias. Other studies have demonstrated that younger men have been found to have increased cancer-specific mortality compared with older men, suggesting that there may be a hormonal effect.25 Currently, AS is most often used in elderly or infirm patients, but there is increasing interest in expanding use to younger patients.26 Whereas this observation will require additional investigation, it may suggest that if AS is used in a younger patient, a closer follow-up schedule may be considered.
Discovery of BAP1-deficient tumors is relatively recent,11,27-29 and the safety of AS in these patients is unknown. We found that BAP1-deficient tumors are associated with rapid GRs. Previous work has demonstrated that somatic BAP1 alterations are associated with high-grade, high-stage, low-survival disease.21 While the sample of BAP1 tumors in the current study was limited, taken together, these data suggest that BAP1-deficient renal tumors on AS may warrant increased caution.
These data may also affect the frequency of surveillance schedules. In two large prospective AS studies, surveillance imaging was performed every 3-6 months initially, followed by annual examination.2,18 Our data suggest that in patients with VHL-deficient, MET-activated, or FLCN-deficient tumors, patients with smaller tumors may be surveyed less frequently than annually, depending on the size and location of tumors. Our institutional practice is to extend surveillance beyond 12 months in selected patients whose tumors are projected to be less than 3 cm during that interval.
GRs for RCC have been reported in several previously published AS series with reported rates from 0.06 to 0.86 cm per year (Appendix Table A1). The wide variation of GRs may be a reflection of a mixture of different RCC histologies and different genetic subtypes included within these cohorts. The three largest studies of AS reported GRs of 0.09 cm per year, 0.13 cm per year, 0.15 cm per year, and 0.19 cm per year,2,18,19 which are significantly lower than our data report. However, these studies enrolled mostly older patients with a variety of benign lesions and multiple different RCC histologies. Mehrazin et al30 reported a higher mean GR of 0.44 cm per year for larger T1b and T2 renal masses. Others studies with restricted pathologically proven RCC generally have higher GRs during AS, such as that by Kato et al,31 that demonstrated a median GR of 0.42 cm per year.
Whereas no prior studies have compared different types of genetically defined tumors, two previous studies have evaluated VHL-deficient tumors. Zhang et al32 analyzed 42 VHL-deficient tumors in 16 patients and reported a mean GR of 0.53 cm per year. Jilg and colleagues33 reported 96 tumors in 64 patients and reported a GR of 0.44 cm per year. In the latter study, the authors also evaluated germline mutation types and observed a similar lack of correlation between mutation type and growth kinetics.
Limitations of our study include the retrospective nature of our growth measurements. In addition, while all scans were read by board-certified radiologists, central radiology review was not performed. Furthermore, imaging intervals were not standardized. Strengths include the large number of tumors evaluated with corresponding pathologic and genetic data, which to our knowledge is the one of the largest reported in the literature for any renal AS cohort.
In conclusion, renal tumors have distinct growth patterns that reflect their genetic subtype. In addition, younger patients have faster growing tumors than older patients. Additional study is needed to determine the impact of somatic mutations on tumor development and growth kinetics and the role of somatic gene mutation analysis in the AS management of patients with sporadic RCC.
APPENDIX
TABLE A1.
Growth Rates From Previously Published Active Surveillance Cohorts
TABLE A2.
Patient and Tumor Characteristics
TABLE A3.
Univariable and Multivariable Linear Regression Predictors of Tumor Growth Rates
PRIOR PRESENTATION
Presented in part at the 2019 American Urological Association Annual Meeting, Chicago, IL, May 3-6, 2019.
SUPPORT
Supported by the Intramural Research Program of the National Institutes of Health (NIH), National Cancer Institute, Center for Cancer Research. Funded in part with federal funds from the Frederick National Laboratory for Cancer Research, NIH, under contract HHSN261200800001E. This research was made possible through the NIH Medical Research Scholars Program, a public-private partnership supported jointly by the NIH and contributions to the Foundation for the NIH from the Doris Duke Charitable Foundation (Grant No. 2014194), the American Association for Dental Research, the Colgate-Palmolive Company, Genentech, Elsevier, and other private donors.
AUTHOR CONTRIBUTIONS
Conception and design: Mark W. Ball, Laura S. Schmidt, Maria J. Merino, Ramaprasad Srinivasan, Ashkan A. Malayeri, Adam R. Metwalli, W. Marston Linehan
Financial support: W. Marston Linehan
Administrative support: Adam R. Metwalli, W. Marston Linehan
Provision of study materials or patients: Mark W. Ball, Adam R. Metwalli, W. Marston Linehan
Collection and assembly of data: Mark W. Ball, Julie Y. An, Patrick T. Gomella, Rabindra Gautam, Christopher J. Ricketts, Laura S. Schmidt, W. Marston Linehan
Data analysis and interpretation: Mark W. Ball, Christopher J. Ricketts, Cathy D. Vocke, Maria J. Merino, Ramaprasad Srinivasan, Adam R. Metwalli, W. Marston Linehan
Manuscript writing: All authors
Final approval of manuscript: All authors
Accountable for all aspects of the work: All authors
AUTHORS' DISCLOSURES OF POTENTIAL CONFLICTS OF INTEREST
Growth Rates of Genetically Defined Renal Tumors: Implications for Active Surveillance and Intervention
The following represents disclosure information provided by authors of this manuscript. All relationships are considered compensated unless otherwise noted. Relationships are self-held unless noted. I = Immediate Family Member, Inst = My Institution. Relationships may not relate to the subject matter of this manuscript. For more information about ASCO's conflict of interest policy, please refer to www.asco.org/rwc or ascopubs.org/journal/jco/site/ifc.
Open Payments is a public database containing information reported by companies about payments made to US-licensed physicians (Open Payments).
Ramaprasad Srinivasan
Research Funding: Calithera Biosciences (Inst), Peloton Therapeutics (Inst), Sanofi (Inst), AstraZeneca (Inst)
Ashkan A. Malayeri
Consulting or Advisory Role: AstroZeneca (I), Reflexion Medical (I), Radimmune (I)
No other potential conflicts of interest were reported.
REFERENCES
- 1.Campbell S, Uzzo RG, Allaf ME, et al. Renal mass and localized renal cancer: AUA guideline. J Urol. 2017;198:520–529. doi: 10.1016/j.juro.2017.04.100. [DOI] [PubMed] [Google Scholar]
- 2.Pierorazio PM, Johnson MH, Ball MW, et al. Five-year analysis of a multi-institutional prospective clinical trial of delayed intervention and surveillance for small renal masses: The DISSRM registry. Eur Urol. 2015;68:408–415. doi: 10.1016/j.eururo.2015.02.001. [DOI] [PubMed] [Google Scholar]
- 3.Linehan WM. Genetic basis of kidney cancer: Role of genomics for the development of disease-based therapeutics. Genome Res. 2012;22:2089–2100. doi: 10.1101/gr.131110.111. [DOI] [PMC free article] [PubMed] [Google Scholar]
- 4.Pavlovich CP, Grubb RL, III, Hurley K, et al. Evaluation and management of renal tumors in the Birt-Hogg-Dubé syndrome. J Urol. 2005;173:1482–1486. doi: 10.1097/01.ju.0000154629.45832.30. [DOI] [PubMed] [Google Scholar]
- 5.Herring JC, Enquist EG, Chernoff A, et al. Parenchymal sparing surgery in patients with hereditary renal cell carcinoma: 10-year experience. J Urol. 2001;165:777–781. [PubMed] [Google Scholar]
- 6.Ball MW, Shuch BM. Inherited kidney cancer syndromes. Curr Opin Urol. 2019;29:334–343. doi: 10.1097/MOU.0000000000000646. [DOI] [PubMed] [Google Scholar]
- 7.Walther MM, Choyke PL, Glenn G, et al. Renal cancer in families with hereditary renal cancer: Prospective analysis of a tumor size threshold for renal parenchymal sparing surgery. J Urol. 1999;161:1475–1479. doi: 10.1016/s0022-5347(05)68930-6. [DOI] [PubMed] [Google Scholar]
- 8.Merino MJ, Torres-Cabala C, Pinto P, et al. The morphologic spectrum of kidney tumors in hereditary leiomyomatosis and renal cell carcinoma (HLRCC) syndrome. Am J Surg Pathol. 2007;31:1578–1585. doi: 10.1097/PAS.0b013e31804375b8. [DOI] [PubMed] [Google Scholar]
- 9.Grubb RL, III, Franks ME, Toro J, et al. Hereditary leiomyomatosis and renal cell cancer: A syndrome associated with an aggressive form of inherited renal cancer. J Urol. 2007;177:2074–2079, discussion 2079-2080. doi: 10.1016/j.juro.2007.01.155. [DOI] [PubMed] [Google Scholar]
- 10.Ricketts CJ, Shuch B, Vocke CD, et al. Succinate dehydrogenase kidney cancer: An aggressive example of the Warburg effect in cancer. J Urol. 2012;188:2063–2071. doi: 10.1016/j.juro.2012.08.030. [DOI] [PMC free article] [PubMed] [Google Scholar]
- 11.Farley MN, Schmidt LS, Mester JL, et al. A novel germline mutation in BAP1 predisposes to familial clear-cell renal cell carcinoma. Mol Cancer Res. 2013;11:1061–1071. doi: 10.1158/1541-7786.MCR-13-0111. [DOI] [PMC free article] [PubMed] [Google Scholar]
- 12.Hankins RA, Walton-Diaz A, Truong H, et al. Renal functional outcomes after robotic multiplex partial nephrectomy: The National Cancer Institute experience with robotic partial nephrectomy for 3 or more tumors in a single kidney. Int Urol Nephrol. 2016;48:1817–1821. doi: 10.1007/s11255-016-1392-y. [DOI] [PMC free article] [PubMed] [Google Scholar]
- 13.Metwalli AR, Linehan WM. Nephron-sparing surgery for multifocal and hereditary renal tumors. Curr Opin Urol. 2014;24:466–473. doi: 10.1097/MOU.0000000000000094. [DOI] [PMC free article] [PubMed] [Google Scholar]
- 14.Stebbins CE, Kaelin WG, Jr, Pavletich NP. Structure of the VHL-elonginC-elonginB complex: Implications for VHL tumor suppressor function. Science. 1999;284:455–461. doi: 10.1126/science.284.5413.455. [DOI] [PubMed] [Google Scholar]
- 15.Cascón A, Escobar B, Montero-Conde C, et al. Loss of the actin regulator HSPC300 results in clear cell renal cell carcinoma protection in von Hippel-Lindau patients. Hum Mutat. 2007;28:613–621. doi: 10.1002/humu.20496. [DOI] [PubMed] [Google Scholar]
- 16.Maranchie JK, Afonso A, Albert PS, et al. Solid renal tumor severity in von Hippel Lindau disease is related to germline deletion length and location. Hum Mutat. 2004;23:40–46. doi: 10.1002/humu.10302. [DOI] [PubMed] [Google Scholar]
- 17.Schmidt LS, Nickerson ML, Angeloni D, et al. Early onset hereditary papillary renal carcinoma: Germline missense mutations in the tyrosine kinase domain of the met proto-oncogene. J Urol. 2004;172:1256–1261. doi: 10.1097/01.ju.0000139583.63354.e0. [DOI] [PubMed] [Google Scholar]
- 18.Jewett MA, Mattar K, Basiuk J, et al. Active surveillance of small renal masses: Progression patterns of early stage kidney cancer. Eur Urol. 2011;60:39–44. doi: 10.1016/j.eururo.2011.03.030. [DOI] [PubMed] [Google Scholar]
- 19.McIntosh AG, Ristau BT, Ruth K, et al. Active surveillance for localized renal masses: Tumor growth, delayed intervention rates, and >5-yr clinical outcomes. Eur Urol. 2018;74:157–164. doi: 10.1016/j.eururo.2018.03.011. [DOI] [PubMed] [Google Scholar]
- 20.Gnarra JR, Tory K, Weng Y, et al. Mutations of the VHL tumour suppressor gene in renal carcinoma. Nat Genet. 1994;7:85–90. doi: 10.1038/ng0594-85. [DOI] [PubMed] [Google Scholar]
- 21.Cancer Genome Atlas Research Network Comprehensive molecular characterization of clear cell renal cell carcinoma. Nature. 2013;499:43–49. doi: 10.1038/nature12222. [DOI] [PMC free article] [PubMed] [Google Scholar]
- 22.Gerlinger M, Rowan AJ, Horswell S, et al. Intratumor heterogeneity and branched evolution revealed by multiregion sequencing. N Engl J Med. 2012;366:883–892. doi: 10.1056/NEJMoa1113205. [DOI] [PMC free article] [PubMed] [Google Scholar]
- 23.Cancer Genome Atlas Research Network. Linehan WM, Spellman PT, et al. Comprehensive molecular characterization of papillary renal-cell carcinoma. N Engl J Med. 2016;374:135–145. doi: 10.1056/NEJMoa1505917. [DOI] [PMC free article] [PubMed] [Google Scholar]
- 24.Zhang J, Kang SK, Wang L, et al. Distribution of renal tumor growth rates determined by using serial volumetric CT measurements. Radiology. 2009;250:137–144. doi: 10.1148/radiol.2501071712. [DOI] [PubMed] [Google Scholar]
- 25.Qu Y, Chen H, Gu W, et al. Age-dependent association between sex and renal cell carcinoma mortality: A population-based analysis. Sci Rep. 2015;5:9160. doi: 10.1038/srep09160. [DOI] [PMC free article] [PubMed] [Google Scholar]
- 26.Kutikov A. Surveillance of small renal masses in young patients: A viable option in the appropriate candidate. Eur Urol Focus. 2016;2:567–568. doi: 10.1016/j.euf.2016.12.007. [DOI] [PubMed] [Google Scholar]
- 27.Brugarolas J. PBRM1 and BAP1 as novel targets for renal cell carcinoma. Cancer J. 2013;19:324–332. doi: 10.1097/PPO.0b013e3182a102d1. [DOI] [PMC free article] [PubMed] [Google Scholar]
- 28.Carlo MI, Mukherjee S, Mandelker D, et al. Prevalence of germline mutations in cancer susceptibility genes in patients with advanced renal cell carcinoma. JAMA Oncol. 2018;4:1228–1235. doi: 10.1001/jamaoncol.2018.1986. [DOI] [PMC free article] [PubMed] [Google Scholar]
- 29.Peña-Llopis S, Vega-Rubín-de-Celis S, Liao A, et al. BAP1 loss defines a new class of renal cell carcinoma. Nat Genet. 2012;44:751–759. doi: 10.1038/ng.2323. [Erratum: Nat Genet 44:1072, 2012] [DOI] [PMC free article] [PubMed] [Google Scholar]
- 30.Mehrazin R, Smaldone MC, Kutikov A, et al. Growth kinetics and short-term outcomes of cT1b and cT2 renal masses under active surveillance. J Urol. 2014;192:659–664. doi: 10.1016/j.juro.2014.03.038. [DOI] [PMC free article] [PubMed] [Google Scholar]
- 31.Kato M, Suzuki T, Suzuki Y, et al. Natural history of small renal cell carcinoma: Evaluation of growth rate, histological grade, cell proliferation and apoptosis. J Urol. 2004;172:863–866. doi: 10.1097/01.ju.0000136315.80057.99. [DOI] [PubMed] [Google Scholar]
- 32.Zhang J, Pan JH, Dong BJ, et al. Active surveillance of renal masses in von Hippel-Lindau disease: Growth rates and clinical outcome over a median follow-up period of 56 months. Fam Cancer. 2012;11:209–214. doi: 10.1007/s10689-011-9503-5. [DOI] [PubMed] [Google Scholar]
- 33.Jilg CA, Neumann HP, Gläsker S, et al. Growth kinetics in von Hippel-Lindau-associated renal cell carcinoma. Urol Int. 2012;88:71–78. doi: 10.1159/000333348. [DOI] [PubMed] [Google Scholar]


