Abstract
Background
Mineral nutrient limitation affects the water flow through plants. We wanted to test on barley whether any change in root-to-shoot ratio in response to low supply of nitrogen and phosphate is accompanied by changes in root and cell hydraulic properties and involves changes in aquaporin (AQP) gene expression and root apoplastic barriers (suberin lamellae, Casparian bands).
Methods
Plants were grown hydroponically on complete nutrient solution or on solution containing only 3.3 % or 2.5 % of the control level of nutrient. Plants were analysed when they were 14–18 d old.
Results
Nutrient-limited plants adjusted water flow to an increased root-to-shoot surface area ratio through a reduction in root hydraulic conductivity (Lp) as determined through exudation analyses. Cortex cell Lp (cell pressure probe analyses) decreased in the immature but not the mature region of the main axis of seminal roots and in primary lateral roots. The aquaporin inhibitor HgCl2 reduced root Lp most in nutrient-sufficient control plants. Exchange of low-nutrient for control media caused a rapid (20–80 min) and partial recovery in Lp, though cortex cell Lp did not increase in any of the root regions analysed. The gene expression level (qPCR analyses) of five plasma membrane-localized AQP isoforms did not change in bulk root extracts, while the formation of apoplastic barriers increased considerably along the main axis of root and lateral roots in low-nutrient treatments.
Conclusions
Decrease in root and cortex cell Lp enables the adjustment of root water uptake to increased root-to-shoot area ratio in nutrient-limited plants. Aquaporins are the prime candidate to play a key role in this response. Modelling of water flow suggests that some of the reduction in root Lp is due to increased formation of apoplastic barriers.
Keywords: Aquaporin, barley (Hordeum vulgare L.), Casparian band, endodermis, root hydraulic conductivity, suberin
Introduction
The limited supply of macronutrients such as nitrogen and phosphate affects plant growth and yield on a global scale (Bieleski, 1973; Houlton et al., 2018). A typical response of plants to a limitation in mineral nutrient is an increase in the fresh weight or surface area ratio between root and shoot (for reviews see Clarkson et al., 2000; Hermans et al., 2006; Koevoets et al., 2016). This response makes it possible to allocate a larger portion of resources to that part of the plant (root system) that mines the soil for the limiting nutrient; it also increases the risk of losing plant-internal nutrients into a nutrient-poor root environment.
As the root surface area increases relative to the shoot surface area, water uptake must be matched with water loss. This can be achieved (1) at the root level through a reduction in root hydraulic conductivity (LP; the rate of water uptake per unit surface area and biophysical driving force; unit, m s−1 MPa−1) or the biophysical force, which drives water uptake; and (2) at the shoot level through an increase in stomatal conductance. Root apoplastic barriers may aid the reduction in root Lp, as does a downregulation in the activity of aquaporins (AQPs), membrane-intrinsic protein channels that facilitate the diffusion of water and small-molecular solutes, including Na+, across the membrane of cells (for reviews see Chaumont and Tyerman, 2014; Maurel et al., 2015; Gambetta et al., 2017; Tyerman et al., 2017). It is possible, therefore, that some of the plant responses to a growth-limiting supply of N and P are not so much linked to the actual nutritional aspect of these macronutrients but are more aimed at the regulation of water balance. At the same time, some of the responses aimed at the regulation of water balance, such as regulation of Lp through AQPs, will feed back on the formation of apoplastic barriers, as these may affect not only the radial, trans-root movement of nutrients but also the movement of water. The hydraulic and apoplastic barrier response cannot be viewed in isolation.
There is increasing information available on the molecular and hormonal control of the formation of apoplastic barriers in roots, yet information on the changes of these barriers in response to mineral nutrition is very limited (Barberon et al., 2016; for reviews see Enstone et al., 2003; Barberon, 2017), particularly in combination with hydraulic analyses (Coffey et al., 2018). The aim of the present study was to test whether barley plants that are exposed to a growth-limiting supply of nitrogen and phosphate adjust plant water flow mainly at the root level, and whether this adjustment involves a decrease in root and cortex cell Lp, a decrease that is accompanied by a decrease in the activity and gene expression level of AQPs. It was further tested whether any decrease in root Lp is paralleled by an increase in the formation of Casparian bands and suberin lamellae. We analysed two nutrients (N, P) because we wanted to identify any nutrient-specific responses.
MATERIALS AND METHODS
Plant material and growth conditions
Barley (Hordeum vulgare ‘Quench’) plants were grown on modified half-strength Hoagland solution (Knipfer and Fricke, 2011) in a growth room. The low-N solution contained 3.33 % of the nitrogen and the low-P solution contained 2.5 % of the phosphate present in the control solution; the concentrations of the other macronutrients were the same, or comparable, between the three nutritional treatments, Concentrations in mm in control/low-N/low-P solution (see also Supplementary Data File S1) were as follows: NH4H2PO4, 0.5/0.0166/0.0125; (NH4)2PO4, 0.5/0.0166/0.0125; KNO3, 2/0.2/2; MgSO4, 0.5/0.5/0.5; NaCl, 0.5/0.5/0.5; Ca(NO3)2, 2/0/2; KH2PO4, 0/0.5/0; K2HPO4, 0/0.5/0; KCl, 0/0.25/0; (NH4)2SO4, 0/0/0.75; CaCl2, 0/2/0. Micronutrients (Fricke and Peters, 2002) were at the same concentrations in the three nutritional treatments. The level of N in the low-N and level of P in the low-P solution were reduced considerably compared with the control level, but due to the (comparatively short) exposure time (7–11 d; see next paragraph), the relative growth rate of nutrient-limited plants was reduced little (Supplementary Data File S1) while the root-to-shoot ratio was affected significantly (Fig. 1). The nitrate-to-ammonium concentration ratio (4) was kept the same in the nutrient solutions to avoid possible effects of this ratio on root Lp and aquaporin expression (for review see Wang et al., 2016).
Fig. 1.
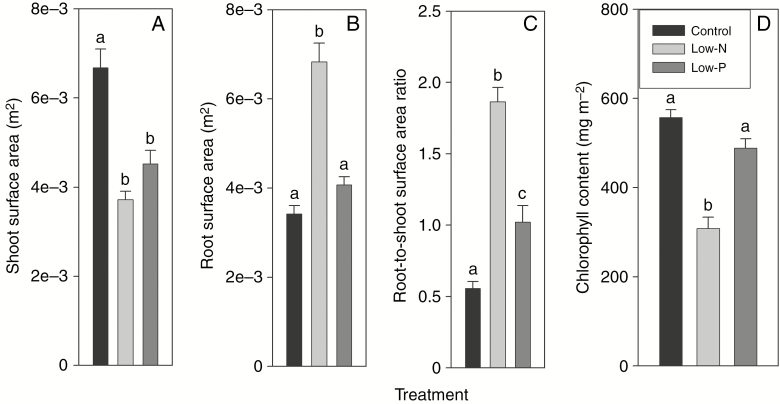
(A) Shoot and (B) root surface area, (C) root-to-shoot surface area ratio and (D) leaf chlorophyll content of 14- to 18-d-old barley plants grown on complete nutrient solution (control) or on nutrient solution containing only 3.33 % of the nitrogen (low-N) or 2.5 % of the phosphate (low-P) of the control solution. Results are mean and s.e. (error bars) of (A–C) (n) 21–23 and (D) 4–7 plant analyses. Statistically significant differences (P < 0.05) in values between treatments are indicated by different letters above the columns.
The root medium was aerated, and plants grew at a day/night length of 16/8 h and temperature of 23/20 °C. Relative humidity was 65–75 % and photosynthetically active radiation at plant level was 300–350 μmol m−2 s−1. All plants were germinated for 6 d on CaSO4 solution (0.5 mm) and then transferred to control or low-N and low-P solution. Plants were analysed when they were 14–18 d old. At that developmental stage, leaf 3 was expanding and leaf 4 had emerged. Leaf 2 was the youngest fully mature leaf, and the blade of leaf 2 accounted for much (>40 %) of the plant’s photosynthesizing leaf area. All analyses were carried out 4–8 h into the photoperiod, except for continuous transpiration analyses, which were carried out over one entire diurnal light/dark/light cycle.
Plants were derived from multiple independent batches, and control plants and plants exposed to low-N and low-P treatments were always grown and analysed in parallel.
Transpiration measurements
Day- and night-time transpirational water loss of plants in the growth room was determined gravimetrically using balances and computer software as described previously (Even et al., 2018). Transpirational water loss was expressed on a per-plant basis (m3 s−1) or related to leaf and root surface area (m3 m−2 s−1 or m s−1).
Surface area
The shoot and root system were scanned (Canon model 9900F) for determination of surface area. Scanned images were analysed with the freely available software ImageJ (https://imagej.nih.gov/ij/). To increase the contrast of root images, roots were stained in 0.25 % Coomassie Brilliant Blue for 2 d prior to scanning (Kano-Nakata et al., 2012). Roots were treated as cylinders during surface area calculations (Suku et al., 2014).
Hydraulic analyses
Hydraulic analyses were carried out in a normal laboratory environment, without (exudation of excised root systems) or with (cell pressure probe analyses on intact plants) supplementary lighting to maintain some plant transpiration. Ambient air temperature and the temperature of root media were between 18 and 23 °C.
Excised root systems were analysed through exudation experiments as described previously (Suku et al., 2014; Coffey et al., 2018) by attaching root systems through the base 1 cm of remaining shoot to silicon tubing that held a glass capillary, and following the increase in exudate liquid in the capillary with time. Roots were bathed during experiments in the identical nutrient medium in which the plants had grown before. The root medium was contained in large plastic trays. Routine analyses (determination of Lp without any additional treatments during exudation analyses) lasted typically 30–40 min for control, 40–60 min for low-P and 70–110 min for low-N plants. The low-N plants exuded at the lowest rate and required typically some time following the preparation of root systems before exudation became visible. Root Lp (m s−1 MPa−1) was calculated by relating the exudate flow rate (m3 s−1) to root surface area (m2) and the osmotic force driving water uptake (difference in osmotic pressure between exudate and root medium; unit, MPa).
The effect of the AQP inhibitor HgCl2 on root exudation was also tested. Root systems were first analysed while they were bathed in their nutrient medium, as during routine analyses (taken as the ‘before’ value). Root systems were then washed briefly in distilled water and suspended for 5 min in a 50 µm aqueous solution of HgCl2. Roots were then washed successively in two changes of distilled water, before being transferred back into their original nutrient medium and analysed again (the ‘Hg’ value). After a period of typically 30–60 min, the reducing agent dithiothreitol (DTT) was applied at a final concentration of 5 mm and plants continued to be analysed (the ‘Hg/DTT’ value). As the identical root systems were used for the before, Hg and Hg/DTT analyses, values could be compared pairwise, and the Hg and Hg/DTT values could also be expressed as percentage of the before value, which was set to 100 %.
The effect of the re-supply of limiting nutrient on root exudation was also tested, through media-exchange experiments. Plants in the low-P and low-N treatments were first analysed for exudation, as during routine analyses. Then one half of the root medium was removed with the aid of a plastic disposable syringe and replaced with the equivalent volume of freshly made control nutrient solution. Care was taken that the temperature of medium used was the same. This was achieved by placing the plastic tray that contained the root system and medium during exudation analyses on a heating block (21 °C) and doing the same for the control medium to be added. Root exudation was analysed for 40–70 min following the exchange of medium. Values that were obtained for root systems before and after medium exchange could be related directly to each other (paired t-test) as the identical root systems were used throughout the experiment.
Cell turgor, half-time of water exchange, elastic modulus and cell Lp were determined with the cell pressure probe as described previously (e.g. Knipfer et al., 2011; Coffey et al., 2018). Root cortex cells were analysed in all three treatments, including the control, in the root hair region, between 1.5 and 3.5 cm from the tip, and in the fully mature region, halfway along the main axis of seminal roots. Control and low-N plants were also analysed in primary lateral roots, which had formed about halfway along the main axis of seminal roots. The first one to three cortical cell layers beneath the root epidermis were probed. To obtain an approximation of cortex cell osmotic pressure, osmotic pressure was determined through osmometry (Vapro osmometer; Wescor, South Logan, UT, USA) of bulk tissue extracts of the root regions analysed along the main root axis. For the much smaller cortical cells in lateral roots, pooled sap from several cells was extracted with a microcapillary and analysed by picolitre osmometry (Fricke and Peters, 2002). The osmotic pressure at 1.5–3.5 cm from the tip and in the fully mature root region averaged 0.687 ± 0.079 and 0.869 ± 0.047 MPa, respectively, in control, 0.692 ± 0.038 and 0.813 ± 0.011 MPa, in low-N, and 0.772 ± 0.028 and 0.833 ± 0.021 MPa in low-P plants (mean ± s.e. of n = 4 plant analyses; differences between treatments were non-significant; not shown). Osmotic pressure of cortex cells in primary lateral roots averaged 0.603 ± 0.024 MPa in control and 0.722 ± 0.044 MPa in low-N plants [mean ± s.e. of seven combined cell saps; significant (P < 0.05) difference between treatments; low-P plants were not analysed]. The volume and surface area of cells was determined in free-hand longitudinal sections of the identical roots analysed with the cell pressure probe. The volume of cortex cells in the root region at 15–35 mm from the tip was similar between treatments, averaging 186 ± 17 pL in control, 167 ± 13 pL in low-N and 162 ± 17 pL in low-P plants (means ± s.e. of 14 or 15 cell analyses per treatment; not shown). As cells had acquired their final size in this root region, the same volumes and cell dimensions were used when calculating cell Lp for cells in the mature root region. The volume of cortex cells analysed in primary lateral roots averaged 52.1 ± 3.7 pL in control and 27.7 ± 2.1 pL in low-N plants [mean ± s.e. of 60–80 cell analyses; significant (P < 0.05) difference between treatments]. Data that were used for the calculation of cell Lp are summarized in Supplementary Data File S2.
Molecular analyses
Gene expression analyses (qPCR) were carried out exactly as detailed previously (Coffey et al., 2018), using a Stratagene rapid cycler and SYBR Green as reagent (Takara Bio, Otsu, Shiga 520-2193, Japan) on 96-well plates. Two sets of qPCR experiments were carried out. One set of experiments compared the gene expression level between plants grown under control conditions and plants grown under low-N conditions, and another set compared expression between control and low-P plants. Four or five biological replicates (plants), which were derived from different batches of plants, were analysed for each treatment in each set of qPCR experiments. The control and low-nutrient treatments were always grown and harvested in parallel.
The calculation of qPCR data was based on the ΔCt method (Pfaffl, 2001); details of calculations are provided in Meng et al. (2016). We used three housekeeping genes as references for expression, as in previous studies (Besse et al., 2011; Knipfer et al., 2011; Meng et al., 2016; Meng and Fricke, 2017). These housekeeping genes were ubiquitin (UBQ), glycerin-aldehyde-3P-dehydrogenase (GAPDH) and plasma membrane H+-ATPase (PM-H+-ATPase).
Five plasma membrane intrinsic protein (PIP) AQPs were analysed (HvPIP1;3, HvPIP2;1; HvPIP2;2, HvPIP2;4, HvPIP2;5). All PIP genes had previously shown significant expression in roots of barley, and have been proposed (HvPIP1;3, HvPIP2;2, HvPIP2;5) to play a role in the regulation of root water uptake (Besse et al., 2011; Knipfer et al., 2011; Coffey et al., 2018; Gitto and Fricke, 2018). Sequences of primers are given in Besse et al. (2011).
Root anatomical analyses
Root anatomy was studied on free-hand cross-sections, which were made from plant material stored in 50 % ethanol. Sections were made at three positions along the main axis of seminal roots, 9–11 mm from the tip, a quarter of total root length from the tip (root hair region, with lateral roots starting to develop) and halfway along the entire root axis (mature, lateral root region). A relative (to total root length) rather than absolute (e.g. mm from tip) location of the latter two positions was chosen to account for differences in total root length between the nutritional treatments. While roots of low-N plants were typically longest, averaging 28.6 ± 1.0 cm, roots of control plants were of intermediate length (20.8 ± 1.0 cm) and roots of low-P plants were shortest [14.8 ± 0.6 cm; mean and s.e. of n = 20–24 roots of four 17-d-old plants per treatment; differences between treatments were significant (P < 0.05); not shown]. Main roots were thinnest in low-N plants (diameter, 0.428 ± 0.008 mm), of intermediate thickness in control plants (0.470 ± 0.008 mm) and thickest in low-P plants [0.523 ± 0.015 mm; mean and s.e. of 15 root analyses each, with differences between treatments being significant (P < 0.05)]. Cross-sections were also prepared from primary lateral roots, which were typically 10–40 mm in length, being longest in low-N and shortest, but thickest, in low-P plants [control, 0.229 ± 0.006 mm; low-N, 0.230 ± 0.007 mm; low-P, 0.276 ± 0.008 mm; mean diameter ± s.e. of 50 root analyses each; low-P lateral roots were significantly thicker compared with control and low-N lateral roots (P < 0.05)]. The contribution of lateral roots to the total surface area of the root system ranged from 48.6 to 57.6 % across the three treatments (mean of eight plants analysed for each treatment; differences between treatments not significant, not shown).
Sections were observed with a Leica microscope (DM5500 B; Leica, Wetzlar, Germany), under UV illumination (Fluo filter D), and images were captured with a digital camera (PFC310 FX; Leica, Wetzlar, Germany). Casparian bands were visualized by staining sections with berberine hemisulphate (Brundrett et al., 1988), and suberin and lipid deposits were visualized by staining with Fluorol Yellow 088 (Brundrett et al., 1991). The autofluorescence signal of stelar tissue and occasionally also Fluorol Yellow signal was often very high, particularly at the quarter and halfway positions. This interfered with observing and comparing the fluorescence signal of Casparian bands and suberin lamellae, and the default γ setting of the software was increased slightly. When this was done, it was done for all treatments and all root positions, including 9–11 mm from the base, to the same extent, to ensure that the change in setting did not affect the comparison of fluorescence images between treatments and root positions. We always attempted to stain the identical roots and developmental regions of any given treatment for Casparian bands and suberin lamellae, to be able to relate the staining patterns to each other. We also attempted to analyse all three treatments, including the control, on the same day, particularly for Fluorol Yellow, where the stain solution has to be prepared fresh. This explains why some sections are shown where incomplete removal of stain through washing caused some yellow background fluorescence.
The abundance of Casparian bands in the main root axis was (semi-)quantified by counting the number of endodermal cells in a section where the radial walls had formed a clearly visible band rather than a dot (which is indicative of the very early stage of Casparian band formation) and expressing that number as a percentage of the total number of endodermal cells in that section, as this number equals the maximum possible number of Casparian bands. Suberin lamellae could not be quantified in the same way through a present/not present score, as the signal intensity increased with the developmental age of the root region. Therefore, we had to apply a more subjective score by scoring the fluorescence intensity of suberin lamella in tangential (periclinal) walls adjacent to cortex cells in the most mature region as 2, scoring the absence of fluorescence intensity as 0, and scoring a fluorescence intensity of intermediate strength as 1. All endodermal cells showing a suberin lamella within a given cross-section had usually the same score, i.e. 1 or 2, and we counted the number of cells in the endodermis of a cross-section and multiplied that number with the score (0, 1, 2), resulting in a certain number of points. The number of points was expressed as a percentage of the maximum number of points (numerical product of endodermal cell number and 2) that could be achieved in a section.
Stomatal density
The number of stomata per unit projected leaf area (stomatal density) was determined through a double-replica technique (Even et al., 2018). The average of values of stomatal density (stomata per square metre of leaf surface) for adaxial and abaxial surface was taken as a measure of the stomatal density of leaf 2 for a particular plant. Three or four plants were analysed for each treatment, with three to five measurements taken per plant.
Chlorophyll content
The chlorophyll content of leaves was determined for 18-d-old plants using a CCM-300 chlorophyll meter (Opti-Sciences, Hudson NH, USA).
Statistical analyses
Data were subjected to one-way ANOVA and correlation analyses using functions in Minitab. A pairwise comparison (Student’s t-test) was used in exudation experiments, in which identical root systems were exposed to different treatments (e.g. Hg and Hg/DTT, and medium exchange).
RESULTS
Plant growth
Barley plants that grew on low-N media showed a significant decrease in shoot and increase in root surface area (Fig. 1A, B). The shoot and root surface area of plants grown on low-P medium was intermediate to that of control and low-N plants (Fig. 1A, B). The root-to-shoot surface area ratio differed significantly between all three nutritional treatments, being highest for low-N plants (1.86), intermediate for low-P plants (1.02) and lowest for control plants (0.56) (Fig. 1C).
The chlorophyll content of leaves decreased significantly in response to the low-N treatment and did not change in response to the low-P treatment (Fig. 1D).
Transpiration
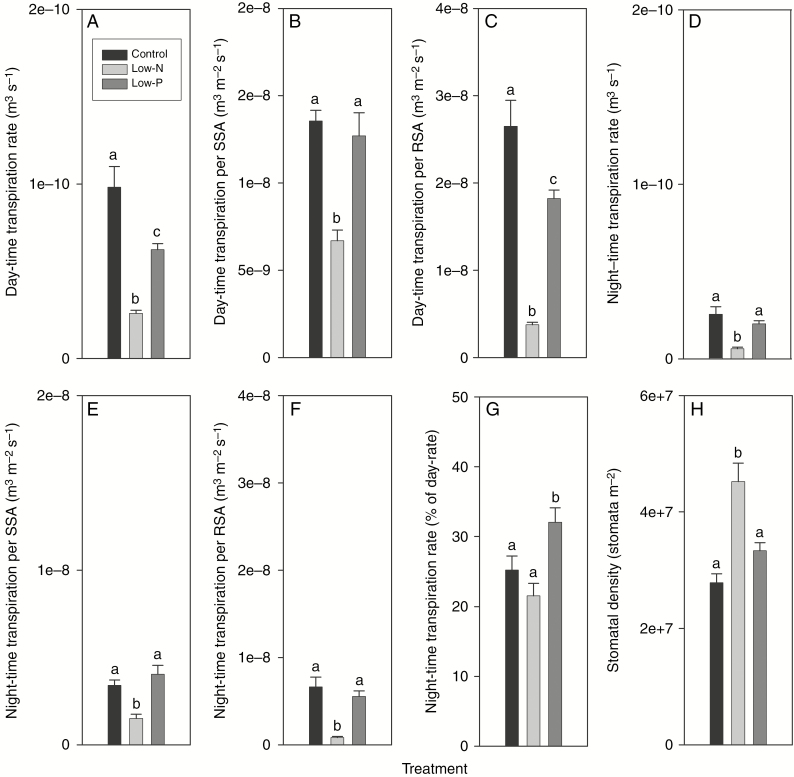
The rate of daytime transpirational water loss per plant decreased significantly and by almost 75 % in response to the low-N treatment, from 9.82 × 10⁻¹¹ m3 s−1 in control to 2.59 × 10⁻¹¹ m3 s−1 in low-N plants (Fig. 2A). The decrease in day-time transpiration rate in response to the low-P treatment was also significant, though not as large (decrease of 36 %). Transpirational water loss per unit shoot surface area decreased significantly in response to the low-N treatment and was hardly affected by the low-P treatment (Fig. 2B). Transpirational water loss provides a good approximation of root water uptake as only a very small fraction of the water taken up is retained in the plant through cell expansion (Fricke and Peters, 2002). The rate of transpirational water loss per unit root surface decreased by 86 % in response to the low-N and by 31 % in response to the low-P treatment (Fig. 2C). The low-P but not low-N treatment affected the rate of night-time transpirational water loss relatively more than it affected the daytime rate. While night-time rates amounted to 25.2 and 21.5 % of daytime rates of transpirational water loss in control and low-N plants, respectively, this figure increased significantly to 32 % in low-P plants (Fig. 2D–G).
Fig. 2.
Transpiration and stomatal density of 14- to 18-d-old barley plants grown on complete nutrient solution (control) or on nutrient solution containing only 3.33 % of the nitrogen (low-N) or 2.5 % the phosphate (low-P) of the control solution. (A–C) Daytime transpiration rate expressed on a (A) plant, (B) shoot surface area (SSA) and (C) root surface area (RSA) basis. (D–F) Night-time transpiration rate expressed on a (D) plant, (E) SSA and (F) RSA basis. (G) Night-time rate of transpiration expressed as a percentage of the daytime rate. (H) Stomatal density of leaf 2. Results are mean and s.e. (error bars) of (A–G) 9–11 and (H) 4 or 5 plant analyses. Statistically significant differences (P < 0.05) in values between treatments are indicated by different letters above the columns.
Stomatal density increased by 62 % in response to the low-N treatment and changed little in response to the low-P treatment (Fig. 2H). The ratio between the stomatal density of the adaxial and abaxial leaf surfaces was not affected by nutritional treatments and was close to 1.0 (range 1.02–1.07 across treatments; not shown).
Root hydraulic conductivity
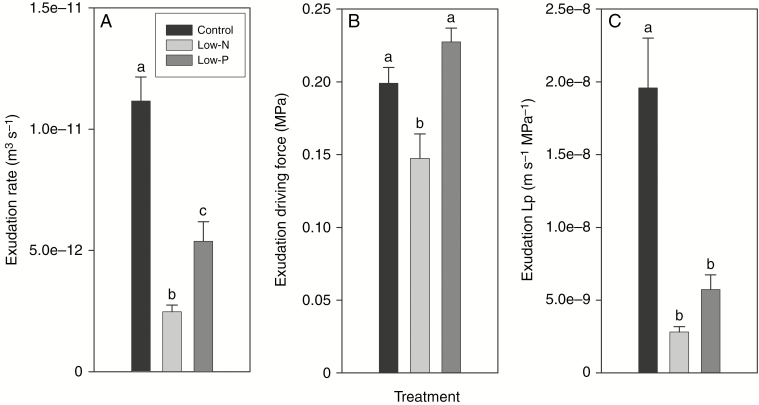
The exudation rate of excised root systems decreased significantly by 78 % in response to the low-N and by 52 % in response to the low-P treatment (Fig. 3A). The driving force of exudation – the difference between root medium and exudate osmotic pressure – decreased significantly by 26 % in response to the low-N treatment and increased slightly in response to the low-P treatment (Fig. 3B). Root Lp decreased significantly by 86 and 71 % in response to the low-N and low-P treatments, respectively (Fig. 3C).
Fig. 3.
Root exudation data of 14- to 18-d-old barley plants grown on complete nutrient solution (control) or on nutrient solution containing only 3.33 % of the nitrogen (low-N) or 2.5 % of the phosphate (low-P) of the control solution. (A) Exudation rate, (B) osmotic exudation driving force and (C) exudation root hydraulic conductivity (Lp). Results are mean and s.e. (error bars) of 11 or 12 plant analyses. Statistically significant differences (P < 0.05) in values between treatments are indicated by different letters above the columns.
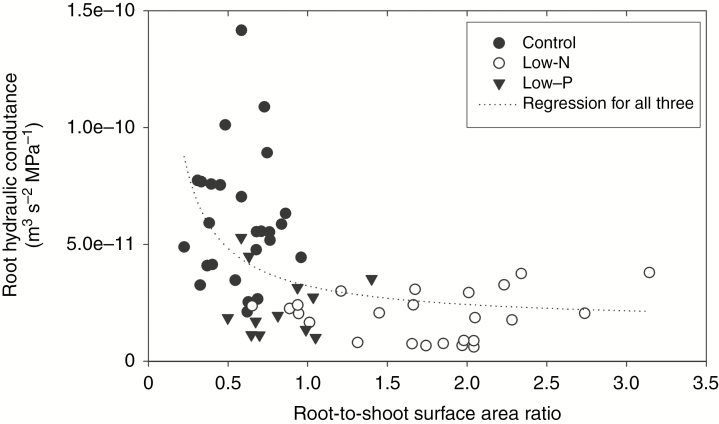
Data from all exudation experiments were pooled to plot root hydraulic conductance (L, unit, m3 s−1 MPa−1) against the respective root-to-shoot surface area ratio of plants used for exudation analyses. Conductance but not Lp was plotted, to avoid plotting two sizes that involve root surface area in their calculation against each other. The correlation between the two sizes was highly significant (P < 0.001; Fig. 4).
Fig. 4.
Correlation between the root-to-shoot surface area ratio and root hydraulic conductance of 14- to 18-d-old barley plants. Plants were grown on complete nutrient solution (control) or on nutrient solution containing only 3.33 % of the nitrogen (low-N) or 2.5 % of the phosphate (low-P) of the control solution. Root L was determined by exudation analyses. Each point (n = 63) represents a pair of values for one plant. Correlation analysis was carried out with Minitab using data points from all three treatments, including the control. The Pearson correlation coefficient was −0.459 (P < 0.001). The curve fit is exponential (y = a × x−b), where a = 2.65 × 10⁻¹¹ and b = 0.704; r2 = 0.3124.
Cell hydraulic conductivity
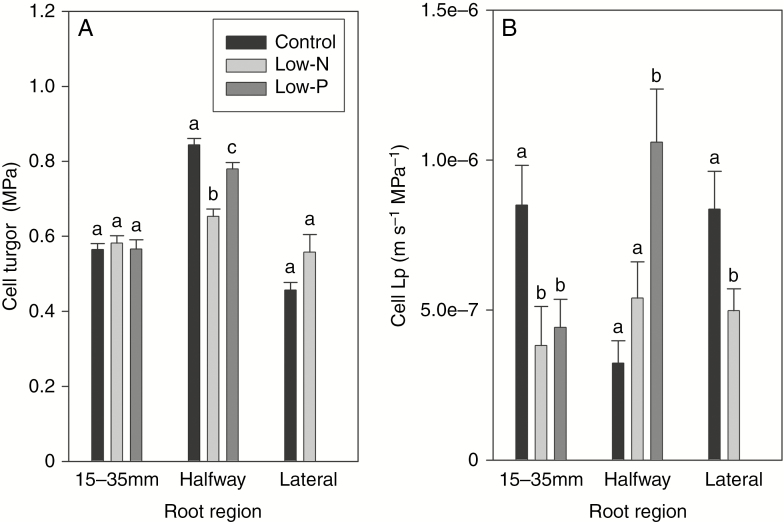
Turgor in root cortex cells located 15–35 mm from the tip along the main axis of seminal roots did not differ significantly between treatments and ranged from 0.557 MPa in control to 0.582 MPa in low-N plants (Fig. 5A). Cell turgor was generally higher in the fully mature root region of seminal roots, being highest in control (0.844 MPa), intermediate in low-P (0.780 MPa) and lowest in low-N plants (0.648 MPa; differences significant between treatments; Fig. 5A). Turgor in cortex cells of primary lateral roots averaged 0.46 MPa in control and 0.56 MPa in low-N plants (difference not significant between treatments; low-P plants were not analysed in primary lateral roots).
Fig. 5.
Cell pressure probe analyses of 14- to 18-d-old barley plants. Plants were grown on complete nutrient solution (control) or on nutrient solution containing only 3.33 % of the nitrogen (low-N) or 2.5 % of the phosphate (low-P) of the control solution. The main axis of seminal roots was analysed 15–35 mm from the tip or halfway along the entire length of root; primary lateral roots were also analysed (control and low-N plants only). (A) Turgor and (B) cell hydraulic conductivity (Lp). Results are mean and s.e. (error bars) of 12–19 (15–3 mm), 7–11 (halfway position) and 8–9 (lateral roots) cell analyses of several roots of each treatment. Statistically significant differences (P < 0.05) in values between treatments for a particular root position and type are indicated by different letters above the columns.
Cell Lp decreased significantly (P < 0.05) by 62 % in response to the low-N and by 54 % in response to the low-P treatment at 15–35 mm from the tip (Fig. 5B). The situation was very different in the mature root region, where cell Lp was lowest in control plants and significantly highest in low-P plants (Fig. 5B). Cell Lp in primary lateral roots averaged 8.37 × 10⁻⁷ m s−1 MPa−1 in control plants and was significantly lower in low-N plants, where it averaged 4.98 × 10⁻⁷ m s−1 MPa−1 (Fig. 5B). When comparing cortex cell Lp between the different root regions for each treatment, Lp was comparable and highest in the tip and lateral root region in control plants, within a comparatively narrow range in low-N plants, and highest in the mature root region in low-P plants.
AQP gene expression
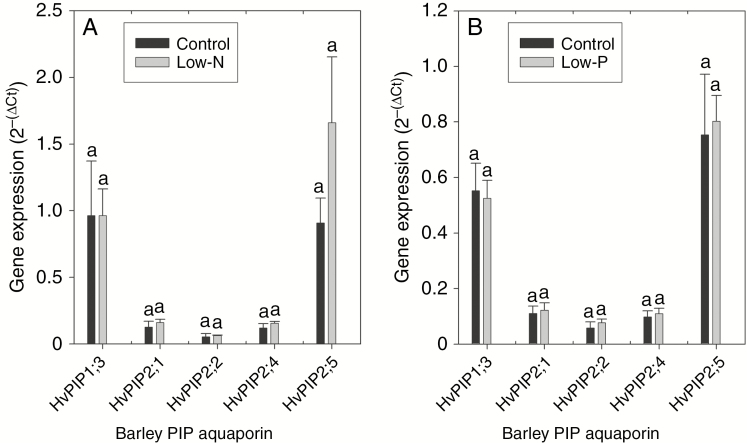
Neither of the two nutritional treatments significantly affected the gene expression level of the five candidate PIPs tested (Fig. 6). There was a slight tendency towards an increase in gene expression, particularly for HvPIP2;5, in response to the low-N treatment.
Fig. 6.
Gene expression of PIP AQPs in roots of 14- to 18-d-old barley plants. Plants were grown on complete nutrient solution (control) or on nutrient solution containing only 3.33 % of the nitrogen (low-N) or 2.5 % the phosphate (low-P) of the control solution. Two sets of experiments were carried out; in the first set (A) expression was compared between control and low-N plants and in the second set (B) expression was compared between control and low-P plants. Expression of PIP genes was related to that of the references genes, which resulted in ∆Ct values; the 2−(∆Ct) values shown represent the fold-time expression of the PIP gene relative to that of the three reference genes (value set to 1.0). Four or five replicate plant samples were analysed in each set of experiments and for each treatment, and results are mean and s.e. (error bars). Statistically significant differences in candidate PIP gene expression between treatments are indicated by different letters above the columns.
Root anatomy
Main root axis.
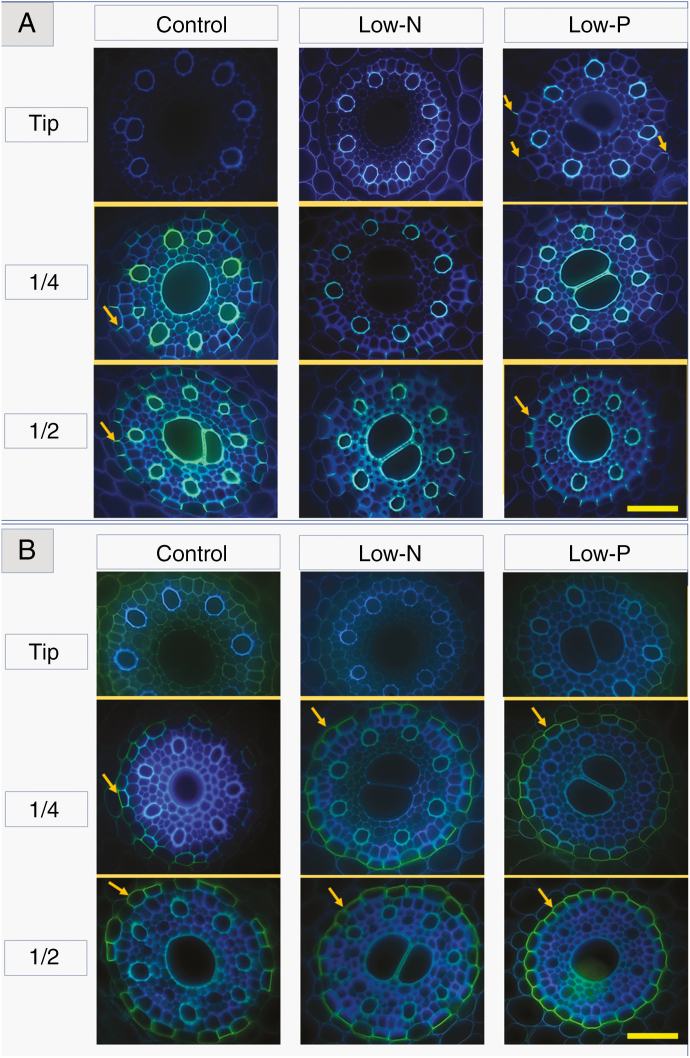
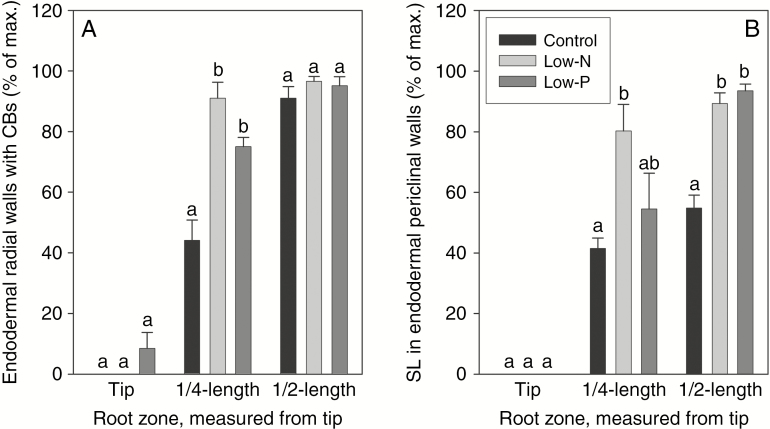
Sections of the immature root region near the tip showed no (control, low-N), or occasionally (low-P) very few Casparian bands, which appeared either as small dots (early developmental stage; e.g. compare Kreszies et al., 2018) or as already fully formed bands along the entire length of radial walls of endodermal cells (Figs 7A and 8A). Autofluorescence of stelar walls, being indicative of lignification, was more pronounced in the low-N and low-P treatments compared with the control treatment (Figs 7A and 8A). At a quarter of total root length, measured from the tip, where root hairs had formed and lateral roots started to emerge, fully formed Casparian bands that covered the entire length of radial walls were present in all treatments, particularly in the low-P and low-N treatments; the latter showed the greatest abundance of fully formed Casparian bands (Figs 7A and 8A). Fully formed Casparian bands were present in almost all or all radial walls of endodermal cells in the mature root region (halfway along the entire root axis) in the three treatments (Figs 7A and 8A).
Fig. 7.
Root anatomy of 14- to 18-d-old barley plants. Plants were grown on complete nutrient solution (control) or on nutrient solution containing only 3.33 % of the nitrogen (low-N) or 2.5 % of the phosphate (low-P) of the control solution. Sections were made at three positions along the main axis of seminal roots, 9–11 mm from the tip (start of root hair region), at a quarter of total root length, counted from the tip (1/4) and halfway along the root axis (1/2). Images focus on the stelar region of roots. (A) Casparian bands (bright yellow–blueish signal; arrows) were stained with berberine hemisulphate and (B) suberin and lipid deposits (intense yellow signal; arrows) were visualized by staining with Fluorol Yellow 088. Sections were taken at the different positions from the same root for each treatment, except the control 1/4 position in (A) which was taken from a different root. Tissues and endodermal features are explained in Supplementary Data File S1. Scale bar = 50 µm.
Fig. 8.
Semi-quantitative assessment of the occurrence of (A) fully formed Casparian bands (CBs) and (B) suberin lamellae (SL) in the main axis of seminal roots of 14- to 18-d-old barley plants. Plants were grown on complete nutrient solution (control) or on nutrient solution containing only 3.33 % of the nitrogen (low-N) or 2.5 % of the phosphate (low-P) of the control solution. Sections were made at three positions along the identical root for a given treatment. Results are means and s.e. (error bars) of four or five root analyses and are expressed as percentage of the maximum possible value if all endodermal cells contained fully formed Casparian bands (i.e. not merely a dot-like appearance of Casparian band structure but a fully-formed band along the entire radial wall of an endodermal cell) and suberin lamella (with staining at highest intensity). Statistically significant differences (P < 0.05) in values between treatments are indicated by different letters above the columns
Suberin lamellae were not visible in the region closest to the root tip (Figs 7B and 8B). At a quarter of total root length, suberin lamellae were most pronounced in roots of low-N plants, showing significantly increased formation of lamellae compared with roots of control plants (Figs 7B and 8B). In the most mature root region analysed, suberin lamellae formed an almost complete or complete ring in the endodermis of low-N and particularly low-P plants. In contrast, control plants contained a significant number of cells without suberin lamellae in their endodermis (Figs 7B and 8B). These cells, being located near protoxylem poles, are passage cells (see also Supplementary Data File S1). Therefore, low-N and low-P treatments led to a significant reduction (low-N), if not complete absence (low-P), of passage cells. This is further visualized by the ubiquitous presence of heavily thickened inner periclinal secondary/tertiary walls, which are absent from passage cells, in the endodermis of low-P plants (Fig. 7A, B).
Lateral roots.
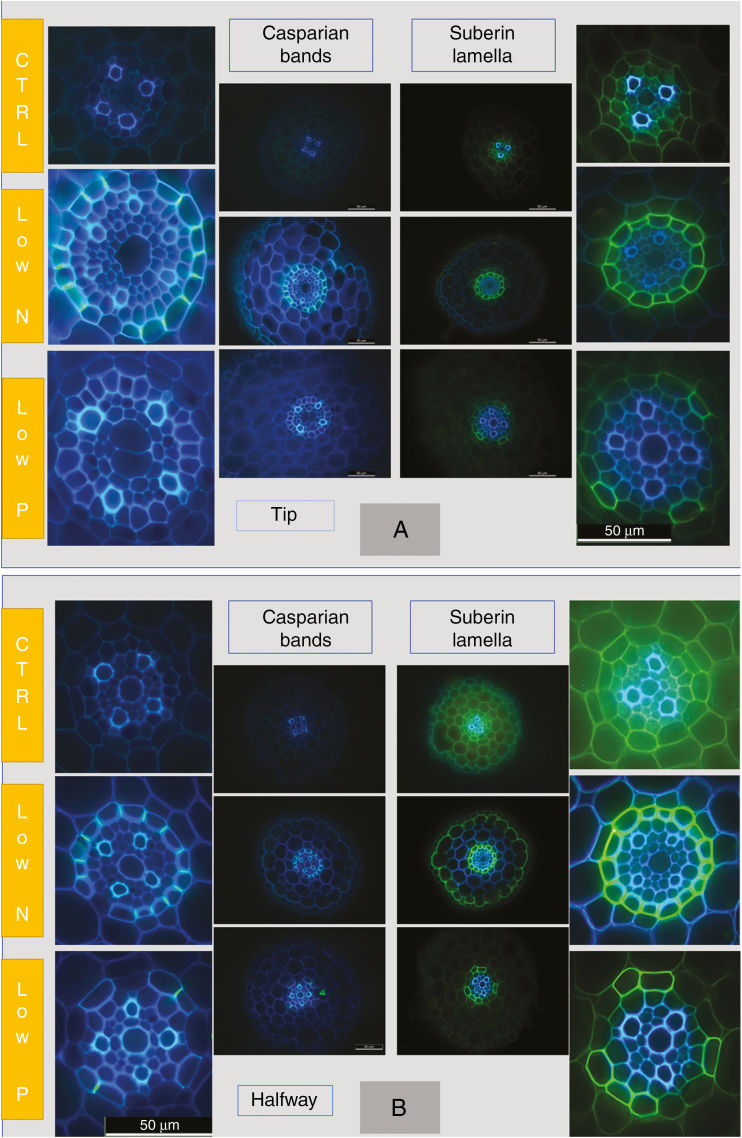
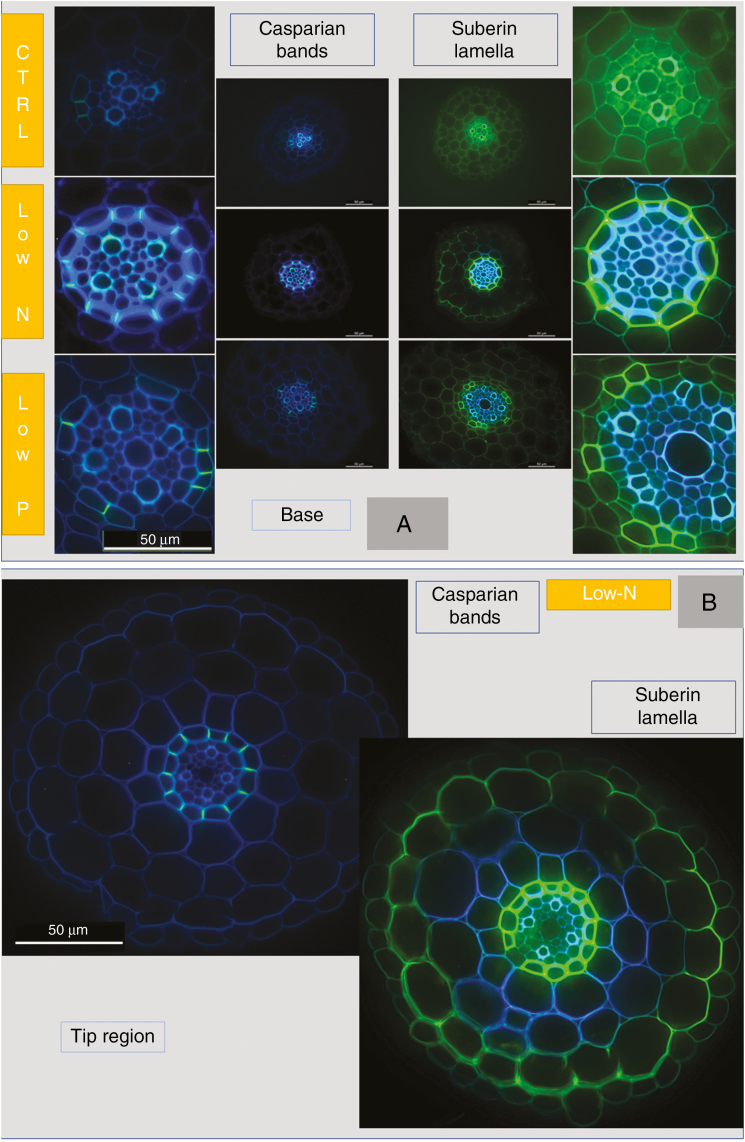
Most of the length of lateral roots of nutrient-sufficient control plants contained neither fully formed Casparian bands nor suberin lamellae in significant quantities (Figs 9 and 10). In contrast, lateral roots of low-N plants showed fully formed Casparian bands and suberin lamellae at all three positions that were analysed (close to the tip, halfway, close to the base), and also in all endodermal cells. Most but not all lateral roots that were analysed in low-N plants also showed halfway an additional layer (ring) of Fluorol Yellow 088 signal in the outer tangential walls of outermost cortical cell layer; we never observed Casparian bands in these roots, which would be typical of an exodermis (Enstone et al., 2003). Lateral roots of low-P plants also showed a significant formation of fully formed Casparian bands and suberin lamellae, but not as pronounced as in low-N plants.
Fig. 9.
Lateral root anatomy of 14- to 18-d-old barley plants. Plants were grown on complete nutrient solution (control, CTRL) or on nutrient solution containing only 3.33 % of the nitrogen (low-N) or 2.5 % of the phosphate (low-P) of the control solution. Sections were made (A) 2–3 mm from the tip and (B) halfway along the root axis. Images in the central two columns show the entire cross-section and the images in the left- and right-hand columns focus on the stelar region of these images. (A) Casparian bands (bright yellow–blueish signal; arrows) were stained with berberine hemisulphate, and (B) suberin and lipid deposits (intense yellow signal; arrows) were visualized by staining with Fluorol Yellow 088. Sections taken at the base of the same lateral roots are shown in Fig. 10. Scale bar = 50 µm.
Fig. 10.
Lateral root anatomy of 14- to 18-d-old barley plants. Plants were grown on complete nutrient solution (CTRL, control) or on nutrient solution containing only 3.33 % of the nitrogen (low-N) or 2.5 % of the phosphate (low-P) of the control solution. Sections were made (A) 1–2 mm from the base of lateral roots, where they emerge from the main root axis. (B) Image taken at the tip region of lateral root of a low-N plant, showing an exodermis-like appearance of suberized structure (intense yellow signal) at the boundary between root epidermis and outermost cortical cell layer (picture on right), in addition to endodermal suberin lamella (intense yellow signal). Casparian bands (bright yellow–blueish signal), which are typical for an exodermis, could only be seen in the endodermis (left image). Scale bar = 50 µm.
AQP inhibitor and medium exchange experiments
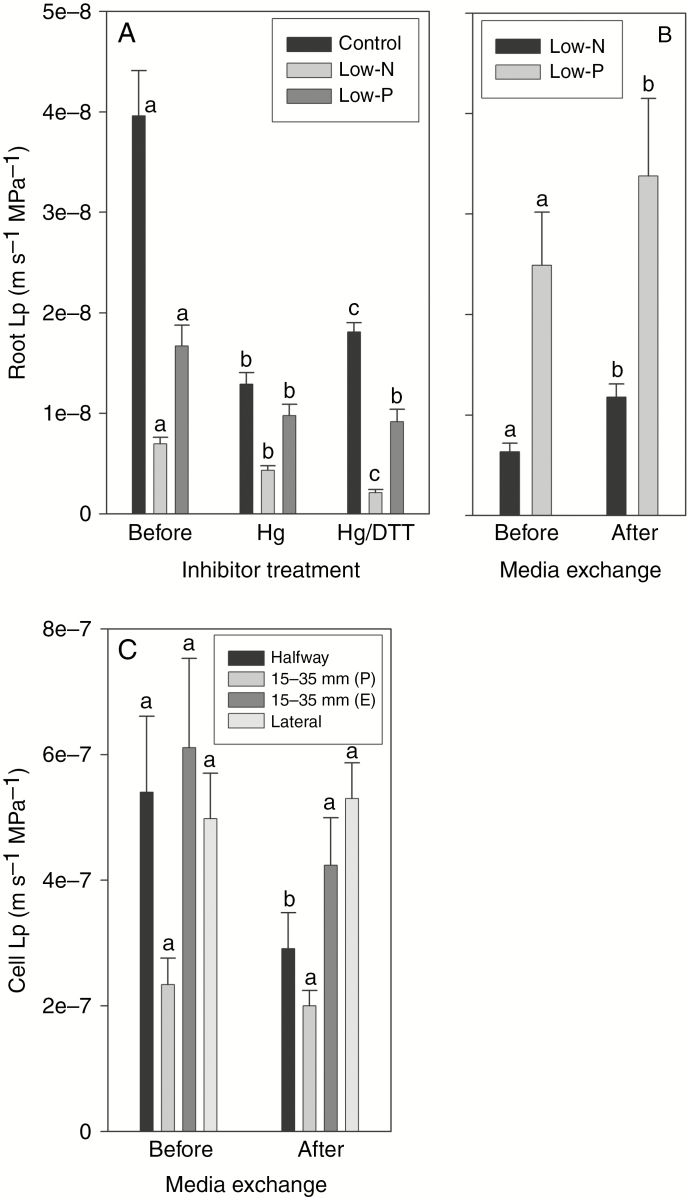
The AQP inhibitor HgCl2 was applied in root exudation experiments (Fig. 11A). Root exudation Lp was significantly reduced in response to the Hg treatment. The reduction in Lp was largest, in absolute terms and also when expressed as percentage of the non-inhibited value, in control plants and considerably smaller in low-P and low-N plants. As a result, Lp of Hg-treated roots differed much less between treatments than the Lp of roots prior to the Hg treatment. The reducing agent DTT, which can reverse some of the inhibitory effect of Hg on AQPs (Maurel et al., 2015), restored some of the Lp in control plants, none of the Lp in low-P plants, and reduced Lp even further in low-N plants.
Fig. 11.
Effects of the AQP inhibitor HgCl2 and the subsequent addition of reducing agent DTT, and of medium exchange on root hydraulic conductivity (Lp) and cortex cell Lp (only medium exchange tested). Barley plants were 14–18 d old at the time of analyses and had been grown on complete nutrient solution (control) or on nutrient solution containing only 3.33 % of the nitrogen (low-N) or 2.5 % of the phosphate (low-P) of the control solution. (A) Root Lp was analysed in exuding root systems before and following the exposure of roots to 50 μm HgCl2 for 5 min. Following analyses of Hg-treated roots, DTT was added at a final concentration of 5 mm and analyses continued. (B) To test the effect of re-supply of nutrient-sufficient medium on root Lp, low-P and low-N plants were first analysed for root exudation Lp, then re-supplied with complete nutrient medium and analysed again 20–80 min later. (C) A similar exchange of medium was carried out for low-N plants while being analysed for cell Lp halfway along the root axis and 15–35 mm from the tip in a transpiring plant [15–35 mm (P)] or excised root systems [15–35 mm (E)]; cells were also analysed in primary lateral roots of a transpiring plant. Data are the mean and s.e. for (n) 7–14 plants (A, B) and 8–13 cell analyses (C). Statistically significant differences (P < 0.05) in values between experimental treatments (A, before, Hg and Hg/DTT; B and C, before and after medium exchange) are indicated by different letters above the columns.
The Lp of the root system of low-P and low-N plants was determined through exudation experiments in which root systems were first analysed while being bathed in their low-nutrient media and then analysed between 20 and 80 min following the addition of control nutrient solution (final concentration quarter-strength). This medium exchange caused root Lp to increase significantly in low-P and particularly low-N plants (Fig. 11B). Root system Lp increased by 37 % in low-P and doubled in low-N plants. To test whether the increase in root system Lp was associated with changes in root cortex cell Lp, a set of cell pressure probe analyses was carried out on low-N plants, which had shown the larger increase in Lp in response to medium exchange. First, an intact, transpiring plant was analysed in the mature root region, halfway along the main root axis, for 1 h prior to and between 20 and 80 min following medium exchange. Exchange of low-N for control medium reduced cell Lp by almost half, though non-significantly (Fig. 11C). Another plant was analysed, also under transpiring conditions, at 15–35 mm from the root tip. Exchange of medium did not affect cell Lp (Fig. 11C). A third experiment was carried out, where cells were again analysed 15–35 mm from the tip, but this time the excised root system of one plant was analysed using the same setup as during exudation analyses. Cell Lp showed a small and non-significant decrease (Fig. 11C). Finally, cortex cell Lp was analysed also in lateral roots of a low-N plant under transpiring conditions, prior to and following an exchange of low-N for nutrient-sufficient medium. Again, cell Lp hardly changed (Fig. 11C).
Discussion
Adjustment of root water uptake in response to nutrient supply involves changes in Lp
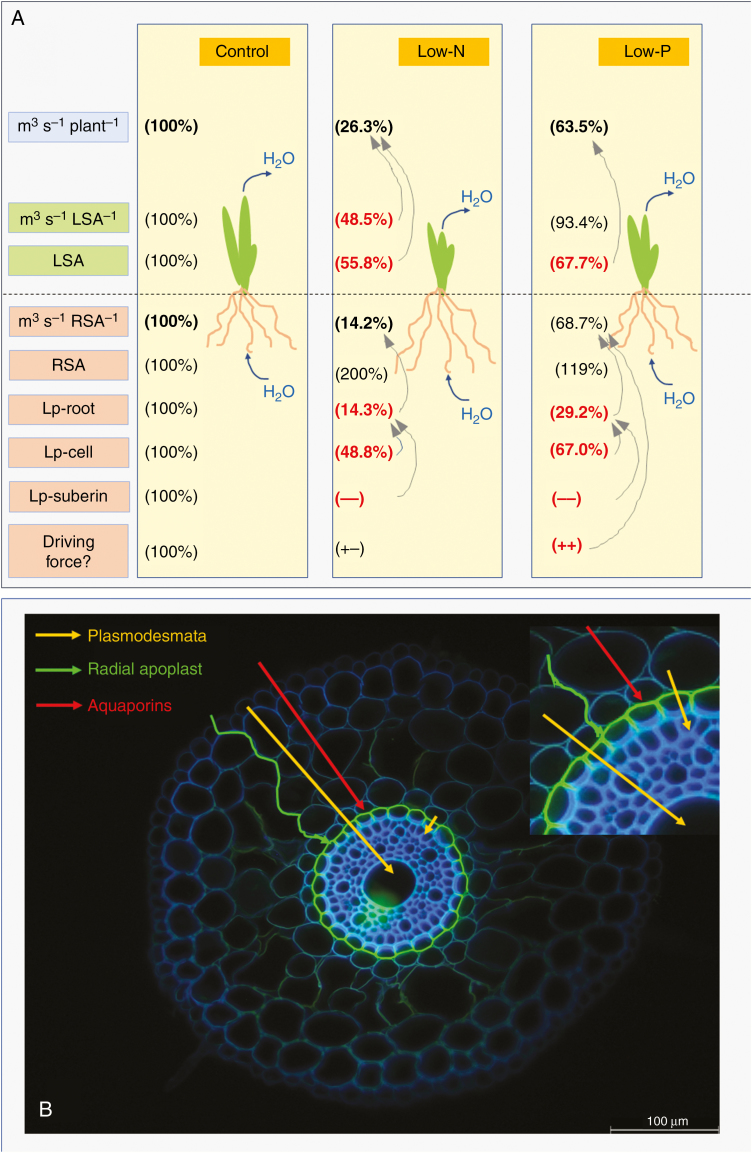
The relation between root hydraulic conductance (L; m3 s−1 MPa−1) and the root-to-shoot surface area ratio was highly significant and negative across all three treatments, including the control. Control plants exhibited the largest and low-N plants the lowest value of L. The area ratio between root and shoot increased in response to nutritional treatments, mainly due to a combination of increased root and decreased shoot surface area and not solely due to a reduced shoot surface area. This means that the difference in L between treatments reflected differences in the water transport properties of roots and the size of the biophysical force that drove water flow between the root medium and xylem. The decrease in the rate of water uptake per unit root surface area in low-N plants (14.2 % rate; Fig. 12A) could be accounted for entirely by a decrease in root Lp (14.3 % residual Lp; Fig. 12A). It is not clear which size (Lp or surface area ratio), if any, caused which size to change. Data in the literature support both possibilities (Radin and Matthews, 1989; Kaldenhoff et al., 1998; Katsuhara et al., 2003; Ruggiero and Angelino, 2007; Li et al., 2009). In low-P plants, root water uptake per unit root surface area decreased less (68.7 % residual rate; Fig. 12A) than root Lp (29.2 % residual Lp; Fig. 12A). The biophysical force that drove water uptake into the xylem may have increased in these plants.
Fig. 12.
(A) Schematic of changes that affect water flow in 14- to 18-d-old barley plants in response to a low supply of N and P. The boxes in the left panel represent (from top to bottom) transpirational water flow rate per plant (m3 s−1 plant−1); transpirational water flow per leaf surface area (m3 s−1 LSA−1); leaf surface area (LSA); transpirational water flow per root surface area (m3 s−1 RSA−1); root surface area (RSA); root hydraulic conductivity (Lp-root); cell hydraulic conductivity (Lp-cell) at 15–35 mm from the tip of the main axis of seminal roots; qualitative assessment of the hydraulic conductivity of suberin lamella (Lp-suberin; 100 %, control level; –, less conductance); and driving force for radial root water uptake in a transpiring plant (Driving force?). The driving force was not measured and it can only be speculated (‘?’) whether and how (+−, no change; ++, increase) it changed in response to nutritional treatment. Values in low-N and low-P plants are expressed as percentage of the control value (set to 100 %). Arrows indicate the contributions of certain processes to some of the quantities analysed. For example, in the low-N condition reductions in transpirational water loss per LSA and also LSA contributed, together, to the reduction in the rate of plant transpirational water loss. In the same plants, the reduction in root Lp could explain, on its own, the reduction in transpirational water flow (and associated water uptake) per root surface area. (B) Flow paths for water across the root cylinder of plants, such as low-N and low-P plants, which have the endodermis completely covered with suberin lamella in the tangential walls and have Casparian bands in all radial walls. Three flow paths are distinguished: a purely apoplastic path along the radial walls, which is slowed down/blocked by Casparian bands; a path involving transport through AQPs, which may proceed up to the innermost cortex cell layer and is then slowed down/blocked by suberin lamella; and a symplasmic flow path involving transport through plasmodesmata, bypassing suberin lamella. The small picture at the top right shows part of the main picture at twice the magnification.
We can conclude from these data that a decrease in root Lp, as reported previously for other plant species in response to nutrient limitation (for reviews see Clarkson et al., 2000; Aroca et al., 2012; Wang et al., 2016) is a major means through which barley plants adjust root water uptake when the root-to-shoot surface area ratio increases significantly in response to a low supply of N and P.
AQPs and suberin lamellae act in tandem on water flow across the root cylinder
We wanted to test whether any changes in root Lp in response to a low supply of N and P are associated with changes in (1) the activity and gene expression level of AQPs and (2) the presence of Casparian bands and suberin lamellae. Aquaporin activity was assessed through determining cell Lp using the cell pressure probe, and the presence of apoplastic barriers was assessed through staining cross-sections with the fluorochromes berberin hemisulphate (Casparian bands) and Fluorol Yellow 088 (suberin lamellae). Cell Lp measured with the cell pressure probe is reduced significantly in the presence of the AQP inhibitor Hg, as also shown for barley (Knipfer and Fricke, 2011). Similarly, a more abundant staining of cross-sections with berberin hemisulphate and Fluorol Yellow 088 has been shown to be accompanied by increased amounts of chemical constituents of Casparian bands (Man et al., 2018) and suberin lamellae, the latter for barley (Kreszies et al., 2018). We conclude from these data that cell Lp determined with the cell pressure probe provides a fair reflection of AQP activity, and that changes in the appearance and intensity of staining of berberin hemisulphate and Fluorol Yellow 088 provide a fair reflection of changes in the formation of Casparian bands and suberin lamellae as well.
The composite model of water transport across the root cylinder distinguishes between a primarily apoplastic and a non-apoplastic, cell-to-cell transport route (Steudle and Peterson, 1998; Steudle, 2000). The latter route consists of a symplastic path, through plasmodesmata, and a transcellular path, through the membrane lipid bilayer and AQPs (Steudle and Peterson, 1998; Fig. 12B). The composite model makes it easier to draw conclusions on on the role of AQPs in the regulation of root water uptake (for reviews and discussion see Steudle and Peterson, 1998; Steudle, 2000; Knipfer and Fricke, 2011; Gambetta et al., 2017), but also oversimplifies the term ‘apoplast’. Substances may well travel radially along a purely apoplastic path from root medium to xylem – and the term ‘purely’ refers here to an exclusive path of movement along radial walls without entering at any stage the protoplasm of cells. Casparian bands impact on a purely apoplastic transport route. In contrast, suberin lamellae, which are located between the tangential walls and plasma membrane of endodermal cells, impact on the cell-to-cell path, as substances which exit the protoplasm of the innermost layer of cortex cells must pass this location before entering the protoplasm of endodermal cells. Changes in cell Lp and AQP function and the suberinization of endodermis work in series/tandem to affect root Lp and are not two mutually exclusive mechanisms.
Evidence in support of a contribution of AQPs to changes in root Lp in low-P and low-N plants
Previous work on barley has shown that the bulk of water flow across the root cylinder occurs along the cell-to-cell path and involves AQP activity (Steudle and Jeschke, 1983; Knipfer and Fricke, 2010, 2011; Ranathunge et al., 2017). There exists some controversy as to how much a purely apoplastic path contributes to water flow in barley, with figures being close to 0 % (Knipfer and Fricke, 2011) or around 26 % (Ranathunge et al., 2017). One would expect in either case that a reduction in root Lp of significantly more than 27 % through a treatment, such as a nutritional treatment of plants or an experimental application of the AQP inhibitor Hg, points to a downregulation of AQP activity. This was observed in the present study, where root Lp of low-N and low-P plants decreased by 86 and 71 %, respectively, compared with the Lp in nutrient-sufficient control plants, and where the application of Hg reduced root Lp in control plants by 63 %. Also, the difference in residual Lp of Hg-treated roots between low-N and low-P plants on the one hand and and control plants on the other was far less than the difference observed for non-Hg-treated roots.
Cortex cell Lp in the zone 15–35 mm from the tip along the main axis of seminal roots decreased significantly in response to the low-N and low-P treatments, as did cortex cell Lp in primary lateral roots of low-N plants (low-P plants not tested). These root zones have suberin lamellae incompletely developed in control plants (Figs 7, 9 and 10) and contribute most to root water uptake in barley (Sanderson, 1983; Knipfer and Fricke, 2011). Significant decreases in root cortex cell Lp in response to mineral nutrition have been reported for barley (low-K; Coffey et al., 2018) and cotton (Gossypium hirsutum, low-P and low N; Radin and Matthews, 1989), whereas figleaf gourd (Cucurbita ficifolia) plants showed minor changes in cell Lp (low N, P, K; Rhee et al., 2011). Common to these studies is that Lp at root and cell level showed the same qualitative (increase/decrease) change.
The re-supply of nutrient-sufficient medium to exuding root systems of low-N and low-P plants caused a rapid (20–80 min) and significant increase in root Lp, as reported previously for wheat plants (Carvajal et al., 1996). Suberin lamellae and Casparian bands provide rather permanent, though not necessarily entirely permanent (Barberon et al., 2016), structures. Our own examination of cross-sections of root systems of low-N plants revealed no visible difference in the staining intensity of Casparian bands and suberin lamellae between plants prior to and following exchange of media (not shown).
We conclude from the above analyses that downregulation of a plant property that displays inhibition through Hg and is rapidly responsive and reversible, such as AQP activity (Maurel et al., 2015), contributed to the decrease in root Lp in low-P and low-N plants. A reduction in cortex cell Lp in the tip and lateral root region played a major role in the downregulation of root Lp.
Root Lp changes, but neither AQP gene expression nor cortex cell Lp needs to change
We tested the gene expression level of five candidate PIPs, but none of them showed a significant change in expression in response to the low-P and low-N treatment. The PIPs included PIPs that have been previously implicated in the control of water transport in barley roots (Katsuhara et al., 2002; Knipfer et al., 2011; for review see Fricke and Knipfer, 2017), as they are (1) expressed in the root cortex [HvPIP2;2, HvPIP2;5 (Knipfer et al., 2011)], (2) expressed more in adventitious compared with seminal roots, the former showing a higher root Lp [HvPIP2;5 (Knipfer et al., 2011)] or are expressed at the highest level in lateral roots [HvPIP2;2 (Knipfer et al., 2011)], (3) account for the bulk of PIP1/2 expression in roots [HvPIP1;3, HvPIP2;5 (Knipfer et al., 2011)], (4) display water channel activity when expressed in the heterologous expression system of Xenopus laevis oocytes [HvPIP2;2, HvPIP2;5 (Besse et al., 2011); HvPIP2;1 (Katsuhara et al., 2002)], (5) are localized at the plasma membrane [HvPIP2;2 (Besse et al., 2011)] or (6) decrease in gene expression in barley plants that are exposed to high Zn and low K and where root Lp decreases in parallel [HvPIP1;3, HvPIP2;4, HvPIP2;5 (Gitto and Fricke, 2018; Coffey et al., 2018)]. There exist no studies on transgenic barley plants or the closely related wheat (Triticum aestivum and Triticum durum), which overexpress or do not express a particular PIP isoform in roots, unlike studies in e.g. Arabidopsis (e.g. Postaire et al., 2010). Therefore, we cannot say with certainty whether the PIPs studied here are actually important for the regulation of Lp in barley roots.
The gene expression level of PIPs can vary in an isoform-dependent manner along the main axis of seminal roots of barley (Knipfer et al., 2011) and other plant species (Gambetta et al., 2013, 2017). By analysing the gene expression of candidate PIPs in extracts prepared from the entire root system, local decreases in gene expression, as they may have occurred 15–35 mm from the tip and in lateral roots in low-P and low-N plants, may have remained undetected. An alternative, and in our view more likely, explanation for the lack of change in AQP gene expression in roots with lowered Lp is that AQP activity was regulated at the protein level, for example through phosphorylation and trafficking (Boursiac et al., 2005, 2008; Lee and Zwiazek, 2015; Wudick et al., 2015; for discussion and review see Muries et al., 2011; Maurel et al., 2015), or could have been a consequence of stress-induced changes in plasma membrane lipid composition (Carvajal et al., 1996). It has also been suggested that changes in the active amount of AQP protein counteract changes at the gene transcriptional level (Muries et al., 2011).
The ability of low-N and also low-P plants to rapidly recover some root Lp when nutrient-sufficient medium was added points to a mechanism that is reversible or can be induced in the minutes-to-hour range. Cell Lp determined with the cell pressure probe technique can reflect water transport through the membrane lipid bilayer, plasmodesmata and AQPs. However, the Lp of cortex cells did not change in response to medium exchange, irrespective of the setup (transpiring plant; exuding root system) and root region analysed (main root tip and mature region; lateral roots). The only explanation we have for this observation is that root Lp was upregulated in cells other than cortex cells. A prime candidate are endodermal cells (Bramley et al., 2009).
Casparian bands and suberin lamellae increase in response to low-N and low-P
This is the first study of its kind, for any cereal and grass species, that shows that a low supply of P and N causes significant changes in the formation of Casparian bands and suberin lamellae, not only along the axis of the main root but also along lateral roots. The rather limited data in the literature suggest that the apoplastic barrier response to mineral nutrient limitation depends on both the mineral nutrient and the plant species (Enstone et al., 2003; Baxter et al., 2009; Barberon et al., 2016; Coffey et al., 2018). Tylová et al. (2017) recently pointed out that lateral roots have largely been ignored when studying the formation of apoplastic barriers to environmental stress. For example, Faiyue et al. (2010) concluded from anatomical observations that lateral roots were a major site for bypass flow and uptake of Na+ in salt-stressed rice plants. It is still a matter of debate to what degree suberin lamellae are transport barriers (Clarkson et al., 1968, 1971; Enstone et al., 2003; Geldner, 2013; Kreszies et al., 2018). However, when we look at lateral roots of low-N plants and the formation of suberin lamellae, it is hard to envisage how such a response could not be aimed at controlling the flow of substances across the endodermis. This can apply in either direction of flow, e.g. to the uptake of plant-external water into the stele and to the retention of plant-internal (and limiting) nutrient in the stele. Suberin lamellae may also force substances to move through plasmodesmata (Clarkson et al., 1971; Robards et al., 1973).
Modelling of water flow in roots of barley supplied with nutrient-sufficient and -limited medium
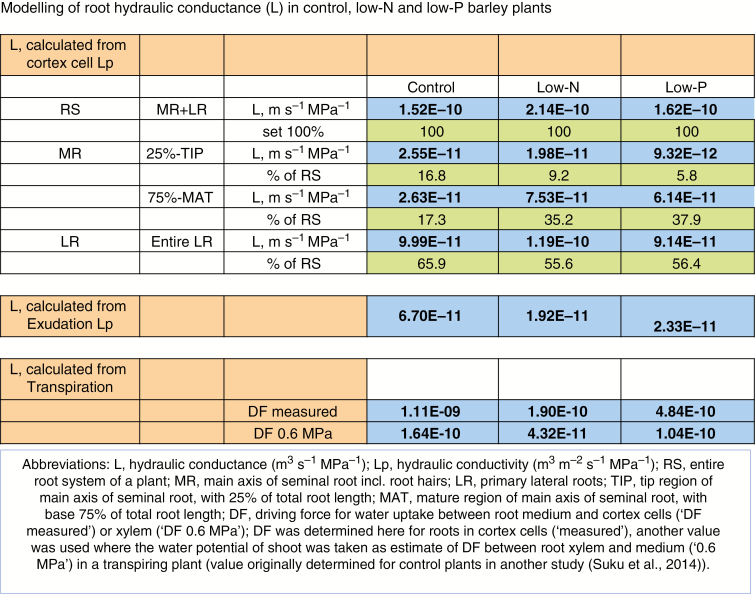
We can use the data on cell Lp and the contribution of different root regions to total root surface area to calculate an overall root L and compare this value with the value for L obtained through exudation experiments and derived from plant transpiration data. For the latter, we require a driving force for water uptake and can use either the difference in water potential between the root medium and cortex cells (calculated from the present data on cell turgor and osmotic pressure) or a value of shoot water potential (Suku et al., 2014; control plants only) as an upper estimate of the water potential difference between root medium and xylem. Lateral roots were only analysed for control and low-N plants, and we use here the mean of the two values (as a gross simplification) for lateral roots of low-P plants. We follow the approach by Bramley et al. (2009) to calculate the overall hydraulic resistance (and the inverse of it, conductance) for concentric rings of cortex cell layers, using values for radii (distance from the centre of the root to the more peripheral and inner wall of a particular cortex cell layer) as determined here for cross-sections. Calculations are detailed in Supplementary Data File S3 and results are shown in Fig. 13. Even though the calculations rely on several assumptions, they provide the best available data set for any nutrient-limited plant and point to some trends.
Fig. 13.
Modelling of root hydraulic conductance (L, m3 s−1 MPa−1) of barley plants grown under nutrient-sufficient control conditions or on media low in N or P (low-N, low-P). Hydraulic conductance was calculated from data on cortex cell hydraulic conductivity (Lp, m3 m−2 s−1 MPa−1) using cell dimensions and the difference in water potential between cortex cells and root medium; or using data on exudation Lp, together with data on root surface area; or using data on plant transpirational water loss together with data on root surface area and the water potential difference between xylem and root medium, being the driving force (DF) of radial root water uptake. A measured value of DF between cortex cells and root medium and a value of DF derived from the determination of shoot water potential as part of a previous study (Suku et al., 2014) was used. Values of cell Lp were available for control and low-N plants for all root positions and types analysed; a gross approximation needed to be made for lateral roots of low-P plants, which were not analysed for Lp, by using the mean value of control and low-N plants. All abbreviations are explained in the legend contained within the figure.
First, the root L calculated from Lp values of cortex cells in intact transpiring plants exceeds that calculated from exudation data of excised root systems by a factor of 2–10 across treatments. This can be+st be explained by the observation that excision of root systems causes a rapid decrease in AQP gene expression, which is accompanied by some decrease in Lp (for discussion see Meng et al., 2016). Even though exudation analyses of excised root systems provide in our view a fair reflection of differences in Lp between treatments (e.g. Meng and Fricke, 2017; Coffey et al., 2018; Gitto and Fricke, 2018) and root types (Knipfer and Fricke, 2011), it provides an inherent underestimation of true Lp.
Secondly, the root L calculated from values of cortex cell Lp is only about one-tenth of the value of L calculated for a transpiring control plant, when using rates of plant transpirational water loss and the water potential difference between root medium and cortex cells (and total root surface area, which is, for the different types of calculations for a particular treatment, the same). The two values of L are almost the same in low-N plants and differ by a factor of 3 in low-P plants. When we use leaf water potential [as determined for control plants in a related study (Suku et al., 2014)] as a measure of the biophysical force that drives water uptake, the two values of L are almost the same in control plants, and the L calculated from transpiration data is only ~20 % (low-N) or 60 % (low-P) of the L value calculated from cortex cell Lp data. Also, even though cell Lp was determined on transpiring plants on the cell pressure probe stage by using supplementary lighting, the actual light intensity reaching the leaf was lower than in the growth room (where transpiration was measured), because the plant needed to be viewed from above through a stereomicroscope. In addition, it is unavoidable to generate significant quantities of CO2 during cell pressure probe analyses, and this will reduce stomatal aperture, which in turn will render xylem water potential less negative. Thus, looking at the data in Fig. 13 this way, one could say that the difference in values between L calculated from data on cell Lp (lower L) and L calculated from data on transpiration (higher L) using cortex cell water potential does not come as a surprise. The observation that the two calculated values are almost the same in low-N plants and differ comparatively little in low-P plants could indicate that there exist hydraulic barriers in the roots of these plants that add significant hydraulic resistance to radial water flow – and that were not accounted for in the modelling of L. Such an interpretation of data is supported by the increased formation of suberin lamellae in roots of low-P and low-N plants, particularly in primary lateral roots of low-N plants. The observation that the residual Lp in roots treated with the AQP inhibitor Hg is lowest in those roots that show the largest amount of apoplastic barriers (low-N) and highest in those roots that show the smallest amount of apoplastic barriers (control) further supports this idea.
Conclusions
Barley plants that are exposed to a growth-limiting supply of N and P show an increased root-to-shoot surface area ratio. Water flow through the root system is adjusted with the aid of changes in root Lp. Most of the evidence presented here points to a mechanism of Lp regulation that is subject to Hg inhibition and reversible in the minutes-to-hour range. Aquaporins fit this requirement. Modelling of root hydraulic conductance and Hg inhibition experiments, together with staining of root cross-sections, further suggests that some of the reduction in root Lp is due to increased formation of apoplastic barriers, particularly suberin lamellae. This applies in particular to primary lateral roots of plants grown on low-N medium.
SUPPLEMENTARY DATA
Supplementary data are available online at https://academic.oup.com/aob and consist of the following. File S1: macronutrient composition of nutrient media, relative growth rate of plants and explanation of root tissues and endodermal anatomical features. File S2: data used for determination of cell hydraulic conductivity (cell pressure probe). File S3: modelling of root hydraulic conductance.
FUNDING
L.L. was funded through a joint CSC (Chinese Scholarship Council)/UCD PhD fellowship scheme. L.L. also receives support through Science and Technology Innovation Funds of Shanxi Agricultural University (2018YJ49).
Supplementary Material
ACKNOWLEDGEMENTS
This work was carried out as part of a UCD Taught Master project (M.C.) and internship visits by T.A and F.B. (Ecole d’Ingénieurs, Purpan, France) to University College Dublin. L.L. was funded through a joint CSC (Chinese Scholarship Council) /UCD PhD fellowship scheme. W.F. would like to thank Eugene Sherry (UCD) for technical assistance.
LITERATURE CITED
- Aroca R, Porcel R, Ruiz-Lozano JM. 2012. Regulation of root water uptake under abiotic stress conditions. Journal of Experimental Botany 63: 43–57. [DOI] [PubMed] [Google Scholar]
- Barberon M. 2017. The endodermis as a checkpoint for nutrients. New Phytologist 213: 1604–1610. [DOI] [PubMed] [Google Scholar]
- Barberon M, Vermeer J, De Bellis D, et al. 2016. Adaptation of root function by nutrient-induced plasticity of endodermal differentiation. Cell 164: 447–459. [DOI] [PubMed] [Google Scholar]
- Baxter I, Hosmani PS, Rus A, et al. 2009. Root suberin forms an extracellular barrier that affects water relations and mineral nutrition in Arabidopsis. PLoS Genetics 5: e1000492. [DOI] [PMC free article] [PubMed] [Google Scholar]
- Besse M, Knipfer T, Miller AJ, Verdeil JL, Jahn TP, Fricke W. 2011. Developmental pattern of aquaporin expression in barley (Hordeum vulgare L.) leaves. Journal of Experimental Botany 62: 4127–4142. [DOI] [PMC free article] [PubMed] [Google Scholar]
- Bieleski RL. 1973. Phosphate pools, phosphate transport, and phosphate availability. Annual Review of Plant Physiology and Plant Molecular Biology 24: 225–252. [Google Scholar]
- Boursiac Y, Chen S, Luu DT, Sorieul M, van den Dries N, Maurel C. 2005. Early effects of salinity on water transport in Arabidopsis roots. Molecular and cellular features of aquaporin expression. Plant Physiology 139: 790–805. [DOI] [PMC free article] [PubMed] [Google Scholar]
- Boursiac Y, Boudet J, Postaire O, Luu DT, Tournaire-Roux C, Maurel C. 2008. Stimulus-induced downregulation of root water transport involves reactive oxygen species-activated cell signalling and plasma membrane intrinsic protein internalization. Plant Journal 56: 207–218. [DOI] [PubMed] [Google Scholar]
- Bramley H, Turner NC, Turner DW, Tyerman SD. 2009. Roles of morphology, anatomy, and aquaporins in determining contrasting hydraulic behavior of roots. Plant Physiology 150: 348–364. [DOI] [PMC free article] [PubMed] [Google Scholar]
- Brundrett MC, Enstone DE, Peterson CA. 1988. A berberine aniline blue staining procedure for suberin, lignin, and callose in plant tissue. Protoplasma 146: 133–142. [Google Scholar]
- Brundrett MC, Kendrick B, Peterson CA. 1991. Efficient lipid staining in plant material with Sudan red 7B or fluorol yellow 088 in polyethylene glycol-glycerol. Biotechnic and Histochemistry 66: 111–116. [DOI] [PubMed] [Google Scholar]
- Carvajal M, Cooke DT, Clarkson DT. 1996. Responses of wheat plants to nutrient deprivation may involve the regulation of water-channel function. Planta 199: 372–381. [Google Scholar]
- Chaumont F, Tyerman SD. 2014. Aquaporins: highly regulated channels controlling plant water relations. Plant Physiology 164: 1600–1618. [DOI] [PMC free article] [PubMed] [Google Scholar]
- Clarkson DT, Sanderson J, Russell RS. 1968. Ion uptake and root age. Nature 220: 805–806. [Google Scholar]
- Clarkson DT, Robards AW, Sanderson J. 1971. The tertiary endodermis in barley roots: fine structure in relation to radial transport of ions and water. Planta 96: 292–305. [DOI] [PubMed] [Google Scholar]
- Clarkson DT, Carvajal M, Henzler T, et al. 2000. Root hydraulic conductance: diurnal aquaporin expression and the effects of nutrient stress. Journal of Experimental Botany 51: 61–70. [PubMed] [Google Scholar]
- Coffey O, Bonfield R, Corre F, Sirigiri JA, Meng D, Fricke W. 2018. Root and cell hydraulic conductivity, apoplastic barriers and aquaporin gene expression in barley (Hordeum vulgare L.) grown with low supply of potassium. Annals of Botany 122: 1131–1141. [DOI] [PMC free article] [PubMed] [Google Scholar]
- Enstone DE, Peterson CA, Ma F. 2003. Root endodermis and exodermis: structure, function, and responses to environment. Journal of Plant Growth Regulation 21: 335–351. [Google Scholar]
- Even M, Sabo M, Meng D, Kreszies T, Schreiber L, Fricke W. 2018. Nighttime transpiration in barley (Hordeum vulgare L.) facilitates respiratory carbon dioxide release and is regulated during salt stress. Annals of Botany 122: 569–582. [DOI] [PMC free article] [PubMed] [Google Scholar]
- Faiyue B, Al-Azzawi MJ, Flowers TJ. 2010. The role of lateral roots in bypass flow in rice (Oryza sativa L.). Plant Cell and Environment 33: 702–716. [DOI] [PubMed] [Google Scholar]
- Fricke W, Knipfer T. 2017. Plant aquaporins and cell elongation. In: Chaumont F, Tyerman S, eds. Plant aquaporins. Cham: Springer, 107–131. [Google Scholar]
- Fricke W, Peters WS. 2002. The biophysics of leaf growth in salt-stressed barley: a study at the cell level. Plant Physiology 129: 374–388. [DOI] [PMC free article] [PubMed] [Google Scholar]
- Gambetta GA, Fei J, Rost TL, et al. 2013. Water uptake along the length of grapevine fine roots: developmental anatomy, tissue-specific aquaporin expression, and pathways of water transport. Plant Physiology 163: 1254–1265. [DOI] [PMC free article] [PubMed] [Google Scholar]
- Gambetta G, Knipfer T, Fricke W, McElrone AJ. 2017. Aquaporins and root water uptake. In: Chaumont F, Tyerman S, eds. Plant aquaporins. Cham: Springer, 133–153. [Google Scholar]
- Geldner N. 2013. The endodermis. Annual Review of Plant Biology 64: 531–558. [DOI] [PubMed] [Google Scholar]
- Gitto A, Fricke W. 2018. Zinc treatment of hydroponically-grown barley (H. vulgare) plants causes a reduction in root and cell hydraulic conductivity and isoform-dependent decrease in aquaporin gene expression. Physiologia Plantarum 164: 176–190. [DOI] [PubMed] [Google Scholar]
- Hermans C, Hammond JP, White PJ, Verbruggen N. 2006. How do plants respond to nutrient shortage by biomass allocation? Trends in Plant Science 11: 610–617. [DOI] [PubMed] [Google Scholar]
- Houlton BZ, Morford SL, Dahlgren RA. 2018. Convergent evidence for widespread rock nitrogen sources in Earth’s surface environment. Science 360: 58–62. [DOI] [PubMed] [Google Scholar]
- Kaldenhoff R, Grote K, Zhu JJ, Zimmermann U. 1998. Significance of plasmalemma aquaporins for water-transport in Arabidopsis thaliana. Plant Journal 14: 121–128. [DOI] [PubMed] [Google Scholar]
- Kano-Nakata M, Suralta RR, Niones JM, Yamauchi A. 2012. Root sampling by using a root box–pinboard method. In: Shashidhar HE, Henry A, Hardy B, eds. Methodologies for root drought studies in rice. Los Baños: International Rice Research Institute, 3–8. [Google Scholar]
- Katsuhara M, Akiyama Y, Koshio K, Shibasaka M, Kasamo K. 2002. Functional analysis of water channels in barley roots. Plant and Cell Physiology 43: 885–893. [DOI] [PubMed] [Google Scholar]
- Katsuhara M, Koshio K, Shibasaka M, Hayashi Y, Hayakawa T, Kasamo K. 2003. Over-expression of a barley aquaporin increased the shoot/root ratio and raised salt sensitivity in transgenic rice plants. Plant and Cell Physiology 44: 1378–1383. [DOI] [PubMed] [Google Scholar]
- Knipfer T, Fricke W. 2010. Root pressure and a solute reflection coefficient close to unity exclude a purely apoplastic pathway of radial water transport in barley (Hordeum vulgare L.). New Phytologist 187: 159–170. [DOI] [PubMed] [Google Scholar]
- Knipfer T, Fricke W. 2011. Water uptake by seminal and adventitious roots in relation to whole-plant water flow in barley (Hordeum vulgare L.). Journal of Experimental Botany 62: 717–733. [DOI] [PMC free article] [PubMed] [Google Scholar]
- Knipfer T, Besse M, Verdeil JL, Fricke W. 2011. Aquaporin-facilitated water uptake in barley (Hordeum vulgare L.) roots. Journal of Experimental Botany 62: 4115–4126. [DOI] [PMC free article] [PubMed] [Google Scholar]
- Koevoets IT, Venema JH, Elzenga JTM, Testerink C. 2016. Roots withstanding their environment: exploiting root system architecture responses to abiotic stress to improve crop tolerance. Frontiers in Plant Science 7: 1335. [DOI] [PMC free article] [PubMed] [Google Scholar]
- Kreszies T, Shellakkutti N, Osthoff A, et al. 2018. Osmotic stress enhances suberization of apoplastic barriers in barley seminal roots: analysis of chemical, transcriptomic and physiological responses. New Phytologist 221: 180–194. [DOI] [PMC free article] [PubMed] [Google Scholar]
- Lee SH, Zwiazek JJ. 2015. Regulation of aquaporin-mediated water transport in Arabidopsis roots exposed to NaCl. Plant and Cell Physiology 56: 750–758. [DOI] [PubMed] [Google Scholar]
- Li YS, Mao XT, Tian QY, Li LH, Zhang WH. 2009. Phosphorus deficiency-induced reduction in root hydraulic conductivity in Medicago falcata is associated with ethylene production. Environmental and Experimental Botany 67: 172–177. [Google Scholar]
- Man Y, Zhao Y, Ye R, Lin J, Jing Y. 2018. In vivo cytological and chemical analysis of Casparian strips using stimulated Raman scattering microscopy. Journal of Plant Physiology 220: 136–144. [DOI] [PubMed] [Google Scholar]
- Maurel C, Boursiac Y, Luu DT, Santoni V, Shahzad Z, Verdoucq L. 2015. Aquaporins in plants. Physiological Reviews 95: 1321–1358. [DOI] [PubMed] [Google Scholar]
- Meng D, Fricke W. 2017. Changes in root hydraulic conductivity facilitate the overall hydraulic response of rice (Oryza sativa L.) cultivars to salt and osmotic stress. Plant Physiology and Biochemistry 113: 64–77. [DOI] [PubMed] [Google Scholar]
- Meng D, Walsh M, Fricke W. 2016. Rapid changes in root hydraulic conductivity and aquaporin expression in rice (Oryza sativa L.) in response to shoot removal – xylem tension as a possible signal. Annals of Botany 118: 809–819. [DOI] [PMC free article] [PubMed] [Google Scholar]
- Muries B, Faize M, Carvajal M, Martínez-Ballesta MC. 2011. Identification and differential induction of the expression of aquaporins by salinity in broccoli plants. Molecular BioSystems 7: 1322–1335. [DOI] [PubMed] [Google Scholar]
- Pfaffl MW. 2001. A new mathematical model for relative quantification in real-time RT-PCR. Nucleic Acids Research 29: e45. [DOI] [PMC free article] [PubMed] [Google Scholar]
- Postaire O, Tournaire-Roux C, Grondin A, et al. 2010. A PIP1 aquaporin contributes to hydrostatic pressure-induced water transport in both the root and rosette of Arabidopsis. Plant Physiology 152: 1418–1430. [DOI] [PMC free article] [PubMed] [Google Scholar]
- Radin JW, Matthews MA. 1989. Water transport properties of cortical cells in roots of nitrogen- and phosphorus-deficient cotton seedlings. Plant Physiology 89: 264–268. [DOI] [PMC free article] [PubMed] [Google Scholar]
- Ranathunge K, Kim YX, Wassmann F, Kreszies T, Zeisler V, Schreiber L. 2017. The composite water and solute transport of barley (Hordeum vulgare) roots: effect of suberized barriers. Annals of Botany 119: 629–643. [DOI] [PMC free article] [PubMed] [Google Scholar]
- Rhee JY, Chung GC, Katsuhara M, Ahn S-J. 2011. Effect of nutrient deficiencies on the water transport properties in figleaf gourd plants. Horticulture, Environment and Biotechnology 52: 629–634. [Google Scholar]
- Robards AW, Jackson M, Clarkson DT, Sanderson J. 1973. The structure of barley roots in relation to the transport of ions into the stele. Protoplasma 77: 291–311. [Google Scholar]
- Ruggiero C, Angelino G. 2007. Changes of root hydraulic conductivity and root/shoot ratio of durum wheat and barley in relation to nitrogen availability and mercury exposure. Italian Journal of Agronomy 2: 281–290. [Google Scholar]
- Sanderson J. 1983. Water uptake by different regions of the barley root. Pathways of radial flow in relation to development of the endodermis. Journal of Experimental Botany 34: 240–253. [Google Scholar]
- Steudle E. 2000. Water uptake by plant roots: an integration of views. Plant and Soil 226: 45–56. [Google Scholar]
- Steudle E, Jeschke WD. 1983. Water transport in barley roots. Planta 158: 237–248. [DOI] [PubMed] [Google Scholar]
- Steudle E, Peterson CA. 1998. How does water get through roots? Journal of Experimental Botany 49: 775–788. [Google Scholar]
- Suku S, Knipfer T, Fricke W. 2014. Do root hydraulic properties change during the early vegetative stage of plant development in barley (Hordeum vulgare)? Annals of Botany 113: 385–402. [DOI] [PMC free article] [PubMed] [Google Scholar]
- Tyerman SD, Wignes JA, Kaiser BN. 2017. Root hydraulic and aquaporin responses to N availability. In: Chaumont F, Tyerman S, eds. Plant aquaporins. Cham: Springer, 207–236. [Google Scholar]
- Tylová E, Pecková E, Blascheová Z, Soukup A. 2017. Casparian bands and suberin lamellae in exodermis of lateral roots: an important trait of roots system response to abiotic stress factors. Annals of Botany 120: 71–85. [DOI] [PMC free article] [PubMed] [Google Scholar]
- Wang M, Ding L, Gao L, Li Y, Shen Q, Guo S. 2016. The interactions of aquaporins and mineral nutrients in higher plants. International Journal of Molecular Sciences 17: 1229–1245. [DOI] [PMC free article] [PubMed] [Google Scholar]
- Wudick MM, Li X, Valentini V, et al. 2015. Subcellular redistribution of root aquaporins induced by hydrogen peroxide. Molecular Plant 8: 1103–1114. [DOI] [PubMed] [Google Scholar]
Associated Data
This section collects any data citations, data availability statements, or supplementary materials included in this article.


