Abstract
Large enhancements in nuclear magnetic resonance (NMR) signals provided by dynamic nuclear polarization (DNP) at low temperatures have the potential to enable inductively-detected 1H magnetic resonance imaging (MRI) with isotropic spatial resolution on the order of one micron, especially when low temperatures and DNP are combined with microcoils, three-dimensional (3D) phase encoding of image information, pulsed spin locking during NMR signal detection, and homonuclear dipolar decoupling by Lee-Goldburg (LG) irradiation or similar methods. However, the relatively slow build-up of nuclear magnetization under DNP leads to very long acquisition times for high-resolution 3D images unless the sample volume or field of view (FOV) is restricted. We have therefore developed a method for slice selection in low-temperature, DNP-enhanced MRI that limits the FOV to about 50 μm in one or more dimensions. This method uses small-amplitude phase modulation of LG irradiation in the presence of a strong magnetic field gradient to invert spin-locked 1H magnetization in the selected slice. Experimental results are reported, including effects of radio-frequency field inhomogeneity, variations in the amplitude of phase modulation, and shaped phase modulation.
Graphical Abstract
Introduction
Under conventional conditions, spatial resolution in magnetic resonance imaging (MRI) is limited by the relatively low sensitivity of inductively-detected nuclear magnetic resonance (NMR). An MRI image with isotropic resolution ρ requires detection of signals from a volume ρ3. If ρ is on the scale of microns, it becomes necessary to use radio-frequency (rf) coils with sub-millimeter dimensions for NMR signal detection, because the signal-to-noise ratio (SNR) for a fixed sample volume in a solenoid with volume V scales approximately as V−1/2. Paramagnetic doping to reduce recycle delays between scans and spin echo trains to increase the total signal from each scan also improve the net sensitivity. With these methods, 1H MRI images of liquid test samples with ρ ≈ 3 μm have been obtained at room temperature with total measurement times τtot in the 30–58 h range [1, 2].
In chapter III of his classic textbook on nuclear magnetism, Abragam derives an expression for the sensitivity of inductively-detected one-dimensional (1D) NMR, assuming an ideal solenoid, no noise contributions from other circuit elements, a single temperature for the solenoid and the sample, and nuclear spin polarization at thermal equilibrium [3]. According to Abragam’s expression, the ideal signal-to-noise ratio for the 1H NMR signal of a 5.0 μm3 volume of water in a solenoid with a volume of 3 X 10⁻³ μl is 0.053 after a single scan, assuming a 9.39 T magnetic field, 300 K temperature, a solenoid Q factor of 100, and a 10 Hz NMR linewidth. The signal-to-noise ratio is proportional to the nuclear spin polarization and inversely proportional to the square root of the solenoid temperature. The signal-to-noise ratio is also inversely proportional to the square root of the NMR linewidth. For example, a single scan at 10 K with thermal equilibrium polarization and a 10 kHz linewidth would yield an ideal signal-to-noise ratio of 0.28.
In principle, significant improvements in MRI resolution can be achieved at low temperatures, especially if dynamic nuclear polarization (DNP) is used to enhance NMR signals [4]. Low-temperature 1H MRI requires that homonuclear decoupling be employed during spatial encoding periods of the MRI pulse sequence, to overcome 1H-1H dipolar broadening that would otherwise make high-resolution MRI impossible with realistic magnetic field gradient strengths. In experiments at 9.39 T without DNP [5, 6], we have recently demonstrated three-dimensional (3D) MRI of glass beads in frozen glycerol/water at 28 K with ρ = 2.8 μm, using Dy3+ doping to reduce recycle delays to 0.5 s, Lee-Goldburg (LG) decoupling [7, 8] to attenuate 1H-1H dipole-dipole couplings, pulsed spin-locking (PSL) to maximize the total NMR signal per scan [9, 10], and a solenoidal rf coil with 150 μm inner diameter. For an image with ρ = 2.8 μm and SNR = 11 ± 1, τtot was 108 h.
Implementation of DNP in low-temperature MRI requires doping of frozen solutions with organic free radical compounds that produce large 1H nuclear hyperpolarization through the cross effect mechanism [11]. Such compounds typically produce relatively short nuclear spin T2 and T1ρ relaxation times [12, 13] because their intramolecular and intermolecular electron-electron couplings cause electron-electron flip-flop transitions, which in turn produce fluctuations in local magnetic fields at the nuclei (i.e., dipolar hyperfine field fluctuations). Short T2 and T1ρ relaxation times result in significant signal losses in spatial encoding periods and PSL periods of the MRI pulse sequence, potentially cancelling signal gains from DNP. In experiments on frozen glycerol/water solutions doped with the triradical compound DOTOPA, we have recently shown that these relaxation times become longer at temperatures below 10 K, where the electron spins are strongly polarized at equilibrium in 9.39 T and where electron-electron flip-flop transitions are consequently suppressed [13]. Thus, if DNP-enhanced MRI is performed near 5 K, images with ρ ≈ 1 μm become feasible from the standpoint of sensitivity.
MRI images with ρ ≈ 1 μm could in principle provide new information about the architecture of organelles and other compartments within individual biological cells, about the composition of phase-separated domains within cytoplasm or membranes, about the organization of different cell types within cell clusters (e.g., pancreatic islets), and about tissue microstructure. Of course, the information content of MRI images depends on contrast mechanisms. Contrast mechanisms in DNP-enhanced MRI images at low temperatures remain to be explored. Local differences in DNP enhancement factors, build-up times, and spin relaxation times may provide useful contrast, along with differences in 1H densities and nuclear double-resonance effects.
A technical problem that remains is the long build-up time for cross-effect DNP at low temperatures [13–15]. 1H NMR signal enhancements by factors of approximately 100 can be obtained (relative to signals at thermal equilibrium at 5 K), but with build-up times on the order of 30 s or longer. If the sample volume to be imaged (i.e., the field of view, FOV) contains Nv volume elements ρ3, then a fully sampled 3D image requires roughly 2Nv scans. An image with FOV = (50 μm)3 and ρ = 1.5 μm then requires about 74000 scans, corresponding to τtot ≈ 25 days if the image is fully sampled and if the recycle delay is set to the DNP build-up time. Extrapolating from results mentioned above, such an image would have SNR ~ 300.
Thus, spatial resolution in DNP-enhanced 1H MRI at very low temperatures is no longer limited by sensitivity. Instead, it is limited by the time required to record a data set from which an image with the desired resolution can be reconstructed. When the SNR is much higher than needed, this time can be reduced by using a recycle delay that is less than the DNP build-up time (sacrificing signal in each scan), by using sparse or non-uniform sampling (sacrificing generality of the object shapes within the image) [16, 17], or by reducing the FOV.
In conventional MRI, the FOV can be reduced by “slice selection”, i.e., by using magnetic field gradient pulses and frequency-selective rf waveforms to excite NMR signals from selected regions within the sample. In our low-temperature 1H MRI experiments, standard slice selection methods are not practical because 1H-1H dipolar broadening makes frequency-selective excitation by shaped RF pulses ineffective with realistic field gradients. In this paper, we describe and demonstrate a slice selection method that overcomes the problem of dipolar broadening. This method uses a combination of LG irradiation, for homonuclear decoupling, and rf phase modulation, to generate frequency-selective spin inversion when a field gradient is applied during the LG period. The work described below is motivated by our goal of obtaining DNP-enhanced, micron-scale MRI images with τtot < 24 h.
Experimental Methods
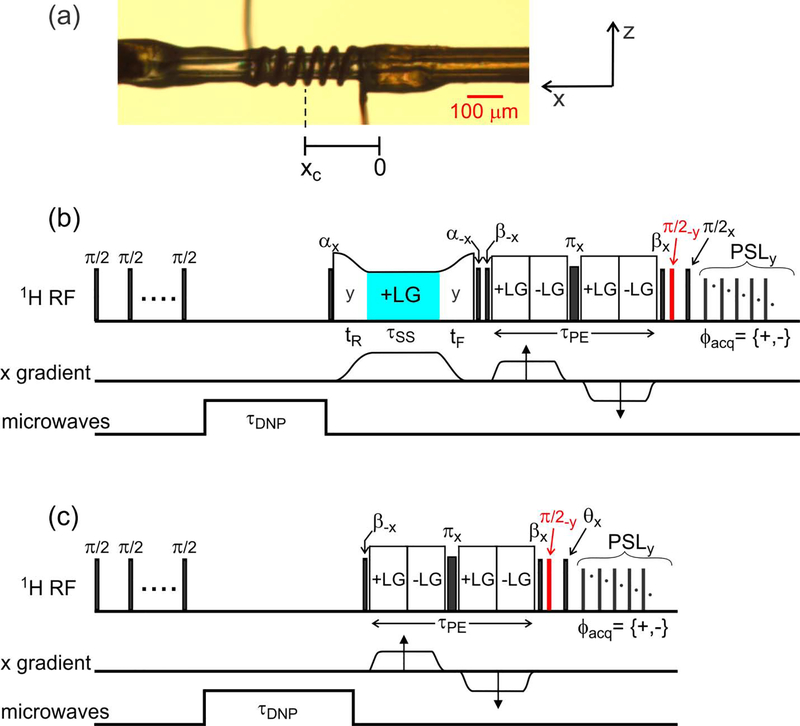
Experiments were performed at 30 K and 9.38 T, corresponding to a 1H NMR frequency of 399.2 MHz, using the cryostat and MRI apparatus described previously [5, 6, 13]. A Tecmag Redstone NMR spectrometer, a 50 W radio-frequency (RF) amplifier (AMT model 01525031), and AE Techron model 7548 gradient amplifiers were used. Although our MRI apparatus includes three orthogonal field gradient coils, only gradients in the x direction were used in experiments described below, corresponding to the direction of the long axis of the sample. Gradients produced by the x-gradient coil had amplitudes of 0.385 T/m-A. The sample, consisting of a d8-glycerol/D2O/H2O mixture (12:3:5 volume ratio) at pH 7.5 (40 mM phosphate buffer) with a 10 mM concentration of the triradical dopant succinyl-DOTOPA [18], was contained in a fused silica microcapillary with 106 μm outer diameter and 40 μm inner diameter. As shown in Fig. 1a, a solenoidal RF microcoil (6.5 turns, 300 μm length, 20–25 μm gaps between turns) was wound around the microcapillary (Molex, Inc.), using bare copper wire with 20 μm diameter (California Fine Wire Co.). For DNP, 30 mW of microwave power was supplied by a solid-state source (Virginia Diodes, Inc.), transmitted to a Teflon window at the bottom of the cryostat by a quasi-optical platform and corrugated waveguide (Thomas Keating, Ltd), and transmitted to the sample within the cryostat by a corrugated horn and tapered Teflon rod.
Figure 1:
(a) Photograph of the microcapillary that contains the sample in these experiments, with the RF microcoil wound around the microcapillary. The microcoil is displaced by xc ≈ 200 μm from the center of the x gradient coil. (b) Pulse sequence used to acquire 1D images with slice selection. After a train of π/2 pulses to destroy pre-existing 1H magnetization, magnetization is created by microwave irradiation for τDNP = 0.5 s. As described in the text, slice selection is carried out by RF phase modulation (on alternate scans) during a Lee-Goldburg (LG) irradiation period that is sandwiched between pulses with flip angles α = 125.3°. The phase modulation period is highlighted in cyan. Phase-encoded imaging occurs in period τPE, and 1H NMR signals are detected during pulsed spin-locking (PSL), consisting of a train of pulses with 60° flip angles. Imaginary parts of phase-encoded signals are detected by applying the π/2 pulse shown in red. (c) Pulse sequence for imaging the RF amplitude as a function of x. The flip angle θ and the x gradient amplitude during τPE are incremented independently to generate a 2D data set.
Slice selection was performed and demonstrated with the pulse sequence in Fig. 1b. This pulse sequence consists of four periods. In the first period, pre-existing 1H nuclear magnetization is destroyed by a train of nine π/2 pulses with 1.0 ms spacings. Microwave irradiation then generates 1H magnetization along the laboratory z direction during the DNP period τDNP. In the experiments described below, a τDNP value of 0.5 s was sufficient to generate strong 1H NMR signals, although the DNP build-up time was approximately 15 s. In the second period, which is the slice selection period, an on-resonance RF pulse with flip angle α = 125.3° aligns the 1H magnetization with an effective field created by an RF field with nominal amplitude ν1 (204.124 kHz in experiments described below) and resonance offset τSS, satisfying the LG condition . A gradient pulse with amplitude gx is then applied, with rise and fall times tR and tF and a central period τSS during which the gradient is constant. During τSS, the RF phase is modulated by ±ϕSS (relative to phase y) at frequency νSS. As explained below, this phase modulation inverts the 1H magnetization relative to the effective field in a spatially-selective manner. After the gradient pulse, 1H magnetization is returned to the z (or -z) direction by another RF pulse with flip angle α. In experiments described below, gx = 25 T/m, tR = tF = 50 μs, and νSS = 250.000 kHz.
The third and fourth periods in Fig. 1b are the imaging and 1H NMR signal detection periods. As described previously [5, 6], constant-time phase-encoded imaging is performed with frequency-switched LG irradiation [7, 8, 19] for homonuclear decoupling, with effective RF fields of 250 kHz and a phase-encoding period τPE. Real or imaginary parts of complex magnetization at the end of the τPE period are stored along z. 1H NMR signals are then detected with PSL after a π/2 pulse. Signals from the desired slice are selected by taking the difference between signals with and without RF phase modulation during τSS. In experiments described below, τPE = 420 μs. Gradients in the x direction during the first half of the τPE period were incremented from 4.6 T/m to 4.3 T/m in steps of 0.288 T/m, giving an FOV of 336.6 μm and a resolution of 10.5 μm. (Note that the reported gradient amplitudes do not include the scaling factor of that arises from LG irradiation.) RF pulses with flip angles of π, π/2, α, and β in Fig. 1b had amplitudes of 156 kHz. A total of two scans were acquired for each PSL free-induction decay, so that the total time to acquire a complete 1D slice image was only 64 s.
The center of our microcoil was displaced by xc ≈ 200 μm from the center of the x gradient. This displacement existed because the microcoil was wound around the sample, then soldered in place by hand. Small movements during the soldering process inevitably introduce small misalignments with the gradient coils. Therefore, gradient pulses shift the 1H NMR frequency at the center of the microcoil from its nominal value ν0 to , where γ is the 1H gyromagnetic ratio. To compensate for this large NMR frequency shift (up to about 40 kHz), LG offsets ±ΔPE during τPE were set relative to , rather than relative to ν0. Specifically, ±ΔPE = ±144.337 kHz + γgxxc/2π. With a nominal RF field amplitude of 204.124 kHz, this gives an effective LG field of 250.000 kHz in the yz plane of the rotating frame, at the magic angle relative to z, for 1H nuclei near the center of the microcoil. The FOV of the image is then centered at xc.
Similarly, the gradient pulse in the slice selection period produces large frequency shifts. Therefore, during τSS, the RF carrier offset ΔSS was set to 144.337 kHz + γgxxS/2π, where xS is the displacement of the desired slice from the center of the x gradient. In order to keep the effective field direction at the magic angle relative to z, the RF field amplitude was ramped down or up during tR and tF, according to the equation , where f(t) is the gradient waveform, normalized to its maximum value gx. The RF amplitude during τSS was 204.124 kHz.
As discussed below, RF inhomogeneity affects slice selection significantly. Therefore, the pulse sequence in Fig. 1c was used to obtain an RF nutation image, i.e., map the dependence of the RF amplitude on x. This pulse sequence is identical to the sequence in Fig. 1b, but without the slice selection period and with a pulse with variable length tp at the beginning of the signal detection period (instead of a π/2 pulse). The value of tp was incremented from 0.2 μs to 52.4 μs in steps of 0.6 μs. A total of two scans were acquired for each PSL free-induction decay, so that the total time to acquire a complete RF nutation image was 1.6 h.
Data were processed and plotted using our own scripts in Python with NumPy and Matplotlib packages (available on request from hsueh-ying.chen@nih.gov). For data acquired with the pulse sequence in Fig. 1b, free-induction decays (FIDs) under PSL were first Fourier transformed and phased as usual. Real parts of signals in the center of the resulting spectra (proportional to the areas of the FIDs for the real and imaginary parts of each value of gx) were extracted to produce complex 1D signals S(kx), with , including both positive and negative values of kx. After zero-filling to 64 points, complex Fourier transformation with respect to kx yielded 1D images as functions of x. For data acquired with the pulse sequence in Fig. 1c, the same procedure yielded complex 2D signals S(kx,tp). Real Fourier transformation with respect to tp (after zero-filling to 343 points) and complex Fourier transformation with respect to kx (after zero-filling to 64 points) yielded a 2D image as a function of x and the RF nutation frequency νnut.
Results and Discussion
RF inhomogeneity and microwave penetration
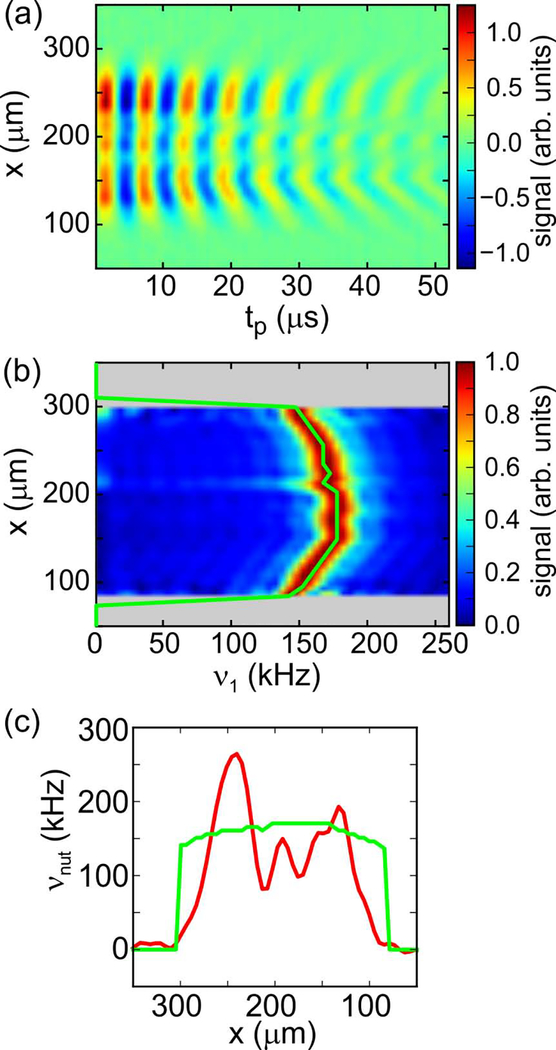
Fig. 2a shows data obtained with the pulse sequence in Fig. 1c after Fourier transformation with respect to kx to yield a series of 1D images as a function of the length tp of the RF pulse at the beginning of the PSL period (labeled θ in Fig. 1c). Fourier transformation with respect to tp yields the map of RF amplitude as a function of x in Fig. 2b. In this map, signals in each horizontal row (i.e., each value of x) were normalized to the maximum value in that row. According to Fig. 2b, the RF amplitude within the microcoil varied between 143 kHz and 178 kHz, as plotted in a green line.
Figure 2:
(a) Data obtained with the pulse sequence in Fig. 1c, after Fourier transformation with respect to the x gradient amplitude. Oscillations as a function of tp, which is the length of the θx pulse, indicate RF nutation frequencies at each value of x. (b) Same as panel a, but after Fourier transformation with respect to tp and scaling of each horizontal signal row to the maximum signal in the row. Rows without significant signals are set to zero (grey). The green curve follows the signal maxima as a function of x. (c) Superposition of the dependence of the RF amplitude ν1 on x (green curve, derived from panel b) on a low-temperature, DNP-enhanced 1D image of the same sample (red curve).
Fig. 2c superimposes the RF amplitude (green) on a 1D image (red) along the x axis. Variations in signal intensity as a function of x are attributable to variations in microwave penetration through the turns of the RF microcoil, as well as variations in RF amplitude. The RF amplitude affects the signal intensity because homonuclear decoupling by LG irradiation is less effective when the RF amplitude differs from its nominal value, leading to signal loss during the phase encoding period τPE. It is worth noting that the slice selection method described below allows us to focus on regions with the greatest signal intensity, if desired.
Slice selection conditions
During the τSS period in Fig. 1b, 1H magnetization is initially aligned with the effective field direction z’ in the usual rotating frame, which has a y-component equal to ν1(xS) and z-component equal to ΔSS − γgxxS/2π at position xS, where ΔSS is the offset of the RF carrier frequency from the 1H NMR frequency with zero gradient. The magnitude of this effective field is νeff (xS) = [(ΔSS −γgxxS/2π)2 +ν1(xS)2]1/2. A small sinusoidal RF phase modulation, with amplitude ϕSS and frequency νSS, produces an x-component equal to ν1(xS )sinϕSS cosνSSt. In a second rotating frame that rotates around z’ at frequency νSS, the effective field has a z’ component equal to νeff − νSS and a constant x-component equal to (ignoring a counter-rotating component, in analogy to the usual rotating frame transformation in magnetic resonance). If
| (1) |
and
| (2) |
then the 1H magnetization will rotate around x from +z’ to −z’ in this second rotating frame. Since z’ is the same in both rotating frames, the magnetization will also end up at -z’ in the usual rotating frame after phase modulation for period τSS. However, if | νeff (xS) − νSS |≫νx, the magnetization will remain close to +z’. The dependence of these conditions on xS allows for slice selection. In addition, to avoid magnetization decay due to 1H-1H dipole-dipole couplings during τSS, the usual LG condition should be satisfied:
| (3) |
which implies .
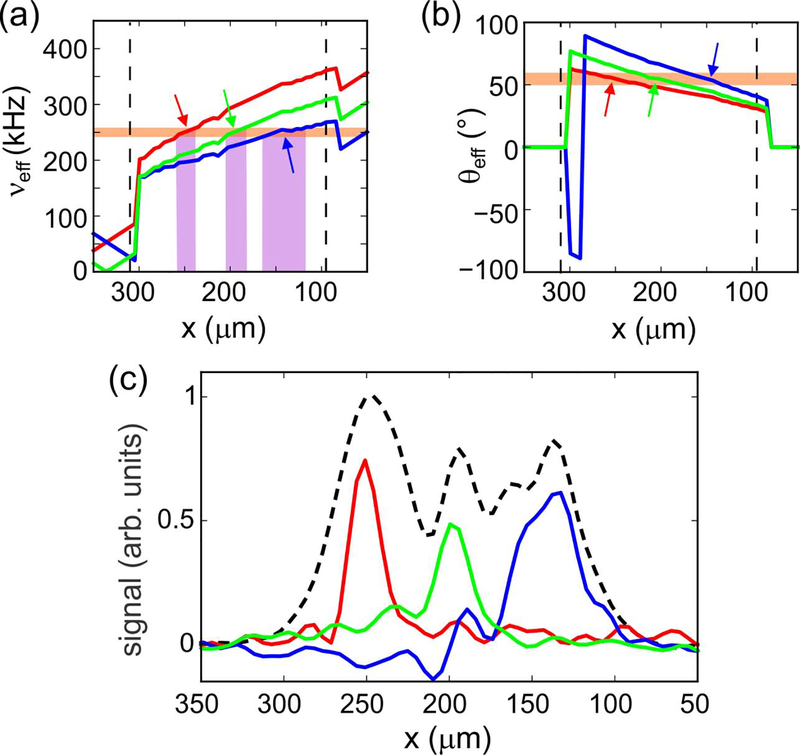
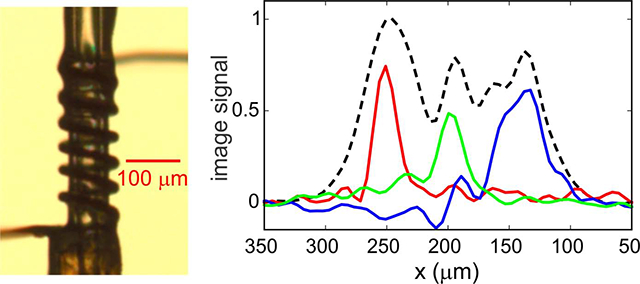
Data in Fig. 2c can be used to choose conditions that result in slice selection at a desired value of xS. For example, to select a region centered at 250 μm, the RF amplitude is increased by a factor of 1.24 relative to the value used in Fig. 2 in order to provide the necessary ν1 value of 204.124 kHz at xS = 250 μm with νSS = 250.000 kHz. In addition, given that a 25 T/m gradient is applied during τSS, corresponding to 1.064 kHz/μm for 1H nuclei, ΔSS is set to 410.337 kHz = 144.337 kHz + (250 × 1.064) kHz. Under this condition, as illustrated by the intersection of the red curves and orange strips in Figs. 3a and 3b, only 1H nuclei near xS = 250 μm experience an effective field during τSS that satisfies Eqs. (1–3). As a result, the magnetization associated with a slice centered at xS = 250 μm is inverted selectively with τSS = 60 μs and ϕSS = 3.5°, leading to the 1D image in red in Fig. 3c. (Although the analysis above predicts νx = 6.23 kHz if ϕSS = 3.5°, which would imply τSS = 80 μs, this value of ϕSS was determined empirically to optimize slice selection with τSS = 60 μs.)
Figure 3:
(a) Effective field amplitude during the τSS period in Fig. 1b as a function of x, calculated with the RF amplitude function from Fig. 2c and assuming a linear x gradient. Red, green, and blue curves correspond to conditions that give slice selection at xS ≈ 250 μm, 200 μm, and 150 μm, respectively, with RF phase modulation at νSS = 250 kHz. The horizontal orange band indicates a range of νeff values that determines the selected slice width. Predicted slice widths for the three conditions are indicated by vertical purple bands. (b) Dependence of the effective field angle, relative to z, on x for the three conditions in panel a. The horizontal orange band indicates a ±5° range of θeff values around the magic angle, within which homonuclear dipole-dipole couplings are attenuated by factors of at least 7.9. (c) Experimental 1D slice images, color coded to correspond to the conditions in panels a and b. The dashed black line is a 1D image without slice selection. All images are plotted on the same vertical scale.
Similarly, by adjusting the RF amplitude to account for the RF inhomogeneity profile in Fig. 2c and adjusting ΔSS to satisfy the conditions given above, slices can be selected at xS = 200 μm and xS = 150 μm, as indicated by green and blue curves in Fig. 3, respectively. Interestingly, the slice width around xS = 150 μm in Fig. 3c is greater than around the other two positions. This observation is consistent with plots in Fig. 3a, which show that a larger range of x values have νeff ≈ νSS when xS = 150 μm, due in part to the curvature of the dependence of RF field amplitude on x shown in Fig. 2c.
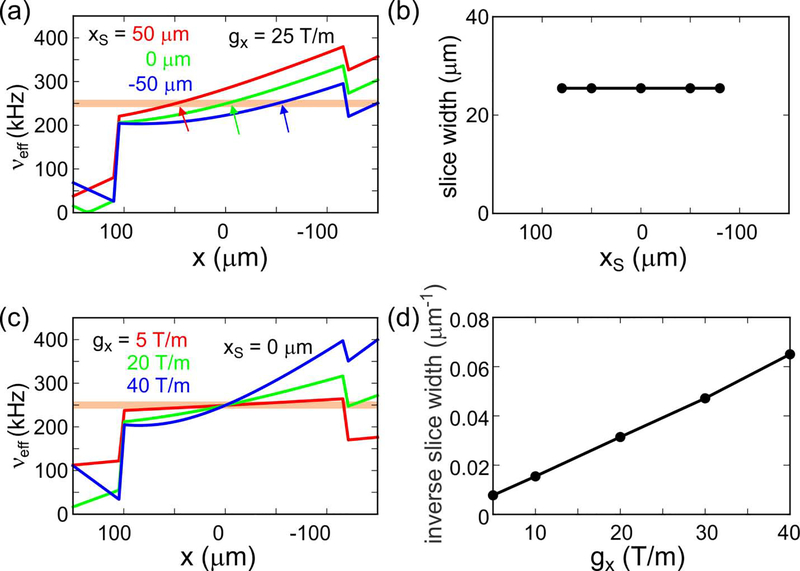
Fig. 4 shows results from calculations that provide insight into factors that affect the width of selected slices. In Fig. 4a, the gradient is assumed to be 25 T/m. The dependence of νeff on x is plotted for values of τSS that select slices at xS = 50 μm, 0 μm, and −50 μm, assuming perfect RF homogeneity. In Fig. 4b, the dependence of the resulting slice width, defined by the range of x for which νeff = 250.0 ± 8.3 kHz, is plotted as a function of xS. In this case, the slice width is nearly independent of xS, indicating that variations in slice width in Fig. 3 are primarily due to RF inhomogeneity. Fig. 4c shows the dependence of νeff on x for several different gradient strengths, all with xS = 0 μm. As shown in Fig. 4d, the calculated slice width is approximately inversely proportional to the gradient strength.
Figure 4:
(a) Calculated dependences of the effective field amplitude during the τSS period on x, assuming an x gradient amplitude of 25 T/m and a constant RF field amplitude within −100 μm < x < 100 μm. The RF amplitude is assumed to be zero outside this interval. Red, green, and blue curves correspond to conditions that would be used for slice selection at xS ≈ 50 μm, 0 μm, and −50 μm, respectively. The horizontal orange band indicates a range of νeff values that determines the slice width. (b) Dependence of the calculated slice width on xS, from calculations shown in panel a. (c) Calculated dependences of the effective field amplitude during the τSS period on x for conditions that would be used for slice selection at xS = 0 μm. Red, green, and blue curves correspond to gradient amplitudes of 5 T/m, 20 T/m, and 40 T/m, respectively. (d) Dependence of the inverse of the slice width on the gradient amplitude, from calculations shown in panel c.
Effect of shaped phase modulation
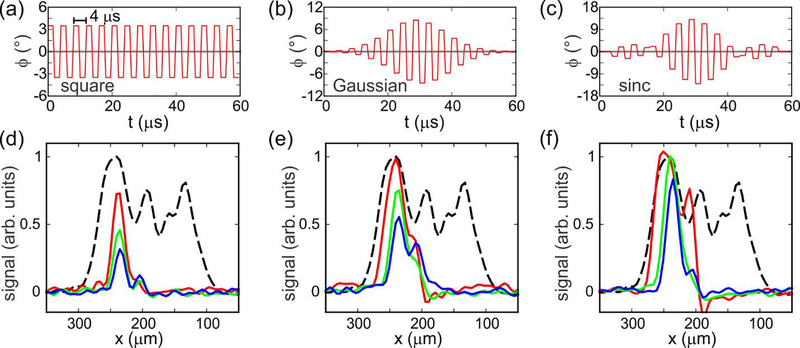
In conventional MRI, slice selection is usually performed with shaped pulses, rather than square pulses. In our experiments, shaping of the RF phase modulation is analogous to shaping of the RF amplitude in conventional MRI, since the effective π pulse amplitude in the second rotating frame described above is approximately , with constant ν1 but possibly with variable ϕSS. Fig. 5 explores how the shape of the phase modulation affects the slice selection. In Fig. 5a, ϕSS is constant over the length of the selective π pulse. In Figs. 5b and 5c, ϕSS varies during the selective π pulse according to a truncated Gaussian function (truncation level = 1%) or a sinc function (truncated to its central positive lobe and two adjacent negative lobes).
Figure 5:
Effects of shaped phase modulation on slice selection. (a-c) Plots of the RF phase (relative to y) as a function of time during the slice selection period τSS for square, truncated Gaussian, and truncated sinc shapes, respectively. In these plots, τSS = 60 μs. (d-f) Experimental 1D slice images obtained with square, truncated Gaussian, and truncated sinc shapes, respectively. Red, green, and blue curves correspond to τSS = 60 μs, 120 μs, and 180 μs, respectively. Dashed black curves are 1D images without slice selection. All images are plotted on the same vertical scale.
Figs. 5d, 5e, and 5f show experimental results for slice selection with the shapes shown in Figs. 5a, 5b, and 5c, respectively. Values of τSS were 60 μs, 120 μs, or 180 μs (red, green, and blue curves, respectively). Phase modulation amplitudes (i.e., maximum values of ϕSS) were adjusted empirically to maximize the signal amplitudes in the selected slices. For τSS = 60 μs, the phase modulation amplitudes in Figs. 5d, 5e, and 5f are 3.5°, 8.5°, and 13.0°. For τSS = 120 μs and 180 μs, the phase modulation amplitudes were smaller by factors of 2.0 and 3.0. As τSS increases, the experimentally observed slices become narrower, as expected because the condition νx≫ |νeff − νSS| is satisfied over a narrower range of x. Maximum signal amplitudes also decrease as τSS increases, in part due to greater dephasing of the selected 1H magnetization during the longer inversion process. Based on the experimental results in Fig. 5, sinc-shaped modulation with τSS = 120 −180 μs appears to give the best performance, producing slices with widths of approximately 50 μm without introducing large signal losses within the selected slice.
Comparisons with alternative slice selection methods
The problem of slice selection in MRI of solids has also been addressed in earlier work by others. Cory et al. demonstrated an approach that involves a combination of multiple-pulse homonuclear decoupling and pulsed field gradients, designed to produce an alternation between a gradient-dependent rotation of spin angular momentum about one axis and a small gradient-independent rotation about an orthogonal axis [20]. The net effect is then to produce a rotation that depends sensitively on position, in analogy to the manner in which a DANTE pulse train produces a net rotation that depends sensitively on NMR frequency in the absence of gradients [21]. Matsui demonstrated an approach in which a train of strong off-resonance RF pulses is applied in the presence of a gradient, so that the effective RF field direction is inclined at the magic angle to z only within the desired slice [22]. Nuclear magnetization outside the desired slice is then dephased more strongly by homonuclear dipole-dipole couplings. Matsui et al. [23] also demonstrated an approach in which DANTE-like RF pulses and gradient pulses are inserted between “magic-echo” pulse blocks [24, 25]. This approach is related to earlier work by Caravatti et al. [26]
While these previously-proposed approaches to slice selection in MRI of solids may be useful in certain applications, the approach described above, based on RF phase modulation during LG irradiation, has at least two important advantages. First, gradient switching need not be extremely rapid. Rise and fall times in the 50–100 μs range are acceptable because the 1H magnetization is spin-locked to the LG effective field during gradient switching. Second, LG irradiation produces efficient homonuclear decoupling, especially with the large effective fields that are easily achieved with RF microcoils, and is readily implemented and optimized. It should also be noted that alternative approaches to slice selection and to solid state MRI have not achieved spatial resolution comparable to the resolution of the experiments reported above and in our previous publications [5, 6].
Conclusions
Results presented above demonstrate a useful method for slice selection in 1H MRI of solids, with particular relevance to our own efforts to achieve higher spatial resolution by performing MRI at low temperatures and with DNP. Under the conditions of the experiments presented above, the FOV of a 3D image can be reduced by a factor of approximately six, allowing the image (within the selected slice) to be acquired in one sixth of the time that would otherwise be required. This is an important time reduction when DNP produces large signal enhancements, so that signal detection sensitivity is no longer the factor that determines the required measurement time. Generalization to slice selection in two or three dimensions would involve extending the τSS period in Fig. 1b and applying two or three phase modulation periods, with gradients in two or three orthogonal directions.
In experiments presented above, the sample is limited in y and z directions by the fact that it is contained within a microcapillary. For a more general sample shape, it may be helpful to reduce the FOV further by selecting slices in two or three orthogonal directions. This can be readily achieved by including two or three slice selection periods in the pulse sequence, with gradients in orthogonal directions during the slice selection periods.
Highlights.
Phase modulation during Lee-Goldburg spin-locking produces slice selection in MRI of solids
Slice selection reduces imaged volume, accelerating image acquisition under low-temperature DNP
Slice width varies with modulation amplitude and modulation shape
Slices widths of 50 microns or less can be achieved
Acknowledgements
This work was supported by the Intramural Research Program of the National Institute of Diabetes and Digestive and Kidney Diseases, National Institutes of Health.
Footnotes
Declaration of interests
☒ The authors declare that they have no known competing financial interests or personal relationships that could have appeared to influence the work reported in this paper.
Publisher's Disclaimer: This is a PDF file of an unedited manuscript that has been accepted for publication. As a service to our customers we are providing this early version of the manuscript. The manuscript will undergo copyediting, typesetting, and review of the resulting proof before it is published in its final form. Please note that during the production process errors may be discovered which could affect the content, and all legal disclaimers that apply to the journal pertain.
References
- [1].Weiger M, Schmidig D, Denoth S, Massin C, Vincent F, Schenkel M, Fey M, NMR microscopy with isotropic resolution of 3.0 μm using dedicated hardware and optimized methods, Concepts Magn. Reson. Part B, 33B (2008) 84–93. [Google Scholar]
- [2].Ciobanu L, Seeber DA, Pennington CH, 3D MR microscopy with resolution 3.7 μm by 3.3 μm by 3.3 μm, J. Magn. Reson, 158 (2002) 178–182. [DOI] [PubMed] [Google Scholar]
- [3].Abragam A, Principles of nuclear magnetism, Oxford University Press, Inc., New York, 1961. [Google Scholar]
- [4].Thurber KR, Tycko R, Prospects for sub-micron solid state nuclear magnetic resonance imaging with low-temperature dynamic nuclear polarization, Phys. Chem. Chem. Phys, 12 (2010) 5779–5785. [DOI] [PMC free article] [PubMed] [Google Scholar]
- [5].Moore E, Tycko R, Micron-scale magnetic resonance imaging of both liquids and solids, J. Magn. Reson, 260 (2015) 1–9. [DOI] [PMC free article] [PubMed] [Google Scholar]
- [6].Chen HY, Tycko R, Low-temperature magnetic resonance imaging with 2.8 μm isotropic resolution, J. Magn. Reson, 287 (2018) 47–55. [DOI] [PMC free article] [PubMed] [Google Scholar]
- [7].Lee M, Goldburg WI, Nuclear magnetic resonance line narrowing by a rotating rf field, Phys. Rev, 140 (1965) 1261–1271. [Google Scholar]
- [8].Redfield AG, Nuclear magnetic resonance saturation and rotary saturation in solids, Phys. Rev, 98 (1955) 1787–1809. [Google Scholar]
- [9].Ostroff ED, Waugh JS, Multiple spin echoes and spin locking in solids, Phys. Rev. Lett, 16 (1966) 1097–1098. [Google Scholar]
- [10].Petkova AT, Tycko R, Sensitivity enhancement in structural measurements by solid state NMR through pulsed spin locking, J. Magn. Reson, 155 (2002) 293–299. [DOI] [PubMed] [Google Scholar]
- [11].Hu KN, Yu HH, Swager TM, Griffin RG, Dynamic nuclear polarization with biradicals, J. Am. Chem. Soc, 126 (2004) 10844–10845. [DOI] [PubMed] [Google Scholar]
- [12].Potapov A, Thurber KR, Yau WM, Tycko R, Dynamic nuclear polarization-enhanced 1H-13C double resonance NMR in static samples below 20 K, J. Magn. Reson, 221 (2012) 32–40. [DOI] [PMC free article] [PubMed] [Google Scholar]
- [13].Chen HY, Tycko R, Temperature-dependent nuclear spin relaxation due to paramagnetic dopants below 30 K: Relevance to DNP-enhanced magnetic resonance imaging, J. Phys. Chem. B, 122 (2018) 11731–11742. [DOI] [PMC free article] [PubMed] [Google Scholar]
- [14].Thurber KR, Yau WM, Tycko R, Low-temperature dynamic nuclear polarization at 9.4 T with a 30 mW microwave source, J. Magn. Reson, 204 (2010) 303–313. [DOI] [PMC free article] [PubMed] [Google Scholar]
- [15].Siaw TA, Fehr M, Lund A, Latimer A, Walker SA, Edwards DT, Han SI, Effect of electron spin dynamics on solid-state dynamic nuclear polarization performance, Phys. Chem. Chem. Phys, 16 (2014) 18694–18706. [DOI] [PubMed] [Google Scholar]
- [16].Lustig M, Donoho D, Pauly JM, Sparse MRI: The application of compressed sensing for rapid MR imaging, Magn. Reson. Med, 58 (2007) 1182–1195. [DOI] [PubMed] [Google Scholar]
- [17].Hyberts SG, Milbradt AG, Wagner AB, Arthanari H, Wagner G, Application of iterative soft thresholding for fast reconstruction of NMR data non-uniformly sampled with multidimensional Poisson gap scheduling, J. Biomol. NMR, 52 (2012) 315–327. [DOI] [PMC free article] [PubMed] [Google Scholar]
- [18].Yau WM, Jeon J, Tycko R, Succinyl-DOTOPA: An effective triradical dopant for low-temperature dynamic nuclear polarization with high solubility in aqueous solvent mixtures at neutral pH, J. Magn. Reson., under review (2019). [DOI] [PMC free article] [PubMed] [Google Scholar]
- [19].Bielecki A, Kolbert AC, Levitt MH, Frequency-switched pulse sequences: Homonuclear decoupling and dilute spin NMR in solids, Chem. Phys. Lett, 155 (1989) 341–346. [Google Scholar]
- [20].Cory DG, Miller JB, Garroway AN, DANTE slice selection for solid-state NMR imaging, J. Magn. Reson, 90 (1990) 544–550. [Google Scholar]
- [21].Bodenhausen G, Freeman R, Morris GA, Simple pulse sequence for selective excitation in Fourier-transform NMR, J. Magn. Reson, 23 (1976) 171–175. [Google Scholar]
- [22].Matsui S, Spatially selective excitation in solid-state NMR by off-resonance spin tipping, J. Magn. Reson, 97 (1992) 335–341. [Google Scholar]
- [23].Matsui S, Masumoto H, Hashimoto T, Tailored slice selection in solid-state MRI by DANTE under magic-echo line narrowing, J. Magn. Reson, 186 (2007) 238–242. [DOI] [PubMed] [Google Scholar]
- [24].Takegoshi K, McDowell CA, A magic echo pulse sequence for the high-resolution NMR spectra of abundant spins in solids, Chem Phys Lett, 116 (1985) 100–104. [Google Scholar]
- [25].Rhim WK, Pines A, Waugh JS, Time-reversal experiments in dipolar-coupled spin systems, Phys. Rev. B, 3 (1971) 684–696. [Google Scholar]
- [26].Caravatti P, Levitt MH, Ernst RR, Selective excitation in solid-state NMR in the presence of multiple-pulse line narrowing, J. Magn. Reson, 68 (1986) 323–334. [Google Scholar]


