

Summary
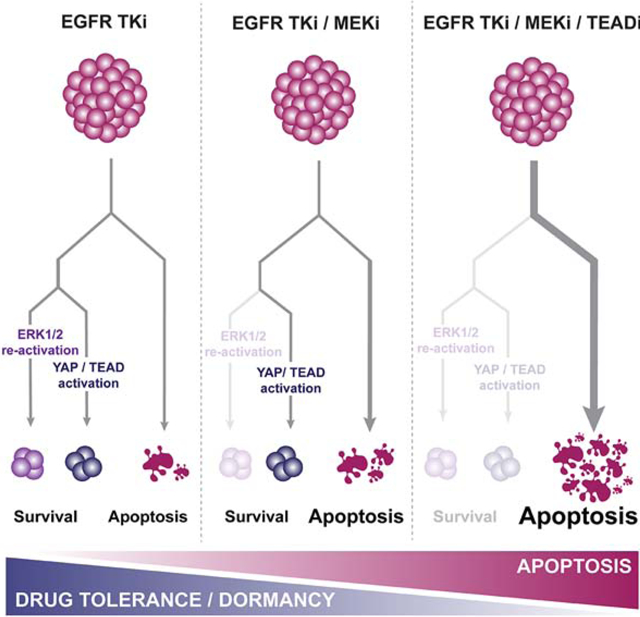
Eradicating tumor dormancy that develops following epidermal growth factor receptor (EGFR) tyrosine kinase inhibitor (TKI) treatment of EGFR-mutant non-small cell lung cancer (NSCLC), is an attractive therapeutic strategy but the mechanisms governing this process are poorly understood. Blockade of ERK1/2 reactivation following EGFR TKI treatment by combined EGFR/MEK inhibition uncovers cells that survive by entering a senescence-like dormant state characterized by high YAP/TEAD activity. YAP/TEAD engage the epithelial-to-mesenchymal transition (EMT) transcription factor SLUG to directly repress pro-apoptotic BMF, limiting drug-induced apoptosis. Pharmacological co-inhibition of YAP and TEAD, or genetic deletion of YAP1, all deplete dormant cells by enhancing EGFR/MEK inhibition-induced apoptosis. Enhancing the initial efficacy of targeted therapies could ultimately lead to prolonged treatment responses in cancer patients.
Keywords: Epidermal growth factor receptor, lung cancer, drug resistance, drug tolerance
Graphical Abstract
In-brief
Kurppa et al. show that YAP activation mediates resistance to combined EGFR/MEK inhibition by inducing dormancy in non-small cell lung cancer cells. Targeting the YAP pathway, in part by using a newly developed covalent TEAD inhibitor, promotes apoptosis of the dormant therapy-resistant cancer cells.
Introduction
Epidermal growth factor receptor (EGFR) tyrosine kinase inhibitors (TKIs) are the standard of care for patients with advanced EGFR mutant non-small cell lung cancer (NSCLC) (Mok et al., 2009; Rosell et al., 2012; Soria et al., 2018). However, acquired resistance inevitably develops, limiting clinical efficacy (Cortot and Jänne, 2014). In most cases, resistance arises after a dramatic initial response followed by a stable minimal residual disease (MRD), or dormant, state, with subsequent gradual growth of a drug resistant tumor. Prior preclinical studies suggest that following EGFR TKI treatment, EGFR-mutant tumor cells can enter a drug tolerant state, reminiscent of dormancy in patients, allowing cells to evade apoptosis and survive (Hata et al., 2016; Sharma et al., 2010). Over time, the drug tolerant cells can acquire resistance through mutational or non-mutational mechanisms (Hata et al., 2016). While the establishment of this state seems to be largely stochastic and dictated mostly by epigenetic mechanisms (Guler et al., 2017; Sharma et al., 2010), the mechanistic bases of how cancer cells evade the initial apoptosis in response to drug treatment – the absolute requirement to enter the drug tolerant state – or maintain tolerance in the presence of drug, are poorly understood.
Our previous work demonstrated that despite sustained EGFR inhibition following EGFR TKI treatment, reactivation of ERK1/2 occurs within just a few days (Ercan et al., 2012; Tricker et al., 2015). Concomitant inhibition of MEK effectively prevents reactivation of ERK1/2, results in a greater initial apoptotic response, and leads to a more durable tumor control in vitro and in vivo than single agent EGFR inhibition (Ercan et al., 2012; Tricker et al., 2015). The EGFR (osimertinib) and MEK (selumetinib) inhibitor combination has been studied in patients resistant to prior EGFR TKIs and is also under evaluation as initial therapy for advanced EGFR-mutant NSCLC in a phase II clinical trial (NCT03392246; Ramalingam et al., 2019). However, even with this combination, acquired resistance can still develop (Tricker et al., 2015). In the current study we set out to elucidate the mechanisms that allow cancer cells to evade apoptosis and survive despite combined EGFR/MEK inhibition.
Results
Combined EGFR and MEK inhibition results in a stable, but reversible dormant state.
Combined EGFR/MEK inhibition prevents the re-activation of ERK1/2 following EGFR inhibition and delays the onset of drug resistance in vitro and in vivo (Tricker et al., 2015) (Figure S1A). In PC-9 cells, treatment with single-agent osimertinib (O) leads to re-colonization of wells within 8 weeks (Figure. 1A). The combination of O and the MEK inhibitor trametinib (T) prevents any measurable regrowth (Figure 1A). However, few viable cells can still be detected after 15 weeks of treatment (Figure 1B). We used live cell imaging and observed that the OT treated cells surviving the initial apoptosis remained in a largely non-proliferative, or dormant, state throughout the treatment period. However, within days following drug withdrawal the cells began to proliferate and re-colonize the wells (Figure 1C, Movie S1). This phenomenon was consistent across EGFR mutant NSCLC cell lines (Figure 1C and Figure S1B). These observations suggest that while combined EGFR/MEK inhibition eliminates cells in which re-activation of ERK signaling occurs following single-agent EGFR inhibition, a separate population enters a dormant state, surviving combined EGFR/MEK inhibition. There was no evidence of re-activation of EGFR and/or ERK signaling in the dormant cells during treatment (Figure 1D) and EGFR signaling was restored in cells that grew following drug washout (Figure 1D). These cells were still sensitive to OT, and morphologically indistinguishable from the untreated cells (Figure S1C) suggesting that we did not select out a subclone with a pre-existing resistance mutation (Hata et al., 2016). To formally address whether the establishment of dormancy following OT treatment is pre-determined or a stochastic process, we barcoded PC-9 cells using the EvoSeq library (Feldman et al., 2019), treated the cells with DMSO, gefitinib (G), O or OT for 3 weeks, sequenced DNA from the remaining cells and analyzed the findings as described (Bhang et al., 2015) with some modifications. We observed a large fraction of shared barcodes within the G (data not shown) and O (Figure 1E, F, Figure S2A) treated cells, strongly suggesting selection of pre-existing clones, consistent (for G) with prior studies (Hata et al., 2016). In contrast, the vast majority of barcodes in the OT -treated cells were unique (Figure 1E, F, Figure S2A). Comparison of the shared barcodes between O and OT cells demonstrated that 89% of the barcodes identified in the O group are not present in the OT group (Figure S2B). These findings suggest that while resistance to O likely occurs through a selection process of a pre-existing clone, the ability of cells to enter dormancy following OT is predominately driven by a stochastic process.
Figure 1. Combined EGFR/MEK inhibition promotes a senescence-like dormant state.
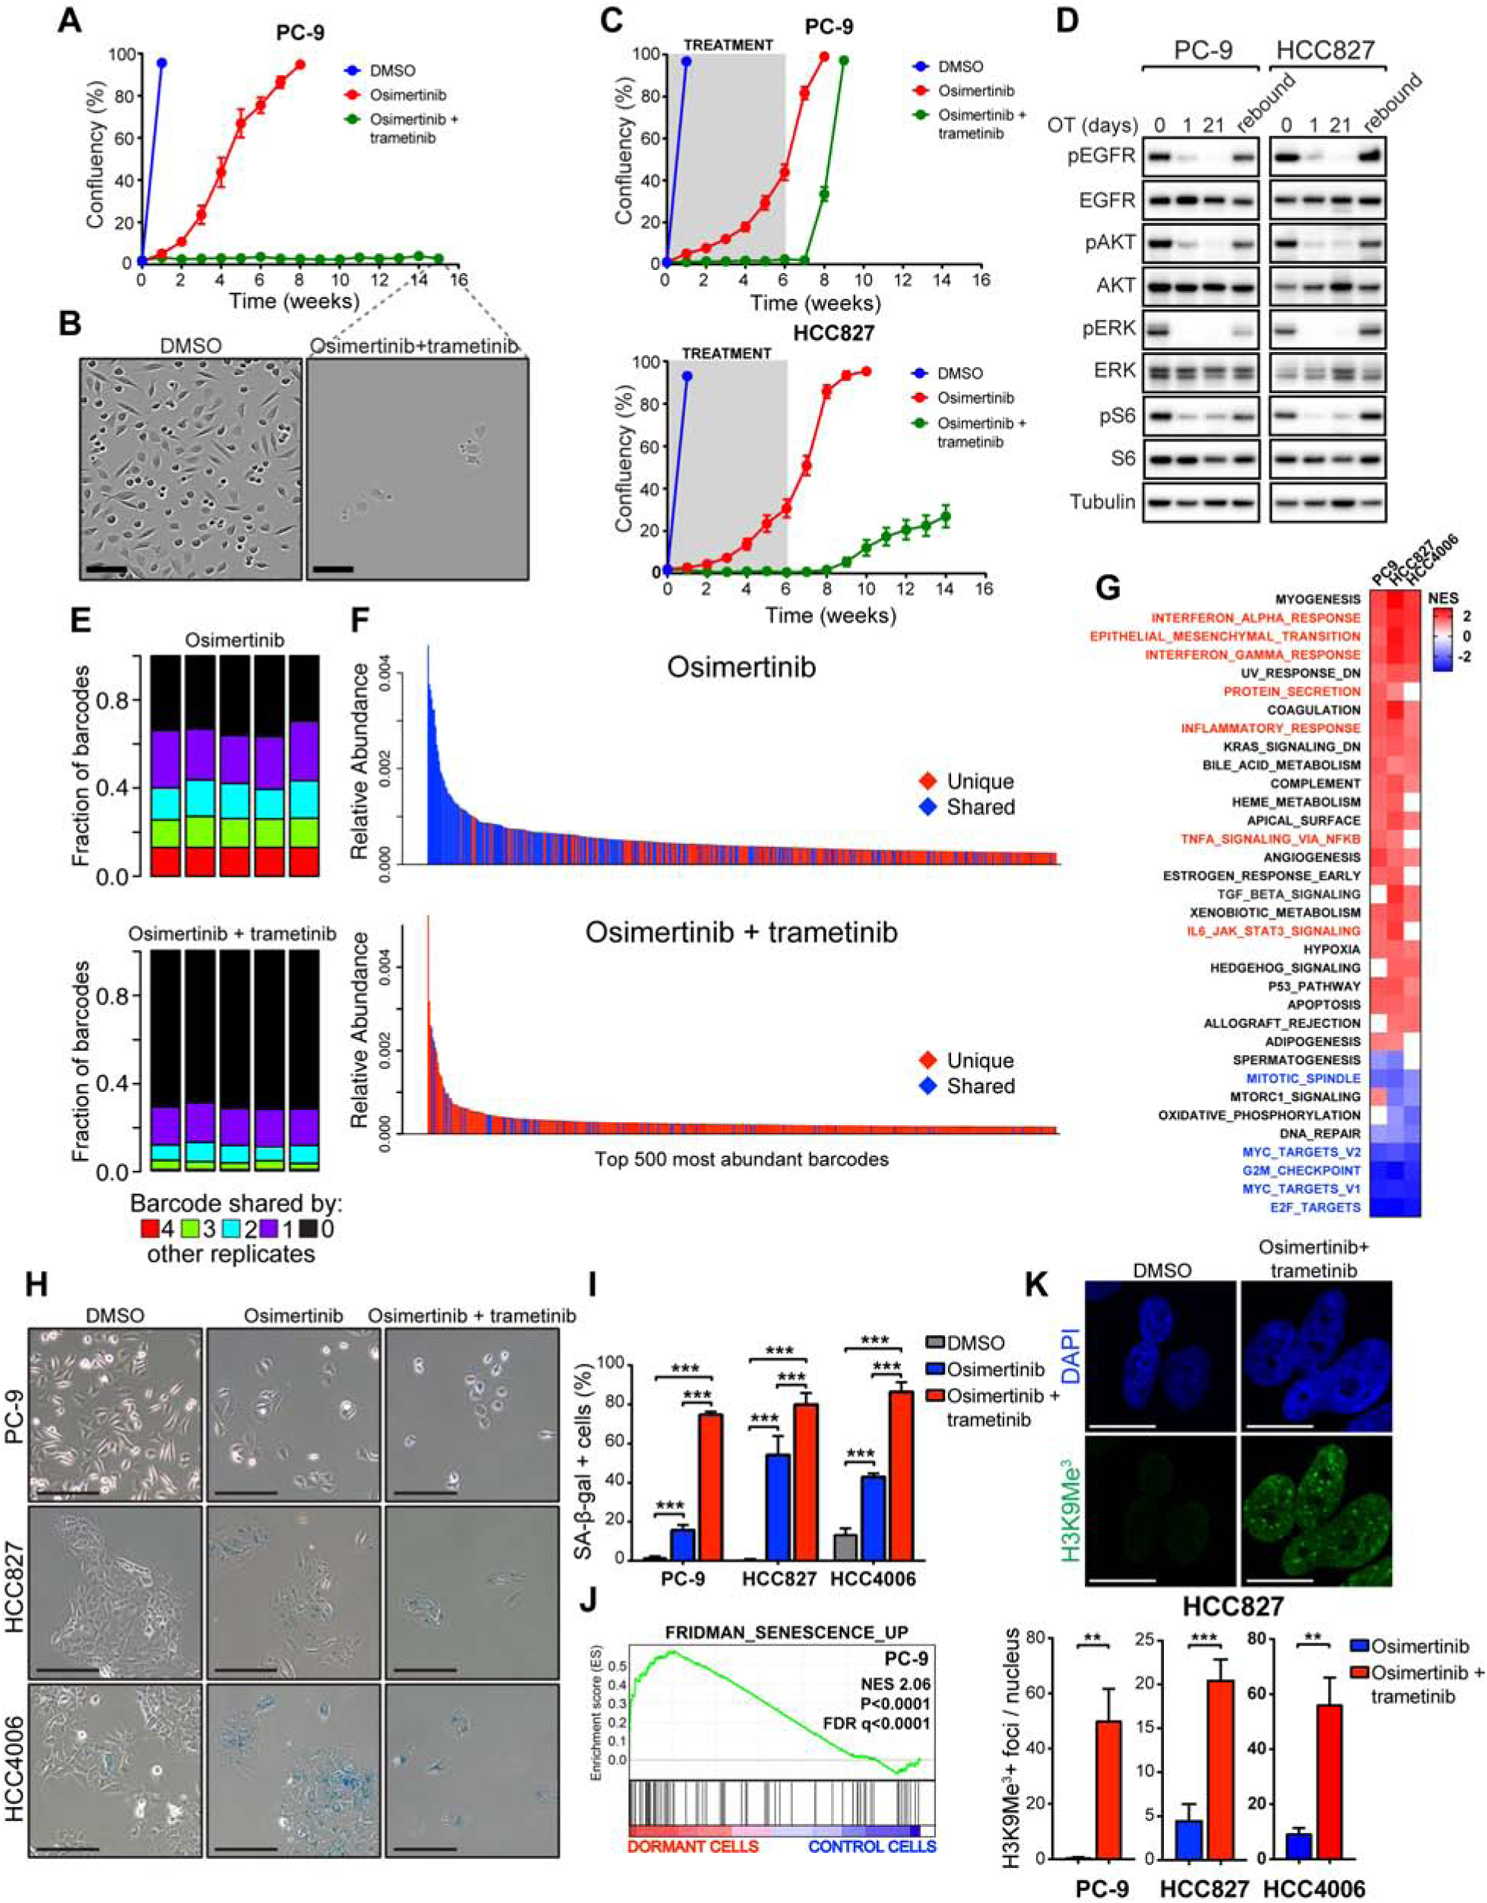
(A) Proliferation of PC-9 cells treated with DMSO, 100 nM osimertinib (O) alone or in combination with 30 nM trametinib (T). (B) Images of control cells (at 1 week) or dormant PC-9 cells (at 15 weeks). Scale bar, 200 μm. (C) Cells were treated as in (A) for 6 weeks followed by drug washout. D) Western blot analysis of EGFR downstream signaling following treatment with OT for indicated times or 21 days followed by drug washout (rebound). E) Fraction of barcodes shared among replicates following indicated treatments in barcoded PC-9 cells F) Relative abundance of individual barcodes. Shared and unique indicate barcodes shared by >2 or ≤2 replicates, respectively. (G) GSEA of Hallmark gene sets comparing dormant cells vs. DMSO-treated control cells. Normalized Enrichment Scores (NES) for gene sets with FDR<0.1 in at least two cell lines are shown. (H) Senescence-associated β-galactosidase (SA-β-gal) staining of cells treated as indicated for 10 days. Scale bar, 100 μm. (I) Quantification of (H). (J) GSEA of senescence signature comparing dormant, OT-treated PC-9 cells vs. control cells. (K) Immunofluorescence (IF) staining for H3K9Me3 in control cells or dormant cells treated with OT for 10 days. Scale bar, 20 μm. Mean ± SEM are shown in all plots except (I) where mean ± SD are shown. ANOVA (I) or t-test (K) were used for statistical analyses. ***, P<0.001; **, P<0.01. See also Figure S1, S2, and S3.
Dormant state following EGFR/MEK inhibition shares characteristics with cellular senescence
To characterize the dormant state, we performed RNA-sequencing (RNA-seq) in PC-9, HCC827, and HCC4006 cells following treatment with either DMSO or with OT for two weeks. Gene set enrichment analysis (GSEA) revealed an up-regulation of gene expression signatures involved in inflammatory response, epithelial-to-mesenchymal transition (EMT) and protein secretion while cell cycle-associated gene expression signatures were robustly down-regulated (Figure 1G). These findings along with the spread-out, flattened morphology of the dormant cells (Figure 1B) prompted us to query similarities between the dormant state and cellular senescence. We stained DMSO, O or OT-treated PC-9, HCC827 and HCC4006 cells for senescence-associated β-galactosidase activity (SA-β-Gal) (Debacq-Chainiaux et al., 2009), and noted that for all 3 cell lines, the majority of cells surviving the combination treatment stained positive for SA-β-Gal (Figure 1H, I). Further GSEA revealed a significant enrichment of a senescence-associated gene expression signature (Fridman and Tainsky, 2008) in the dormant cells (Figure 1J, Figure S3A). A significantly smaller proportion of O-treated cells demonstrated SA-β-Gal activity compared to those treated with the OT combination (Figure 1H, I). Senescent cells characteristically exhibit increased secretion of pro-inflammatory factors (senescence-associated secretory phenotype, SASP) (Coppé et al., 2010). By analyzing conditioned medium from dormant cells, we observed an increased secretion of several cytokines and chemokines, including the prominent SASP factor IL-6, compared to untreated cells (Figure S3B). The expression of several classical SASP factors (Coppé et al., 2008) in the cytokine, chemokine, IGFBP and MMP families was also upregulated in the dormant cells (Figure S3C), analogous to SASP.
Using immunofluorescence (IF) following a 10 day treatment with OT, we detected a robust increase in punctate, H3K9Me3-positive nuclear foci, another hallmark of senescence (Narita et al., 2003) (Figure 1K). Senescence is also invariably associated with the induction of p16INK4a, p21Cip1 and/or p27Kip (Campisi and D’Adda Di Fagagna, 2007). Although p16INK4a or p21Cip1 were not consistently induced, we observed a robust induction of p27Kip which was subsequently downregulated in growing cells following drug withdrawal (Figure S3D).
The establishment of dormancy following EGFR/MEK inhibition is critically dependent on activation of YAP/TEAD
To explore potential epigenetic changes in the dormant cells, we employed an assay for transposase-accessible chromatin combined with next-generation sequencing (ATAC-seq). We observed a significant difference in the global epigenetic states between the OT-induced dormant vs. DMSO-treated cells (Figure 2A), which reverted upon drug washout, demonstrating that the changes acquired at dormancy are reversible (Figure 2A). There was also a significant difference in epigenetic states between single-agent O and OT –induced dormant cells (Figure 2A). We performed a motif analysis to interrogate transcription factor binding sites associated with the ATAC-seq peaks with higher signal (more accessible chromatin) in OT –induced dormant cells vs. control cells (Figure 2B). The 3 most significantly enriched motifs were the consensus sites for TEAD family transcription factors (Figure 2C), suggesting that the OT –induced epigenetic state is associated with increased TEAD transcription factor binding. The TEAD transcription factors serve as canonical partners for the Hippo pathway effector YAP, which has been associated with resistance to targeted therapy in several contexts, including in resistance to EGFR TKIs in EGFR-mutant NSCLC (Chaib et al., 2017; Hsu et al., 2016). Indeed, we observed a significant enrichment of a YAP/TEAD gene expression signature (Zhang et al., 2009) in dormant EGFR-mutant cells (Figure 2D). TEAD binding motifs also scored as the most significant top hits separating the OT, and O treatment induced states (Figure 2E). In accordance with these findings, we observed significantly higher YAP/TEAD activity, as measured by CTGF and ANKRD1 expression, in OT-induced dormant PC-9 cells compared to O-treated cells (Figure 2F). Consistently, we also detected increased chromatin accessibility at putative distal enhancer sites upstream of CTGF TSS in OT-induced dormant cells compared to cells treated with O alone (Figure S4A). Taken together, these results demonstrate that dormant cells induced by combined EGFR/MEK inhibition adopt a distinct, reversible epigenetic state distinguished from the untreated or the O-treated state by increased YAP/TEAD activity.
Figure 2. The establishment of dormancy following EGFR/MEK inhibition is critically dependent on activation of YAP/TEAD.
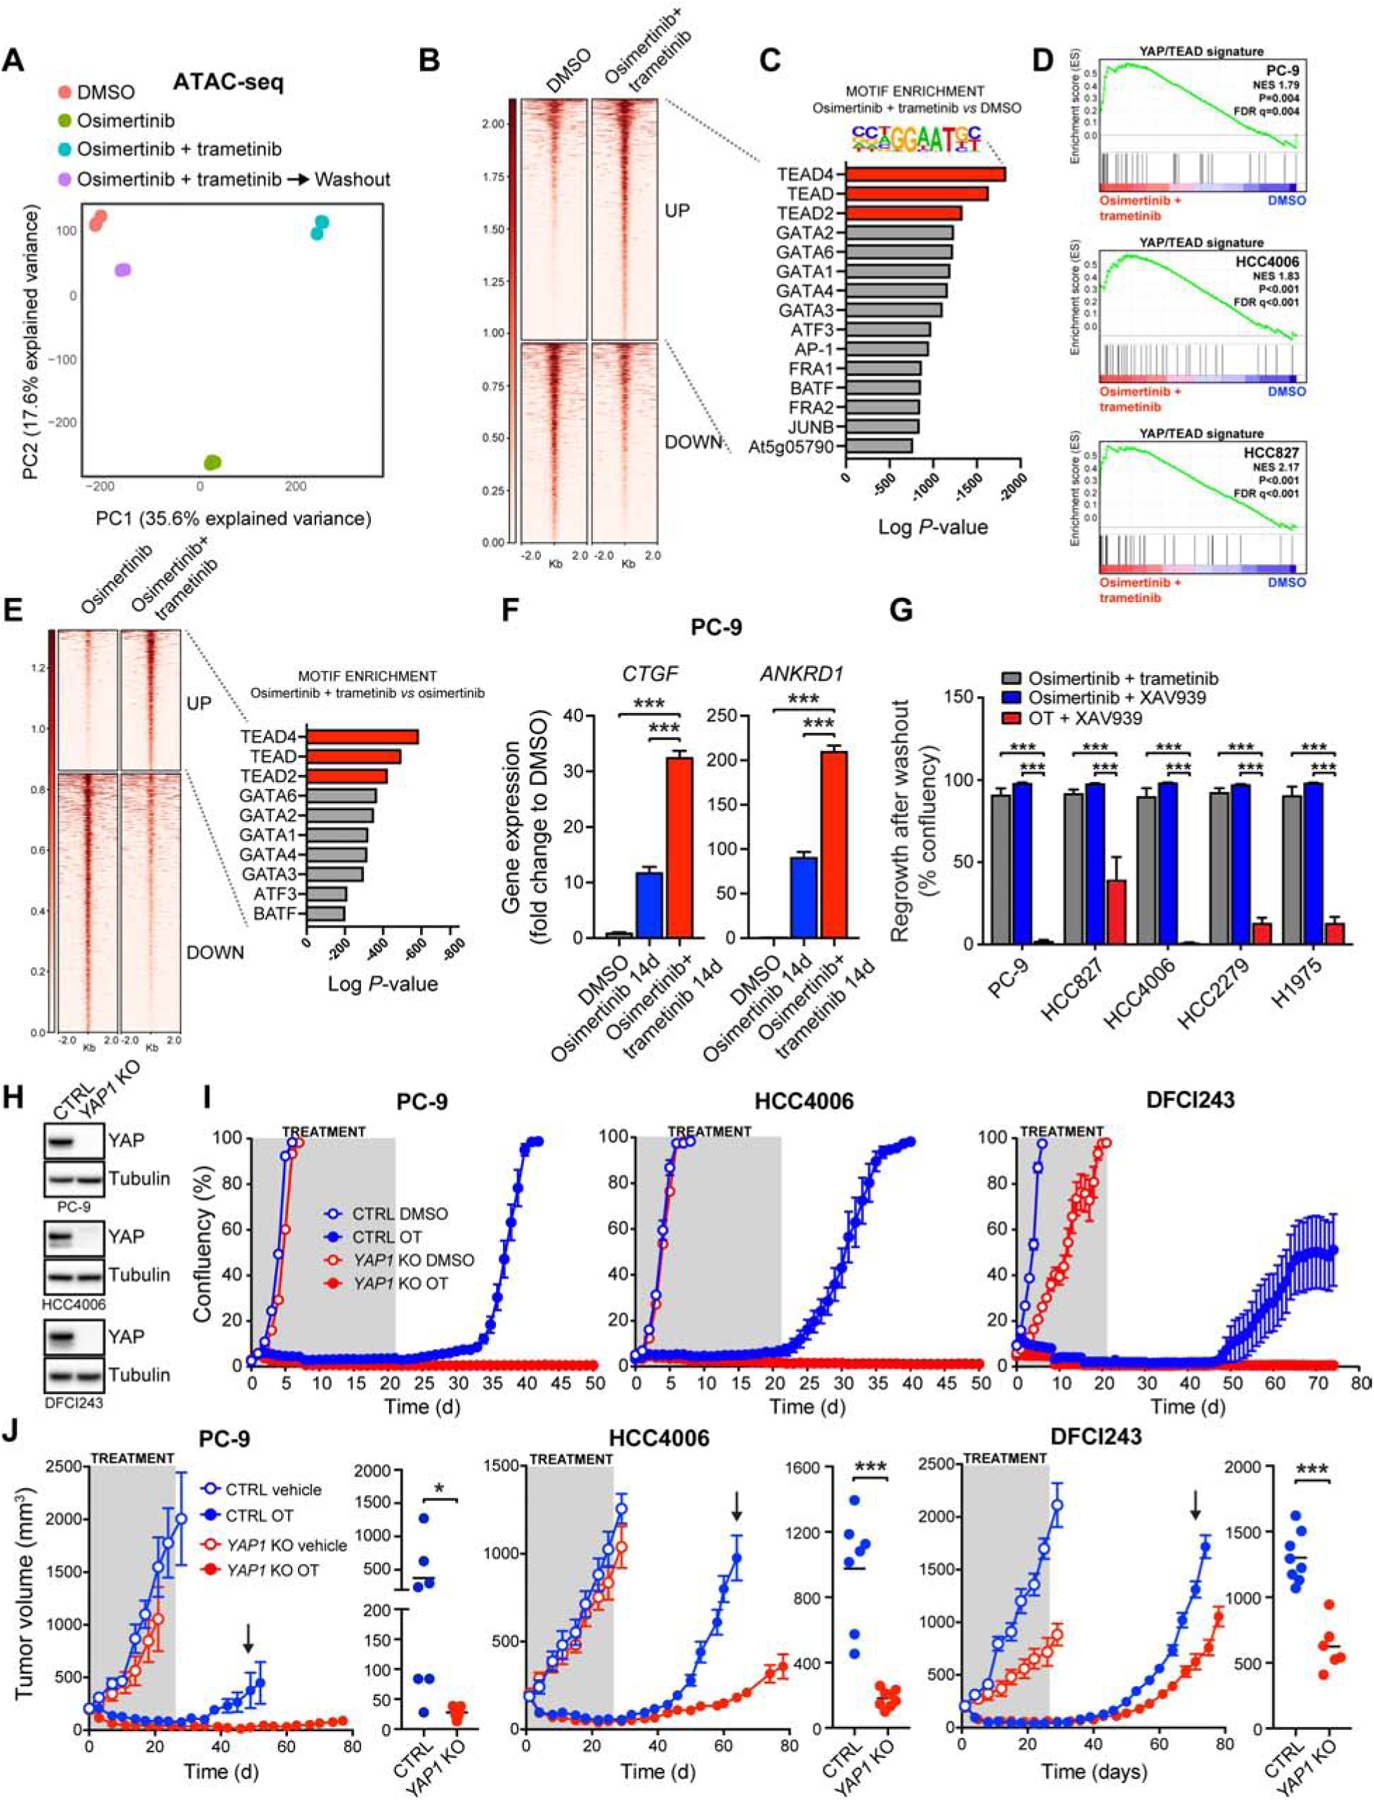
A) Principal component analysis of ATAC-seq data from cells treated as indicated for two weeks. B) ATAC-seq signal intensities centered on up-regulated (UP) or down-regulated (DOWN) peaks in dormant, OT-treated cells vs. control cells. C) Analysis for enriched transcription factor motifs D) GSEA of YAP/TEAD signature (Zhang et al., 2009) E) Left: ATAC-seq signal intensities centered on upregulated (UP) or down-regulated (DOWN) peaks in OT-treated vs. O-treated cells. Right: Analysis for transcription factor motifs enriched in upregulated peaks. F) QPCR analysis of YAP target gene expression. G) Regrowth of EGFR-mutant NSCLC cells after washout following a 3-week treatment with the indicated drug combinations. H) Western blot analysis of YAP protein levels in YAP1 knock-out (KO) and control (CTRL) cells. I) Proliferation of cells in (H) treated as indicated for 21 days, followed by drug washout. J) Mice bearing CTRL or YAP1 KO cell xenograft tumors were treated with vehicle or OT followed by treatment cessation and follow-up. Data from 6/8 live mice per group are plotted. Right: tumor volumes at time of regrowth, indicated by an arrow. Mean ± SEM are shown in all plots except (F), where mean ± SD are shown. ANOVA was used for statistical analyses in all but (J), where t-test was used. ***, P<0.001; *, P<0.05. See also Figure S4.
To assess the role of YAP activity in the establishment of OT –induced dormant state, we treated EGFR-mutant NSCLC cell lines for 3 weeks with OT +/− the tankyrase inhibitor XAV939, an indirect inhibitor of YAP activity (Wang et al., 2015), and assessed the regrowth of cells after drug washout. Remarkably, the OT/XAV939 combination dramatically reduced the number of dormant cells (Figure S4B), diminishing regrowth (Figure 2G). Similar findings with 3 additional structurally divergent tankyrase inhibitors were observed (Figure S4B). In addition, we tested the effect of several inhibitors targeting putative resistance pathways to EGFR TKIs, or the effect of chemotherapy in PC-9 cells, but observed little to no effect on the establishment of the dormant cell population (Figure S4C). Notably, the combination of single-agent O and XAV939 was significantly inferior to the OT/XAV939 combination in all EGFR-mutant NCSLC cell lines tested (Figure 2G), suggesting that the differences seen in YAP/TEAD activity between OT-induced dormant cells and single-agent O-treated cells may reflect different degrees of dependency on YAP.
To further validate the role of YAP in the establishment of the dormant state, we knocked out YAP1 in 3 different EGFR-mutant NSCLC cell lines, including a patient-derived cell line DFCI243, using the CRISPR/Cas9 system (Figure 2H). Strikingly, YAP1 knock-out (KO) completely abolished the establishment of dormant cells in all cases, measured by lack of regrowth following drug withdrawal after a 3-week treatment with OT (Figure 2I). In contrast, 2 out of 3 YAP1 KO cell lines treated with O alone regrew following washout (Figure S4D).
In vivo, OT treatment of mice bearing xenograft tumors from YAP1 KO PC-9, HCC4006 and DFCI243 cells or from the corresponding control cells led to a durable response for the entire four-week treatment period (Figure 2J). However, the control tumors started to regrow soon after treatment cessation, consistent with the presence of a dormant cell population in vivo. In comparison, YAP1 KO tumors had an increased tumor regrowth latency and significantly smaller tumors at the time of regrowth in all models (Figure 2J), consistent with a reduction in the dormant cell population. Collectively, these results demonstrate that the establishment of a drug tolerant state following EGFR/MEK inhibition, but not single-agent EGFR inhibition, is critically dependent on YAP/TEAD activity.
YAP activation is necessary for cancer cell viability upon combined EGFR/MEK inhibition
In order to monitor YAP/TEAD activity following drug treatment, we introduced a fluorescent YAP/Hippo pathway reporter (Mohseni et al., 2014) into PC-9 cells (PC-9 YAP reporter cells) and used live-cell imaging to track YAP activity over time. The OT treatment robustly induced YAP activity (Figure 3A) which was completely blocked by the addition of XAV939 (Figure 3A). Consistently, we noted decreased phosphorylation of the main YAP upstream negative regulator, LATS1, and a decrease in YAP S127 phosphorylation which regulates YAP cytosolic retention (Figure S5). Consequently, YAP nuclear localization was significantly increased in EGFR-mutant NCSLC cells following a 10-day OT treatment, but not following single-agent O treatment (Figure 3B), in agreement with the more prominent increase in YAP activity observed in the combination-treated cells (Figure 2F and 3A).
Figure 3. YAP activation is necessary for cancer cell viability upon combined EGFR/MEK inhibition.
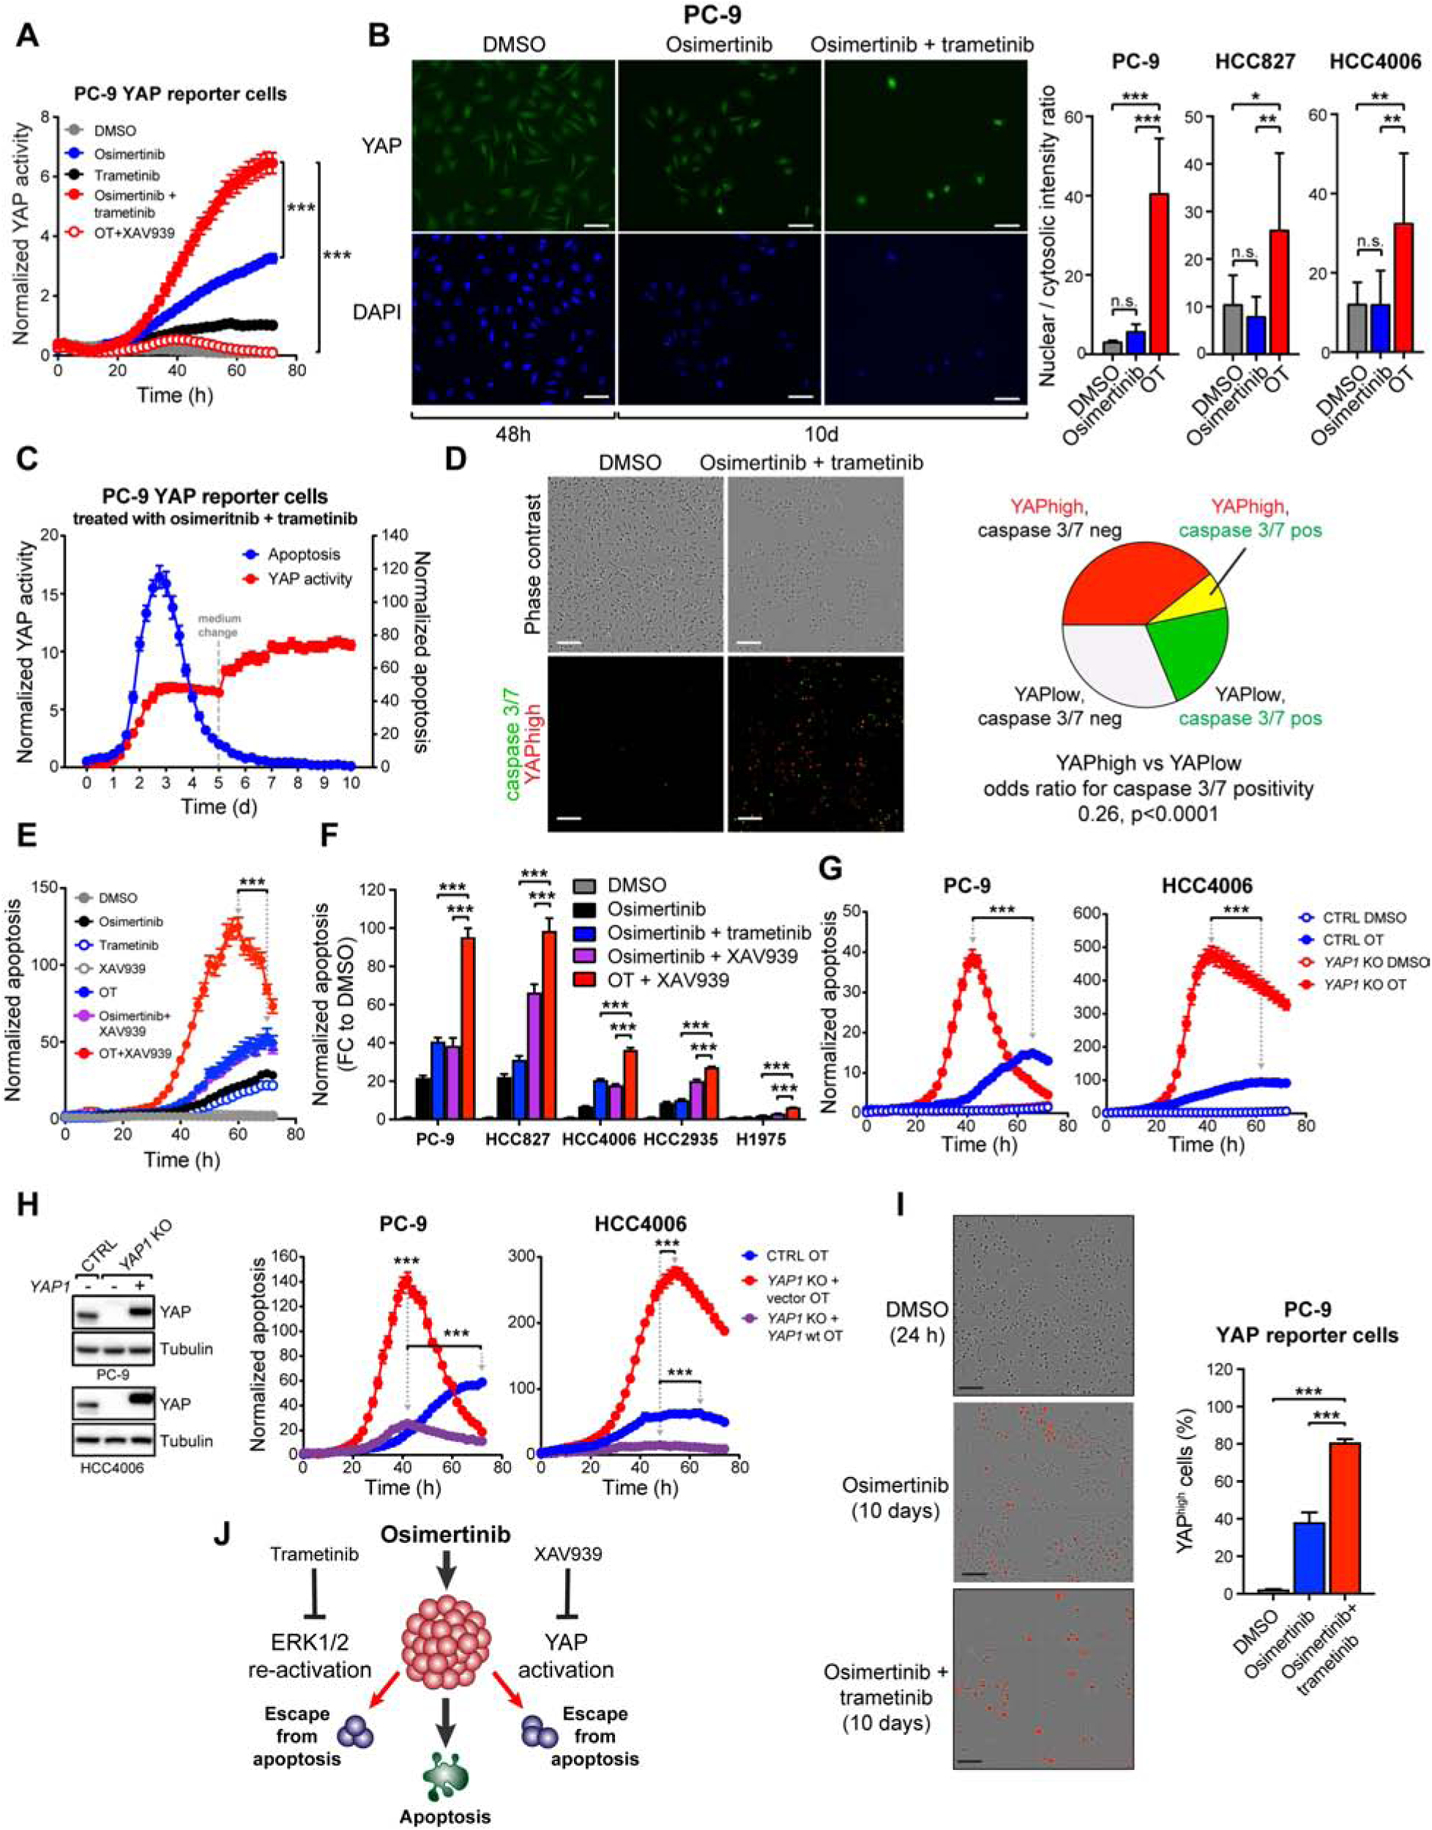
A) YAP activity following indicated treatments in PC-9 cells transduced with a fluorescent YAP/Hippo pathway reporter (PC-9 YAP reporter cells). B) IF staining for YAP nuclear localization following the indicated treatments. C) YAP activity and apoptosis in PC-9 YAP reporter cells treated with OT. D) Analysis of overlap between YAPhigh cells (red) and apoptotic cells (green) after 80h of treatment in PC-9 YAP reporter cells. E) Apoptosis in PC-9 cells treated with the indicated drugs or drug combinations. F) Apoptosis in EGFR-mutant NSCLC cells treated as indicated. Peak apoptosis values over 72h are shown. G) Apoptosis in YAP1 knock-out (KO) or control (CTRL) cells treated as indicated. H) Left: Western blot analysis of YAP protein levels in YAP1 KO cells transduced with wild-type YAP1. Right: cells were treated with OT and analyzed as in (G). Only data from drug-treated cells is shown. I) Proportions of YAPhigh cells in PC-9 YAP reporter cell populations treated as indicated. J) Different means for EGFR-mutant NSCLC cells to avoid apoptosis following EGFR inhibition. Mean ± SEM are shown in all plots except (I), where SD is shown. ANOVA was used for statistical analyses in all but (D), where Fisher’s exact test was used. ***, P<0.001. See also Figure S5.
Treatment induced activation of YAP suggested that active YAP protects cells from the initial apoptosis. To evaluate this possibility, we used non-invasive monitoring of caspase 3/7 activity over time in the PC-9 YAP reporter cells. An increase in YAP activation occurred proportionally to apoptosis (Figure 3C; Figure 3D), and cells with high YAP activity (YAPhigh cells) were significantly less likely to undergo apoptosis (Figure 3D; odds ratio 0.26 at 80h, p<0.0001 by Fisher’s exact test). Consistently, XAV939/OT treatment increased apoptosis in EGFR-mutant NSCLC cells compared to OT or to O/XAV939 alone (Figure 3E, F). Also, the YAP1 KO cells underwent heightened and accelerated apoptosis in response to OT (Figure 3G). Importantly, this hypersensitive phenotype was rescued by the re-expression of wild-type YAP1 in the YAP1 KO cells (Figure 3H).
The OT combination triggered significantly higher YAP reporter activity than single-agent O (Figure 3A), suggesting that the differences in YAP/TEAD activity seen in the drug tolerant state (Figure 2E, F) reflect the cells’ immediate responses to the different drug treatments. As the main consequence of concomitant MEK inhibition is the suppression of ERK1/2 re-activation following EGFR inhibition, our results suggest that ERK1/2 re-activation and YAP activation are two separate means by which EGFR-mutant NSCLC cells evade apoptosis following single agent O treatment. We quantified the proportion of YAPhigh cells in single-agent O- and OT – treated populations using the PC-9 YAP reporter cells. Following a 10-day treatment, the O-treated cell population contained both YAPhigh (40%) and YAP negative (60%) cells, whereas the OT treatment largely depleted YAP negative cells, leaving behind mostly YAPhigh cells (> 80%) (Figure 3I). Taken together, these observations demonstrate that chronic downregulation of EGFR and its downstream signaling by concomitant EGFR and MEK inhibition selects for cells that induce high YAP activity upon treatment, creating a vulnerability that can be exploited to selectively promote apoptosis in these cells through simultaneous inhibition of YAP (Figure 3J).
YAP-high, senescence-like dormant state also occurs in vivo
In order to study the dormant state in vivo, we performed single-cell RNA-sequencing (scRNA-seq) in cells from PC-9 xenograft tumors treated with OT until MRD (3 weeks) (Figure 4A, B; Figure S6A). We also performed scRNA-seq in dormant PC-9 cells following 3 weeks of OT treatment in vitro. We detected a significant increase in cells enriched for YAP, EMT or senescence gene expression signatures in the OT treated PC-9 cells in vitro and in vivo (Figure 4C). We also analyzed YAP expression and subcellular localization from the same PC-9 MRD in vivo samples using immunohistochemistry (IHC). Consistent with the scRNA-seq studies, we detected an increase in active, nuclear YAP in the MRD tumors, with more intense nuclear staining in the combination-treated tumors (Figure 4D). We further evaluated MRD tumors from genetically engineered EGFRL858R/T790M mice (Zhou et al., 2009) following 2 weeks of O treatment and similarly noted an increase in YAP nuclear localization (Figure 4E and 4F). As these mice have an intact immune system, we evaluated T-cell infiltration. We observed an increase in infiltration of CD4+ and CD8+ T-cells (Figure 4G, Figure S6B), suggesting that the MRD tumors elicit an immune response, consistent with our findings of an increase in secreted inflammatory factors (Figures S2B and C) and with prior studies in lung cancer patients (Thress et al., 2017). However, despite the T-cell response, neither O- nor O/selumetinib -treated EGFRL858R/T790M mice could be cured by the treatment (Figure S6C) suggesting that the immune response is insufficient to eradicate the YAPhigh residual cells.
Figure 4. YAP-high, senescence-like dormant state also occurs in vivo.
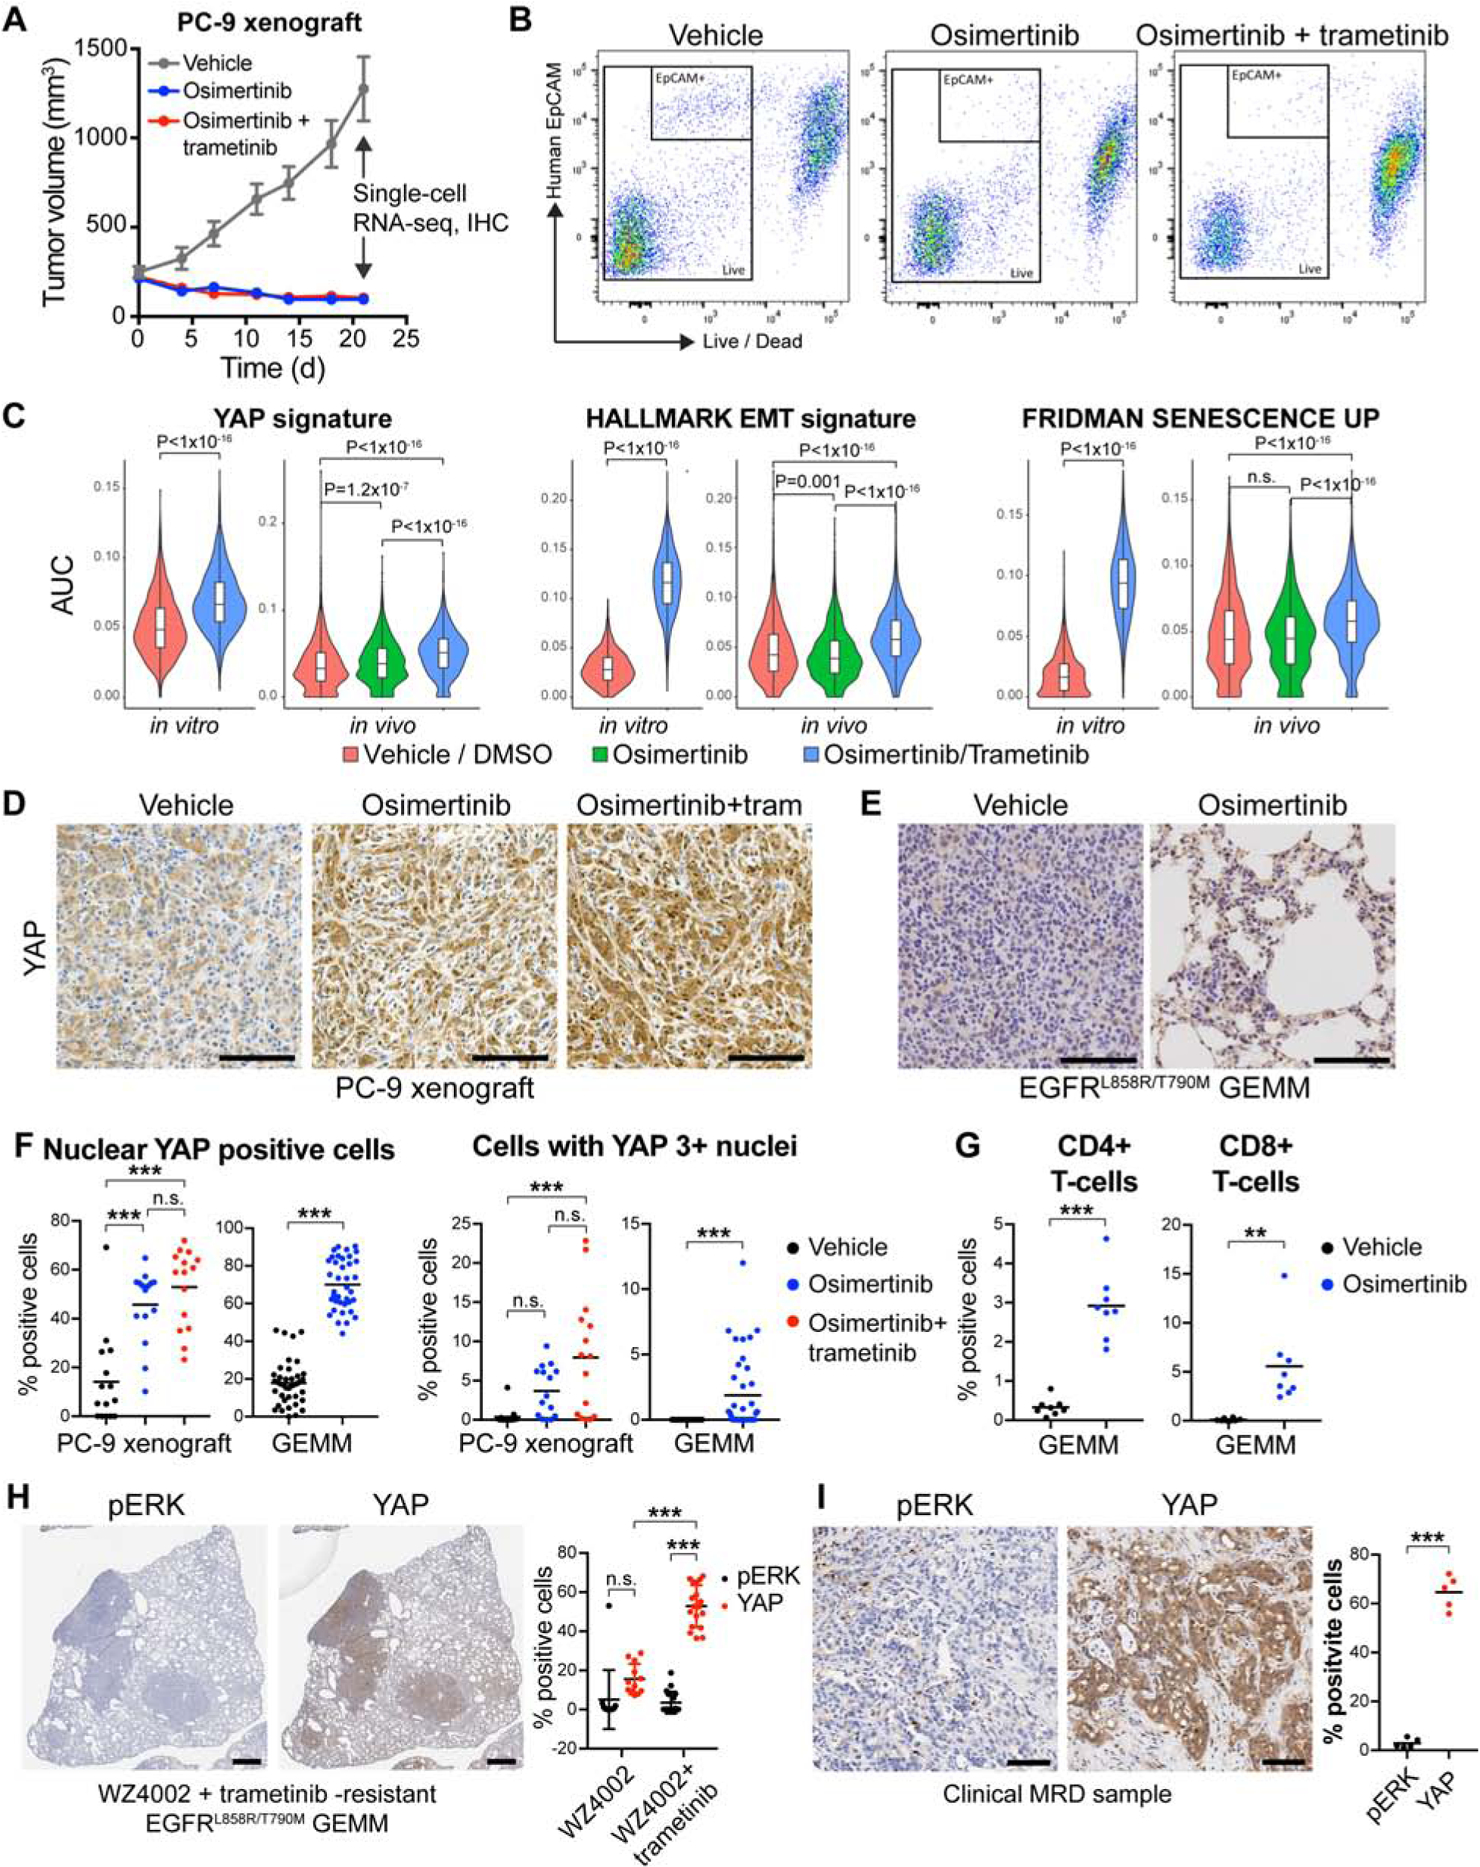
A) Growth curves of PC-9 xenograft tumors harvested for single-cell RNA-sequencing (scRNA-seq) and immunohistochemistry (IHC). B) FACS sorting scheme used to obtain scRNA-seq samples from the dissociated xenograft tumors. C) YAP, EMT and senescence signature enrichments in single cells from the xenograft tumors. D and E) IHC staining for YAP in the xenograft tumors (E) or in residual tumors from EGFRL858/T790M mice following 2-week treatment with vehicle or O. F) Quantification of (D) and (F). G) Quantification of infiltrating T-cells in the same tumors as in (E) based in CD4/CD8 IHC. H-I) IHC staining for YAP and pERK in WZ4002- or WZ4002/ T-resistant tumors from EGFRL858/T790M mice (H) or in a residual tumor of an EGFR-mutant NSCLC patient following treatment with O/selumetinib for 11 months (I). Kolmogorov-Smirnov Test (C), ANOVA (F when more than two groups, H) or t-test (F when two groups, G, I) were used for statistical analyses. ***, P<0.001; **, P<0.01; n.s., not significant. See also Figure S6.
We further studied tumors from EGFRL858R/T790M mice that had developed acquired resistance to WZ4002 (preclinical 3rd generation EGFR inhibitor)/T combination from our prior study (Tricker et al., 2015) and detected robust YAP nuclear staining and a lack of pERK1/2 expression in the resistant tumor nodules (Figure 4H). A significantly higher proportion of nuclear YAP-positive cells in WZ4002/T-resistant nodules was detected compared to single-agent WZ4002-resistant nodules (Figure 4H), consistent with our in vitro observations (Figures 2 and 3). Finally, we analyzed YAP nuclear staining and pERK1/2 expression in a tumor from a patient with advanced EGFR mutant lung cancer treated with O/selumetinib (NCT03392246) who had a sustained partial response. The patient underwent surgery following 11 months of treatment while in a clinical MRD state. The residual tumor demonstrated intense YAP staining and an absence of pERK1/2 staining (Figure 4I).
YAP mediates the evasion of apoptosis by repressing the induction of the pro-apoptotic protein BMF
We next sought to elucidate the mechanism by which YAP protects EGFR-mutant NSCLC cells from apoptosis. YAP1 KO had no effect on canonical EGFR signaling or on the induction of BIM, a known mediator of apoptosis following EGFR inhibition (Costa et al., 2007; Cragg et al., 2007; Gong et al., 2007) (Figure 5A). This suggests that YAP affects the apoptotic process independently of EGFR signaling and downstream of BIM. Unlike previous reports (Lin et al., 2015; Rosenbluh et al., 2012), we did not observe any significant changes in the levels of anti-apoptotic proteins BCL-XL, BCL2, BCL-w or MCL-1 in YAP1 KO cells compared to control cells at baseline or following OT (Figure S7A). In contrast, we observed a substantial increase in BAX activity (Figure S7B), cytochrome c release (Figure S7C) and caspase activation (Figure 3G) in YAP1 KO cells in response to OT, suggesting that the increased apoptosis seen in YAP1 KO cells is mediated by the intrinsic apoptotic pathway.
Figure 5. YAP mediates the evasion of apoptosis by repressing the induction of pro-apoptotic BMF.
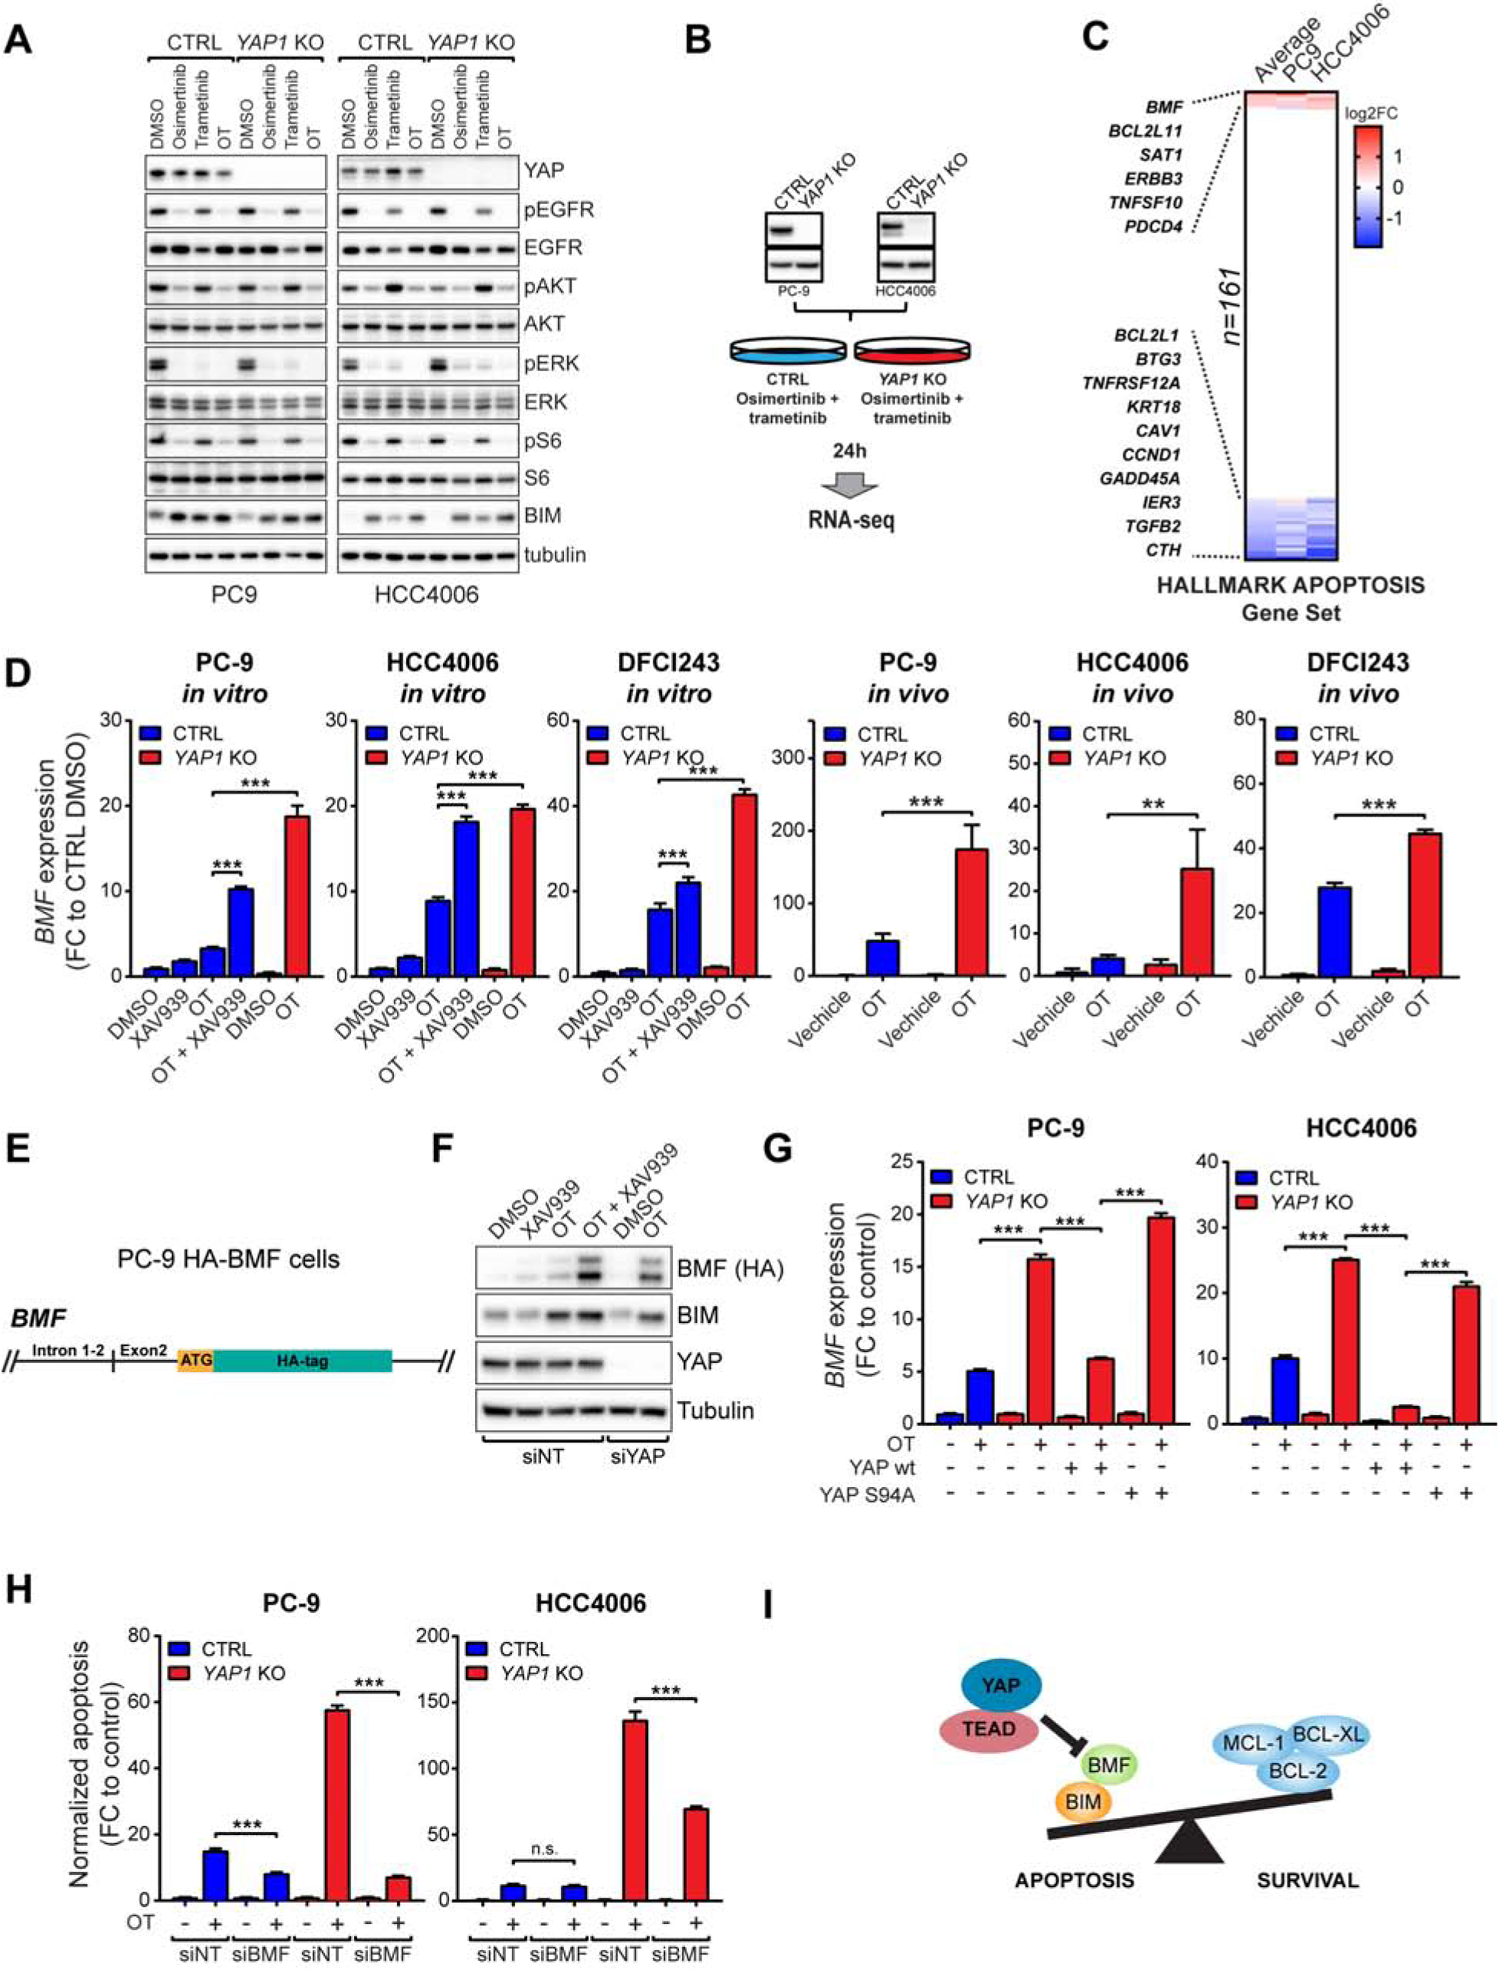
A) Western blot analysis of EGFR downstream signaling following 24h treatment as indicated. B) RNA-seq samples used in (C). C) Expression of genes regulating apoptosis in OT-treated YAP1 KO cells vs OT-treated CTRL cells. Colors indicate log2 fold change values with p<0.001. D) QPCR analysis of BMF expression in CTRL or YAP1 KO cells treated as indicated for 24h in vitro or 3 days in vivo. E) Schematic representation of the endogenous BMF locus in PC-9 HA-BMF cells. F) Western blot analysis of BMF, BIM, and YAP expression in PC-9 HA-BMF cells transfected with non-targeting (NT) or YAP siRNA and treated as indicated for 24h. G) QPCR analysis of BMF expression in CTRL or YAP1 KO cells transduced as indicated, and following treatment with either DMSO or OT for 24h. H) Peak apoptosis over 72h treatment in PC-9 and HCC4006 cells transfected with NT or BMF siRNA. I) The mechanism of YAP/TEAD-mediated suppression of apoptosis in EGFR-mutant NSCLC cells following EGFR/MEK inhibition. Mean ± SD are shown in all plots except (H), where mean ± SEM is shown. ANOVA was used for statistical analyses. ***, P<0.001; **, P<0.01; n.s., not significant (P>0.05). See also Figure S7.
To identify potential YAP target gene(s), we performed RNA-seq on PC-9 and HCC4006 YAP1 KO or control cells with and without OT treatment (Figure 5B). Focusing on genes that mediate apoptosis through the activation of caspases (Hallmark Apoptosis gene set, 161 genes) (Liberzon et al., 2015), we identified BMF as one of the top up-regulated genes in drug-treated YAP1 KO cells compared to drug treated control cells in both cell lines (Figure 5C). The BMF gene encodes a pro-apoptotic BH3-only protein that can sequester anti-apoptotic proteins, but unlike BIM, cannot directly activate BAX or BAK (Bhola and Letai, 2016; Kuwana et al., 2005). Together with BIM induction upon EGFR inhibition (Figure 4A), an increase in BMF in YAP1 KO cells would be expected to lead to increased activation of BAX and thus to enhanced apoptosis, consistent with our observations (Figure 3G and Figure S7B, C). We confirmed the RNA-seq results using QPCR; YAP inhibition by XAV939 or YAP1 knock-out significantly increased BMF expression in response to OT in EGFR-mutant NSCLC cell lines in vitro and in vivo (Figure 5D). Due to lack of high-affinity antibodies for BMF, we used CRISPR/Cas9 technology to produce N-terminally HA-tagged BMF under the endogenous promoter in PC9 (Figure 5E, S7D). In these cells, YAP inhibition or YAP knock-down led to a robust increase in BMF protein levels, while BIM levels remained unchanged (Figure 5F). Moreover, re-introduction of wild-type YAP, but not a TEAD-binding deficient S94A mutant, to the YAP1 KO background completely abolished the increase in BMF expression (Figure 5G). Ectopic overexpression of BMF using a doxycycline-inducible vector in EGFR-mutant NSCLC cells (Figure S7E) induced rapid apoptosis, which was further increased by co-treatment with OT (Figure S7F), demonstrating that induction of BMF alone, without YAP activation, is sufficient to sensitize EGFR-mutant NSCLC cells to apoptosis. Downregulation of BMF expression using siRNA significantly decreased apoptosis in YAP1 KO cells in response to OT (Figure 5H and Figure S7G), demonstrating that the induction of BMF expression is necessary for the increased apoptosis in YAP1 KO cells. Hence, YAP facilitates evasion of apoptosis in EGFR-mutant NSCLC cells by repressing the expression of BMF upon combined EGFR/MEK inhibition, leading to the establishment of the dormant cell population (Figure 5I).
YAP represses BMF induction by engaging EMT transcription factor SLUG
Next, we investigated the molecular mechanisms by which YAP represses the expression of BMF. Although YAP is mostly linked to transcriptional activation, it has also been shown to complex with transcription factors and modulators to drive transcriptional repression, often in association with TEAD (Beyer et al., 2013; Kim et al., 2015; Zaidi et al., 2004). Thus, we hypothesized that the YAP/TEAD complex is directly repressing BMF by forming a tertiary complex with a transcriptional repressor.
In search for such transcriptional repressors, we noted that an EMT gene expression signature was highly enriched in the dormant cells induced by OT treatment (Figure 1G). In addition to EMT being a known mechanism of drug resistance in EGFR-mutant lung cancer (Byers et al., 2013; Sequist et al., 2011; Shibue and Weinberg, 2017; Zhang et al., 2012), YAP has been reported to mediate EMT and to directly bind to canonical EMT transcription factors, including SNAIL, SLUG and ZEB1 (Lehmann et al., 2016; Tang et al., 2016). We therefore explored the possibility that EMT, the development of a dormant state, and the requirement for YAP in mediating evasion of apoptosis through repression of BMF following drug treatment were all linked. In PC-9 and HCC4006 YAP1 KO cells following 24-hour OT treatment, compared to control cells, the EMT signature was negatively enriched, suggesting that YAP is triggering the EMT program in EGFR-mutant NSCLC cells (Figure 6A). QPCR analysis revealed that SNAI2, encoding SLUG, was the dominantly expressed EMT transcription factor in EGFR-mutant NCSLC cell lines (Figure 6B). We further observed that endogenous YAP, TEAD and SLUG proteins co-immunoprecipitate in both PC-9 and HCC4006 cells upon 48-hour OT treatment (Figure 6C). Knock-down of SLUG by siRNA in PC-9 and HCC4006 cells resulted in a significant increase in BMF expression following treatment with OT, similar to that observed following YAP knock-down (Figure 6E), and the increase in BMF expression translated into a robust increase in apoptosis upon treatment (Figure 6F). These results suggest that members of the YAP/TEAD/SLUG complex co-operate to repress BMF expression and thus suppress apoptosis in response to OT treatment. To confirm that the YAP/TEAD/SLUG complex directly binds the BMF locus to mediate repression, we performed chromatin immunoprecipitation followed by next-generation sequencing (ChIP-seq) using antibodies against endogenous YAP, TEAD4, and SLUG in PC-9 cells treated either with DMSO or OT. We detected a robust increase in YAP and SLUG binding to chromatin after 48 hours of OT treatment, while TEAD4 chromatin binding was less affected (Figure 6G). Specifically, we observed overlapping YAP, TEAD and SLUG peaks at the BMF promoter region as well as at nearby H3K27Ac-positive enhancer regions upon treatment (Figure 6H), demonstrating that the YAP/TEAD/SLUG repressor complex directly binds to BMF locus. Taken together, these results provide a mechanistic explanation for YAP-mediated suppression of pro-apoptotic signaling through the engagement of TEAD and the EMT program to directly repress the induction of BMF expression upon combined EGFR/MEK inhibition (Figure 6I).
Figure 6. YAP represses BMF induction by engaging EMT transcription factor SLUG.
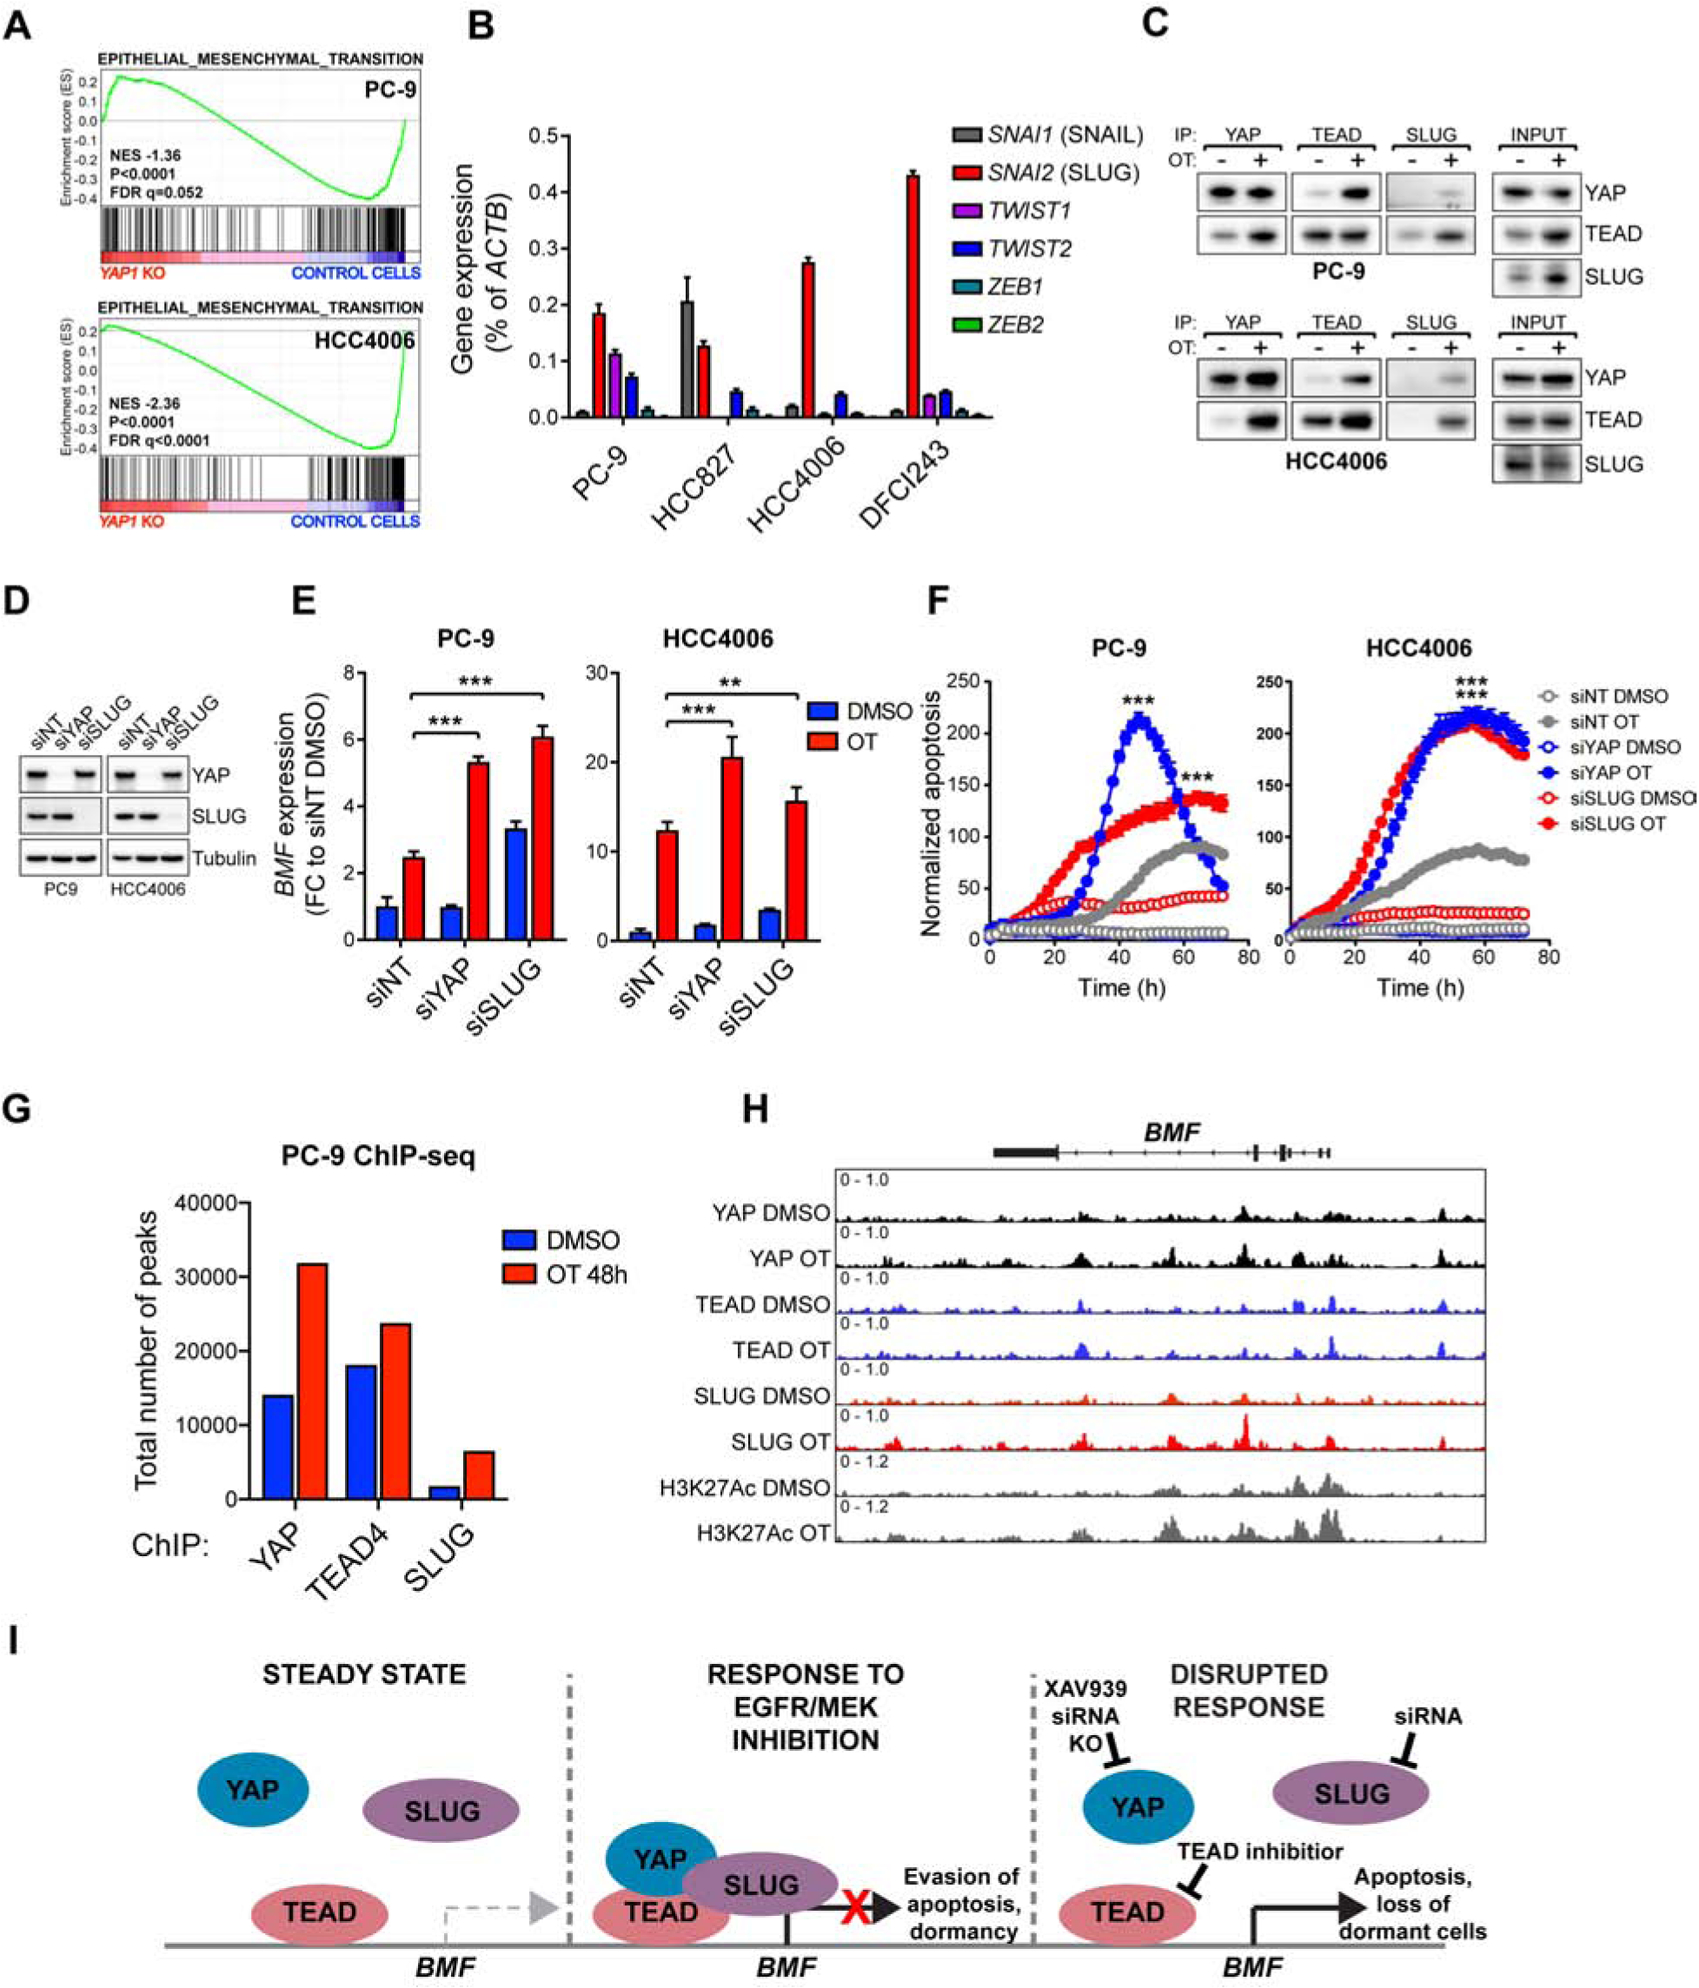
A) GSEA of EMT signature in YAP1 knock-out (KO) vs control cells treated with OT for 24 hours. B) QPCR analysis of EMT transcription factor expression in untreated EGFR-mutant NSCLC cells. C) Co-immunoprecipitation analysis of the interaction between YAP, TEAD, and SLUG in PC-9 cells following treatment with DMSO or OT for 48h. D) Western blot analysis of YAP and SLUG protein levels in PC-9 or HCC4006 cells transfected with non-targeting (NT), YAP or SLUG siRNA. E) QPCR analysis of BMF expression in cells in (D) following 24h treatment with DMSO or OT. F) Apoptosis in cells in (D) following treatment with DMSO or OT. G) Number of peaks called by MACS2 (FDR<0.01). H) ChIP-seq signal traces in BMF locus. H3K27Ac was used to identify enhancer regions. I) The mechanism by which YAP/TEAD/SLUG complex represses BMF expression upon combined EGFR/MEK inhibition. Mean ± SD (E), or mean ± SEM (F) are shown. ANOVA was used for statistical analyses. ***, P<0.001; **, P<0.01.
Development of novel covalent TEAD inhibitor to target YAP dependency upon combined EGFR/MEK inhibition
The strict dependency of OT-treated cells on YAP presents an attractive target for drug development. While our results point towards TEAD as the main mediator of YAP effects in this context (Figure 2C, 2D, 6H), we wanted to further confirm whether other effector pathways downstream of YAP might also play a role. The YAP protein has several functional domains, many of which mediate protein-protein interactions (Piccolo et al., 2014). We systematically mutated the key functional domains in YAP (Figure 7A), and determined which of the mutants could rescue the apoptotic phenotype imparted by YAP1-deficiency following OT treatment in PC-9 cells. We observed that introduction of YAP1 with a mutation in the TEAD-binding domain (S94A) (Zhao et al., 2008), or with a deleted transactivation domain (TAdel; Figure 7A), had the least ability to rescue YAP1-deficiency (Figure 7B), confirming that YAP-mediated evasion of apoptosis is absolutely dependent on TEAD, as well as on intact transactivation domain.
Figure 7. Development of novel covalent TEAD inhibitor to target YAP dependency upon combined EGFR/MEK inhibition.
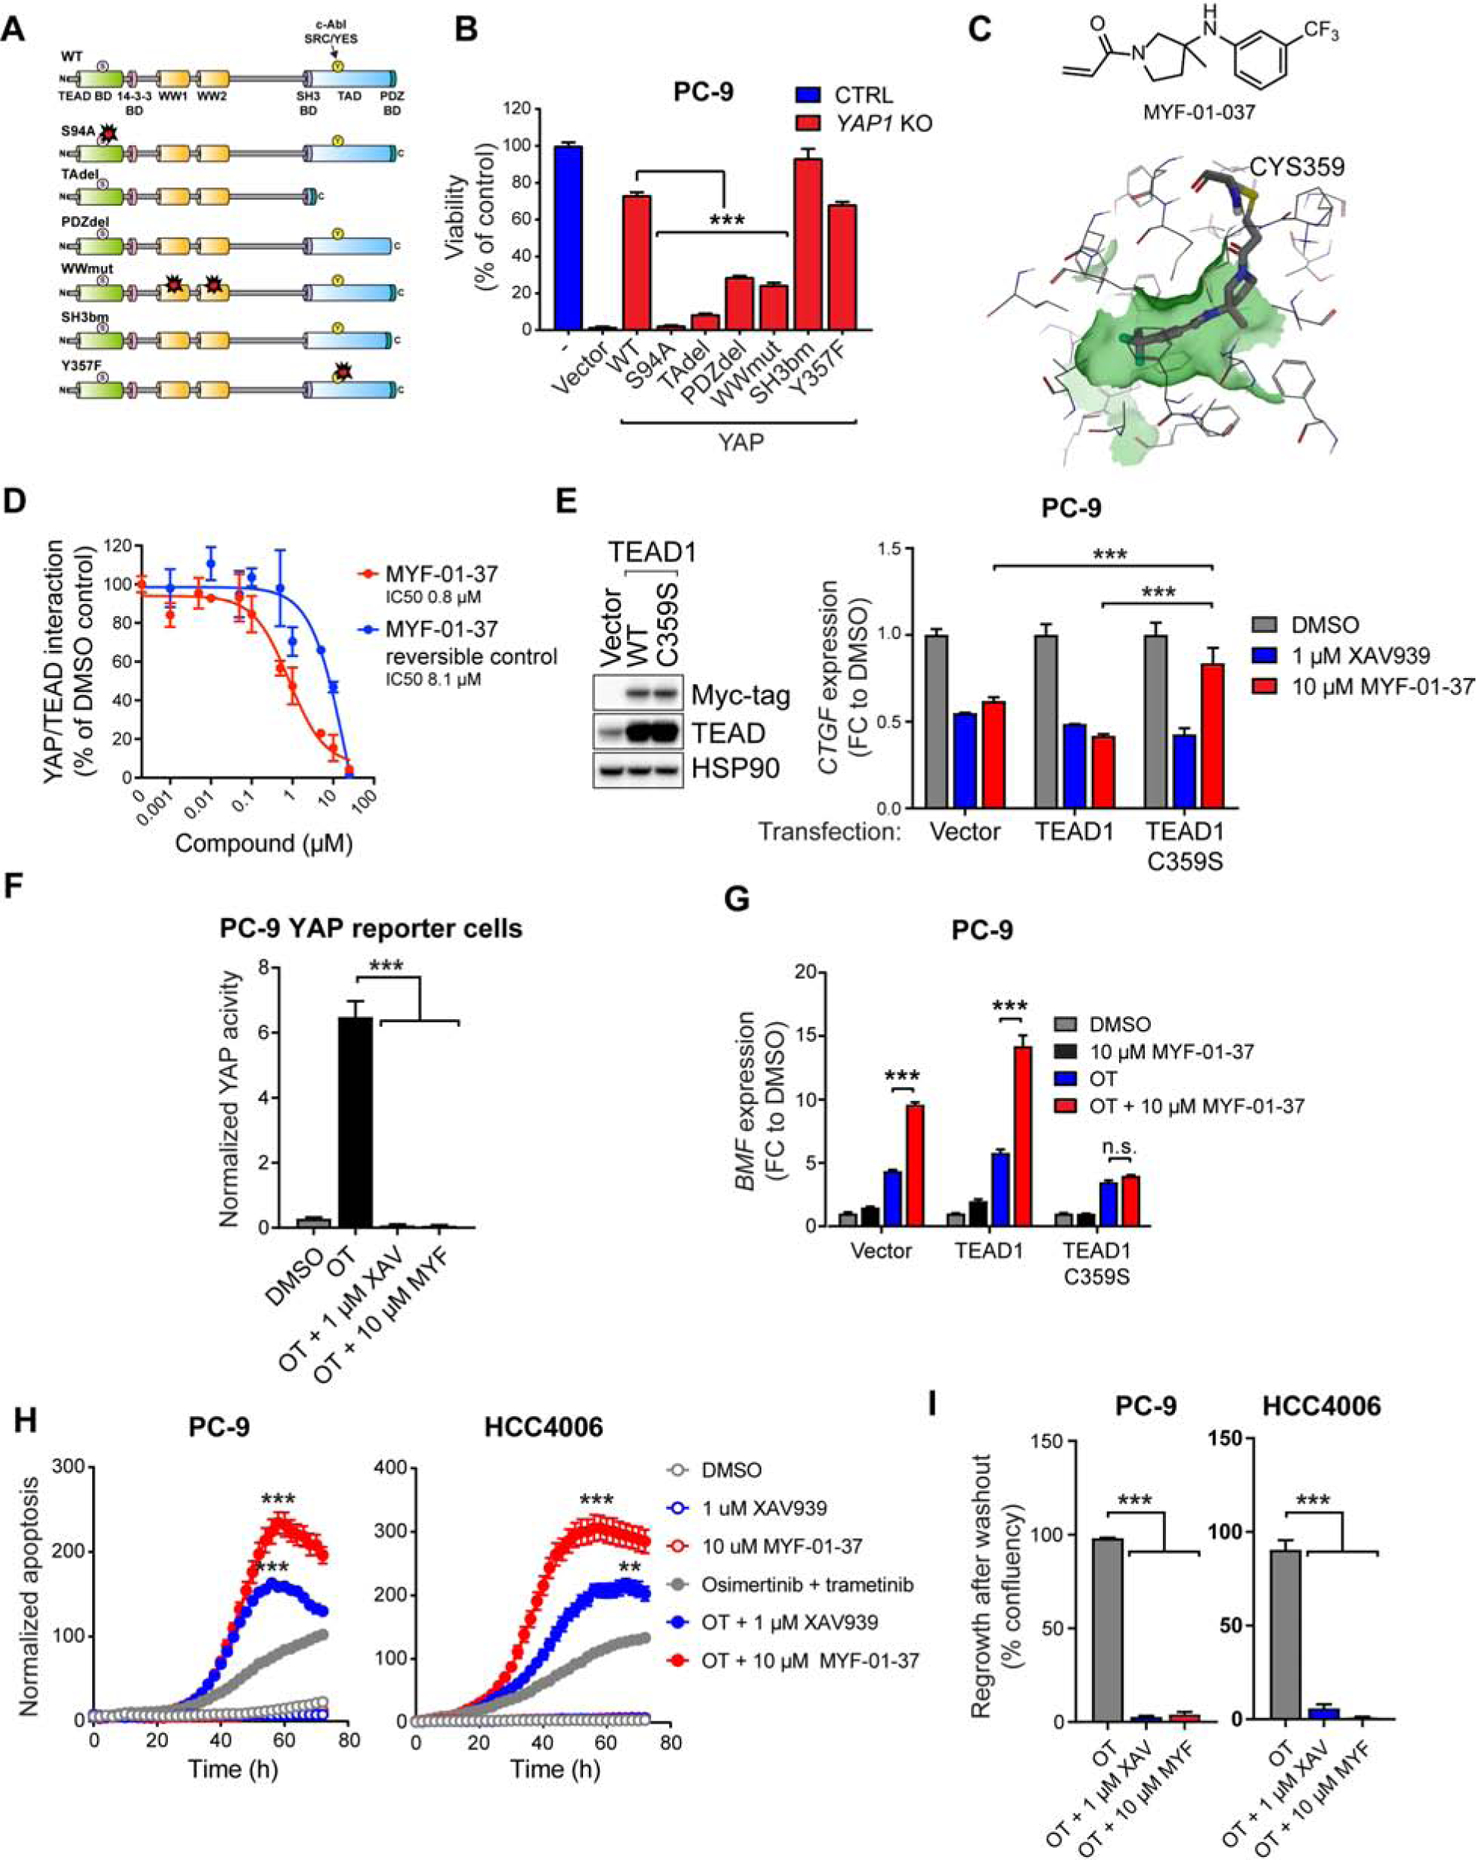
A) YAP1 mutants used in the rescue experiment in (B). B) Viability (Cell Titer Glo) of CTRL cells or PC-9 YAP1 KO cells transduced with YAP1 mutants (A) following 72h treatment with OT. C) Top: the structure of MYF-01–37. Bottom: MYF-01–37 binding to the palmitoylation pocket in TEAD1 based on molecular docking. The cysteine 359 targeted by MYF-01–37 is indicated. D) Effect of MYF-01–37 or the corresponding reversible control on YAP/TEAD interaction measured using Split Gaussia Luciferase Assay. E) Left: Western bot analysis of the expression of myc-tagged TEAD1 in PC-9 cells transduced as indicated. Right: QPCR analysis of CTGF expression after 24h treatment with XAV939 or MYF-01–37 in the transduced PC-9 cells. F) YAP activity in PC-9 YAP reporter cells after 72h treatment with OT or OT in combination with XAV939 (XAV) or MYF-01–37 (MYF). G) QPCR analysis of BMF expression in cells in (E) following 24h treatment as indicated. H) Apoptosis in PC-9 and HCC4006 cells treated as indicated. G) Regrowth of PC-9 and HCC4006 cells after drug washout following a two-week treatment as indicated. Mean ± SEM are shown in all plots except (E), where mean ± SD is shown. ANOVA was used for statistical analyses. ***, P<0.001; **, P<0.01. See also Figure S8.
TEAD, as a transcription factor, is presumed undruggable. However, recent studies revealed a hydrophobic pocket for the post-translational palmitoylation of TEAD (Chan et al., 2016; Noland et al., 2016), and flufenamic acid as a molecule binding to this pocket (Pobbati et al., 2015). Flufenamic acid/TEAD2 co-crystal revealed extensive hydrophobic interactions as its main binding mode (Pobbati et al., 2015), providing a structural basis for the rational design of a covalent TEAD inhibitor through an acrylamide as a covalent warhead to react with the conserved Cys380 on TEAD2. We reasoned that the trifluoromethylated phenyl ring forms extensive hydrophobic interactions, whereas the carboxylic acid of flufenamic acid, proximal to Cys380, might be replaced by acrylamide warhead to react with the cysteine. Hence, MYF-01–37 (Figure 7C) was developed as a covalent binder to TEAD, targeting Cys380 when incubated with the TEAD2 protein (C359 in TEAD1) (Figure S8A–C). Pretreating cells with MYF-01–37 led to loss of direct TEAD pull-down by biotin-MYF-01–037 (Figure S8D) from whole-cell lysate (Figure S8E), confirming MYF-01–037 binding to TEAD in cells. This target engagement of TEAD resulted in inhibition of direct YAP/TEAD interaction (Figure 7D) in HEK 293T cells, and in the reduction in canonical YAP target gene CTGF expression in PC-9 cells (Figure 7E). This reduction was abrogated by the overexpression of TEAD1 C359S mutant that disrupts the covalent binding of the drug to TEAD, but not by overexpression of wild-type TEAD1 (Figure 7E), demonstrating that the observed inhibition of YAP activity is due to on-target covalent binding of the compound to TEAD. Importantly, XAV939, which inhibits YAP activity via a TEAD-independent mechanism (Wang et al., 2015), was still able to inhibit CTGF expression also in cells expressing the TEAD1 C359S mutant (Figure 7E). As a single agent, MYF-01–37 had minimal impact on cell viability of several EGFR-mutant NCSLC cell lines (Figure S8F), which is consistent with the apparent dispensability of YAP activity in EGFR-mutant NSCLC cells at steady state (Figure 2I). When combined with OT, MYF-01–37 completely suppressed the increased YAP activity induced by OT treatment in PC-9 YAP reporter cells (Figure 7F), led to a robust increase in BMF expression (Figure 7G), and to subsequent increase in apoptosis in PC-9 and HCC4006 cells compared to OT alone (Figure 7H), thus phenocopying the effects of tankyrase inhibition or YAP1 KO (Figures 3A, 3E, 3G and 5D). Importantly, a 10-day treatment with MYF-01–37 in combination with OT led to a dramatic decrease in dormant cells compared to OT alone (Figure 7I).
Discussion
Genotype directed therapy is the standard of care for many cancers that harbor an activated oncogene (Blanke et al., 2008; Drilon et al., 2018; Peters et al., 2017). While this treatment approach has transformed cancer care for many genomic subtypes of cancer, these therapies are rarely, if ever, curative. One explanation for such observations is the inability of genotype directed therapies to eradicate all tumors cells. In EGFR-mutant NSCLC, a complete response is observed only in a small minority (<5%) of patients following treatment with EGFR TKI (Mok et al., 2017; Soria et al., 2018). As EGFR mutations are truncal mutations (i.e. in every cell of a tumor) (Jamal-Hanjani et al., 2017), it is not clear why a proportion of tumor cells can survive initial EGFR inhibitor-induced apoptosis and subsequently persist in the presence of drug treatment.
The development of EMT, as a drug resistant state following EGFR inhibitor treatment, has been observed both in model systems and in lung cancer patients (Byers et al., 2013; Sequist et al., 2011; Zhang et al., 2012). In addition, hyperactivation of the Hippo pathway effector YAP has been shown to dampen the efficacy of targeted treatment in several contexts (Zanconato et al., 2016), including the efficacy of EGFR TKIs in EGFR-mutant NCSLC (Hsu et al., 2016; Ku et al., 2012). However, the mechanistic bases for these observations remain largely unexplored. Here we provide a mechanistic link for these two different observations and demonstrate that a critical transcription factor mediating EMT, SLUG, and YAP together lead to transcriptional repression of BMF following EGFR/MEK treatment and as such limits the initial drug induced apoptotic effect allowing the formation of a dormant state.
Apoptosis in response to EGFR TKIs in EGFR-mutant NCSLC is executed by the intrinsic apoptotic pathway and invariably associated with the upregulation of BIM (Costa et al., 2007; Cragg et al., 2007; Gong et al., 2007). BIM levels are suppressed by the MAPK pathway, both transcriptionally and post-transcriptionally (Ley et al., 2005), and thus mechanisms which uncouple EGFR inhibition from ERK1/2 inhibition would be expected to block EGFR inhibitor - mediated upregulation of BIM, promoting cell survival (Ercan et al., 2012; Tricker et al., 2015). O can also activate YAP, allowing drug-induced cell survival through a completely different mechanism (Figures 3A, 3I, 3J, 4F). Thus, single-agent EGFR TKI treatment can lead to both ERK1/2 reactivation and YAP activation, whereas upon combined EGFR/MEK inhibition, activation of YAP becomes the dominant survival mechanism in EGFR-mutant NSCLC cells (Figure 3A, 3I, 3J, 4F, 4H, 4I). These results suggest that YAP can maintain the viability of EGFR-mutant NSCLC cells in the chronic absence of EGFR and its downstream signaling. Intriguingly, the ability of YAP to compensate for the loss of dominant oncogene in MAPK-dependent cancers has been previously shown in the context of mutant KRAS-driven NSCLC and pancreatic ductal adenocarcinoma (Kapoor et al., 2014; Shao et al., 2014). In these studies, YAP1 overexpression (Shao et al., 2014) or YAP1 amplification (Kapoor et al., 2014) rescued the loss of KRAS in a MAPK pathway -independent mechanism.
Overexpression of YAP and its paralog TAZ has been shown to induce EMT in a TEAD-dependent manner (Lei et al., 2008; Zhang et al., 2009; Zhao et al., 2008). Considering that YAP activation seems to be a specific adaptation mechanism in cells that cannot re-activate EGFR downstream signaling, the YAP/TEAD/SLUG interplay repressing BMF may be the immediate response protecting cells undergoing a YAP-dictated global change in cellular state.
Analogously, Shao et al. also found that the YAP-mediated bypass of KRAS loss was associated with the acquisition of a mesenchymal state, suggesting that YAP may drive the EMT program as a mechanism to adapt to loss of oncogene signaling in other cancer contexts as well (Shao et al., 2014). Whether our observations on YAP mediated suppression of apoptosis through transcriptional repression of BMF also extend to other genotype directed cancer therapies remains unknown and will need to be evaluated in future studies. Also, we cannot rule out a possibility that in addition to YAP/TEAD/SLUG, other factors are involved in the long-term survival of EGFR mutant cancer cells treated with OT.
Interestingly, the dormant state resulting from YAP/TEAD activation shared several characteristics with cellular senescence. Unlike treatment-induced senescence (TIS) in response to DNA-damaging chemotherapeutic agents (Ewald et al., 2010), EGFR-mutant NSCLC cells seem to only reversibly adopt the senescence program upon EGFR/MEK inhibition in order to sustain the lethal drug exposure, and revert back to the normal steady-state upon drug withdrawal. Consequently, the senescent-like population, at least in this context, can serve as a reservoir of dormant cells that are later, upon acquisition of additional resistance mechanisms, capable of re-establishing the tumor and drive clinically observed drug resistance.
The therapeutic vulnerability of EGFR-mutant NSCLC to YAP/TEAD antagonism identified in this study led us to develop a novel covalent TEAD inhibitor, MYF-01–37. As YAP is widely associated with resistance to cancer therapies, we also tested the effect of TEAD inhibition and/or YAP1 KO in other genotype- or TKI combination contexts within the NSCLC space, including in ALK rearranged, MET amplified and EGFR mutant MET amplified models, and observed increased apoptosis following YAP/TEAD co-targeting in most models (Figure 8A–C). These data suggest wide potential for co-targeting YAP/TEAD with genotype directed therapy. In accordance with our observations that YAP1 loss has negligible consequences in EGFR-mutant NSCLC cells at steady state, MYF-01–37 did not demonstrate single-agent toxicity (Figure S8F). This is in stark contrast to a recently published, structurally similar covalent TEAD inhibitor TED-347 (Bum-Erdene et al., 2019), (Figure S8F), which is toxic most likely due to its covalent warhead. Unlike the highly reactive α-chloroketone covalent warhead in TED-347, the acrylamide warhead in MYF-01–37 is more suitable for covalent targeting of proteins in living cells, and thus most likely contributes to the low non-specific toxicity of MYF-01–37 as a single agent (De Cesco et al., 2017; Liu et al., 2013). Further development is needed to optimize the pharmacological properties of MYF-01–37 to enable preclinical testing of the compound using in vivo models of EGFR-mutant NSCLC.
Figure 8. Co-targeting YAP/TEAD with genotype directed therapy.
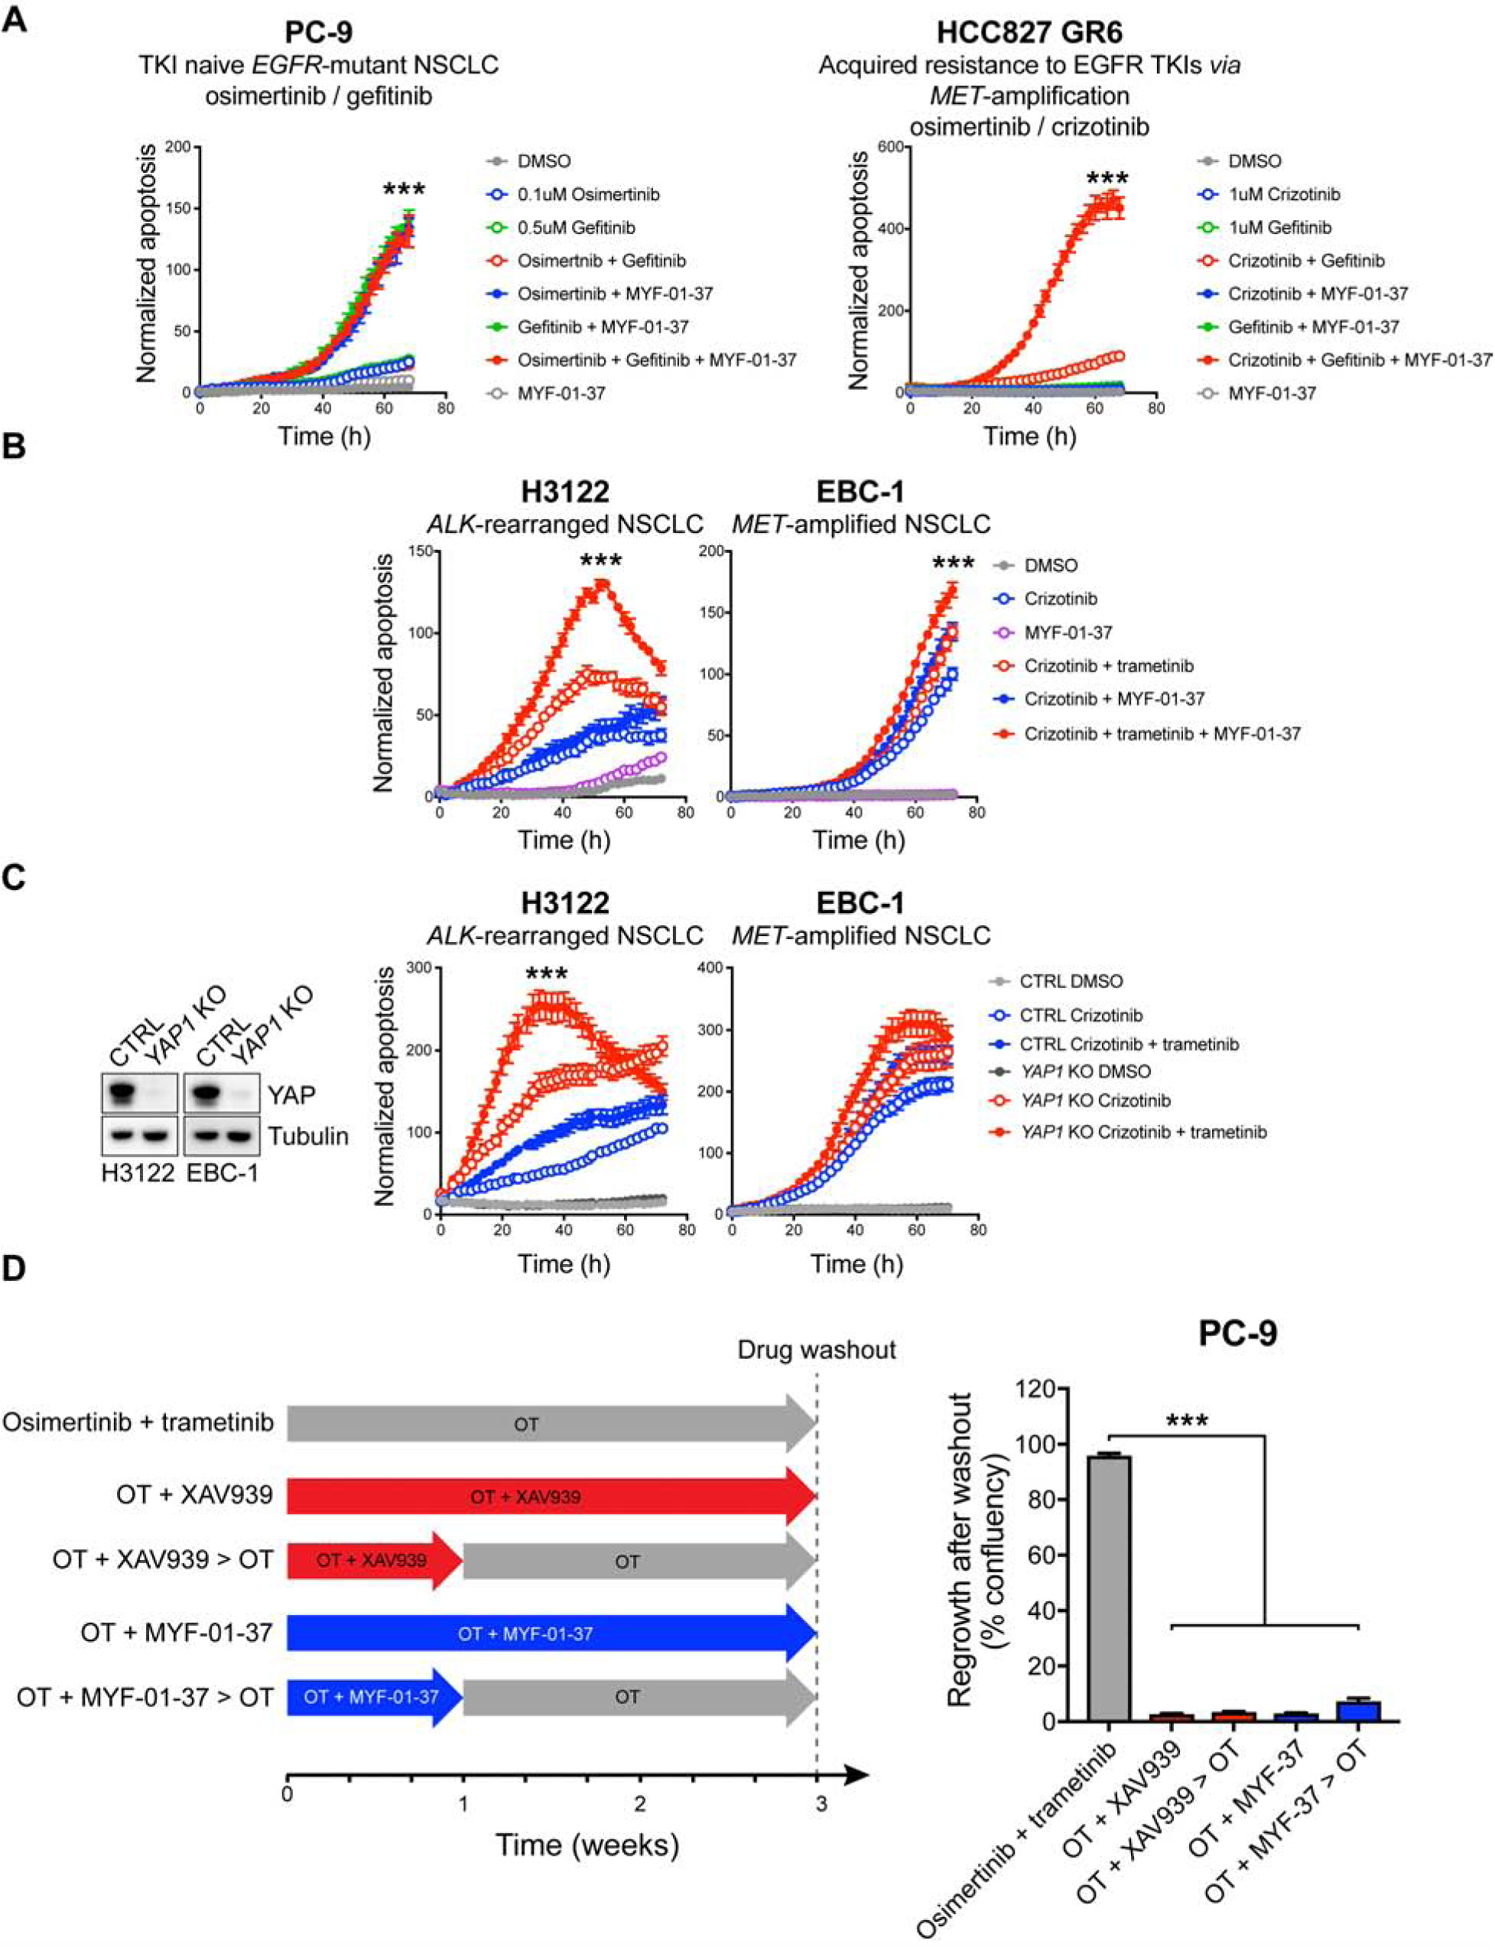
A–B) Apoptosis in NSCLC cell lines treated as indicated. C) Left: Western blot analysis of YAP expression in control (CTRL) and YAP1 KO H3122 and EBC-1 cells. Right: apoptosis in CTRL and YAP1 KO H3122 and EBC-1 cells treated as indicated. D) PC-9 cells were treated as indicated in the scheme on the left, followed by drug washout. Regrowth of cells was monitored and quantified as in Figure 2G. Mean ± SEM are shown. ANOVA was used for statistical analyses. ***, P<0.001.
Ultimately, the strategy of co-targeting EGFR, MEK and YAP/TEAD to enhance the initial treatment efficacy in EGFR mutant NSCLC and limit the establishment of the dormant state, will need to be tested in a clinical trial. Although EGFR and MEK inhibitors can be administered together (NCT03392246; Ramalingam et al., 2019), 3 drug combinations raise the concern for toxicity. Auspiciously, YAP appears dispensable for normal homeostasis in many adult organs, suggesting that targeting YAP might be well tolerated (Zanconato et al., 2016). Also, as our findings reveal, the main role of YAP1 loss is in enhancing the initial apoptotic effect of EGFR/MEK inhibition. Thus, it is plausible that a 3-drug combination would be necessary only transiently, followed by a two-drug treatment, thus reducing potential toxicity. In support of this approach, we observed identical potency when we treated PC-9 cells for one week with OT/XAV939 or MYF-01–37 followed by two weeks of OT compared to a 3-week continuous OT/XAV939 or MYF-01–37 treatment (Figure 8D). The potential different treatment approaches will need to undergo clinical evaluation to determine both their efficacy and toxicity.
STAR Methods text
LEAD CONTACT AND MATERIALS AVAILABILITY
Further information and requests for resources and reagents should be directed to and will be fulfilled by the Lead Contact, Pasi A. Jänne (Pasi_Janne@dfci.harvard.edu). All unique/stable reagents generated in this study are available from the Lead Contact with a completed Materials Transfer Agreement.
EXPERIMENTAL MODEL AND SUBJECT DETAILS
Animal models
Xenograft studies: Female NCr nude mice, 7-weeks old (for PC-9 studies) and female NSG mice, 6-weeks old (HCC4006 and DFCI243) were purchased from Taconic Biosciences, Inc. and The Jackson Laboratory, respectively. Animals were allowed to acclimate for at least 5 days before initiation of the study. All in vivo studies were conducted at Dana-Farber Cancer Institute with the approval of the Institutional Animal Care and Use Committee in an AAALAC accredited vivarium. The cells were harvested, and 5 × 10⁶ cells with 50% Matrigel (Fisher Scientific) were implanted subcutaneously in the right flank of the NCr nude or NSG mice. For efficacy studies, tumors were allowed to establish to 200 ± 50 mm3 in size before randomization into various treatment groups with 8 mice per group. Osimertinib (10 mg/kg once daily) and trametinib (1 mg/kg once daily) were administered orally as a suspension using 0.5% hydroxypropyl methylcellulose (HPMC) or 0.5% HPMC with 0.2% Tween 80 as vehicle, respectively. Control vehicle treated mice received 0.5% HPMC with 0.2% Tween 80 administered orally. Tumor volumes were determined from caliper measurements by using the formula V = (length × width2)/2. Tumor sizes and body weight were measured twice weekly. Mice were treated for 28 days, followed by measuring for re-growth of tumors. For the single-cell RNA-sequencing and immunohistochemical analysis of in vivo MRD tumors, PC-9 cells were implanted as above. When the tumors reached an average of 200 ± 50 mm3, the mice were randomly assigned to receive either vehicle, 10 mg/kg osimertinib, or 10 mg/kg osimertinib and 1 mg/kg trametinib (3 mice / group). The mice were treated orally once daily for 21 days. After treatment, the tumors were harvested and kept on ice in RPMI-1640 (Gibco), 10% FBS, and 1% penicillin/streptomycin (Gibco) until processing for single-cell RNA-sequencing, or formalin fixed for IHC. For the analysis of BMF expression in vivo, 6 mice/cell line were implanted as above. When the tumors reached an average of 350 ± 50 mm3, the mice were randomly assigned to receive either vehicle or 10 mg/kg osimertinib and 1 mg/kg trametinib (3 mice / group). The mice were treated orally once daily for 3 days, and tumors were harvested 3 hours after the final dose. Tumors were snap-frozen and kept in −80°C until analysis.
Studies using the EGFRL858/T790M mouse model: All breeding, mouse husbandry, and in vivo experiments were performed with the approval of Dana-Farber Cancer Institute Animal Care and Use Committee. Tumors in the EGFRL858R/T790M mice (Zhou et al., 2009) were induced by 5 × 10⁷ pfu adenovirus expressing Cre Recombinase protein (Cat # VVC-U of Iowa-5, University of Iowa adenoviral core) at 6–8 weeks old and monitored by MRI to quantify lung tumor burden before being assigned to various treatment study cohorts. Mice were treated with either osimertinib or in combination with selumetinib and the lung tumors burden were quantified by MRI imaging before and after the drug treatment. Osimertinib was administered as 5mg/kg once daily through oral gavage and selumetinib was administered twice daily at 50 mg/kg through oral gavage using 0.5% HPMC as vehicle. For efficacy study, the treatment was continued until 4 weeks then withdrawn. The mice were maintained and monitored by MRI for tumors relapse and humanely euthanized at endpoint. For short term study in order to acquire residual tumors samples, mice were euthanized and samples harvested after treating with osimertinib until MRI imaging showed no visible tumor (2 weeks).
Cell line authentication
293T cells and the NSCLC cell lines PC9, HCC827, HCC4006, HCC2279, H1975, H3122, EBC-1 and the patient-derived DFCI243 cell line were grown in RPMI-1640 (Gibco), 10% FBS, and 1% penicillin/streptomycin (Gibco). The HCC827 and HCC2279 cells were obtained from Dr. Adi Gazdar (UT Southwestern, Dallas, TX) in 2004. The PC9 cells were obtained from Dr. Kazuto Nishio (Kindai University, Osaka, Japan) in 2005. The H3122 cells were a kind gift from Dr. Bruce Johnson (Dana-Farber Cancer Institute, Boston, MA) in 2002. HCC4006 (CRL-2871), H1975 (CRL-5908), and 293T/17 (CRL-11268) cells were purchased from ATCC. EBC-1 cells were purchased from Japanese Collection of Research Bioresources (JCRB0820). DFCI243 and HCC827 GR6 (Engelman et al., 2007) cell lines were established in the Jänne laboratory. Cell line identity was confirmed by fingerprinting for the following cell lines: HCC4006, PC9, HCC827, HCC2279, and H3122. EBC-1, H1975 and 293T cells were purchased in 2015, 2016, 2017 respectively, and were not fingerprinted.
Patient Specimen
The patient included in the study provided written informed consent for the use of the specimen and the studies were performed in accordance with the Declaration of Helsinki, and approved by the Dana-Farber Cancer Institute Institutional Review Board. The patient, a 52-year old male, was diagnosed with stage IV EGFR exon 19 deletion NSCLC from a thoracentesis. He was enrolled in clinical trial (NCT03392246) combining osimertinib and selumetinib as his first systemic treatment for advanced EGFR-mutant NSCLC. Eleven months later, following a sustained partial response, the patient underwent surgical resection (left upper lobe wedge resection (the sample analyzed in this study)).
METHOD DETAILS
All in vitro experiments were performed in sub-confluent cell cultures to avoid artefactual observations due to YAP regulation by cell-cell contacts.
Expression Vectors
All YAP1 constructs used in this study harbor the cDNA encoding 488 amino acid YAP1 isoform (Sudol, 2012). Wild-type YAP1 and YAP1-WWmut cDNAs were amplified (Phusion® High-Fidelity PCR Master Mix with HF Buffer, New England Biolabs) from p2xFlagCMV2-YAP2 and p2xFlagCMV2-YAP2-1st&2nd WW mutant plasmids (gifts from Marius Sudol, Addgene plasmids #19045 and #19048, respectively) and subcloned into pDNR-dual (BD Biosciences) using SalI and XbaI restriction sites. pDNR-dual-YAP1-S94A and pDNR-dual-YAP1SH3bm were created by amplifying the mutation sites from pLX304-YAP1(S94A) and pLX304-YAP1_SH3bm plasmids (gifts from William Hahn, Addgene plasmids #59145 and #59141, respectively) using primers 5’-ATCAACGGGACTTTCCAAAATGTCG-3’ and 5’-TTTTTTTCTAGACTATAACCATGTAAGAAAGCTTTCTTTA-3’ and subcloning the amplified regions into pDNR-Dual-YAP1 using BamHI and XbaI restriction sites. Because the pLX304-YAP1(S94A) and pLX304-YAP1_SH3bm contain the YAP1–504 isoform, a 48 base pair region from pDNR-Dual-YAP1S94A and pDNR-Dual-YAP1SH3bm was subsequently deleted to create the YAP1–488 isoforms. The deletions were done by PCR using primers 5’-GAGTTAGCCCTGCGTAGCCA-3’ and 5’-CTGCCGAAGCAGTTCTTGCT-3’ followed by re-ligation of the PCR product. The PDZ-deletion mutant of YAP1 was created by PCR from p2xFlagCMV2-YAP2 using primers 5’-TTTTTTGTCGACCAGAATTGATCTACCATGGACT-3’ and 5’-TTTTTTTCTAGACTAGCTTTCTTTATCTAGCTTGGTG-3’ and subcloning the PCR product into pDNR-dual using SalI and XbaI restriction sites. The YAP1-TAdel cDNA was amplified from pLX304-YAP1_TA (gift from William Hahn, Addgene plasmid #59143) using primers 5’-ATCAACGGGACTTTCCAAAATGTCG-3’ and 5’-TTTTTTTCTAGACTATAACCATGTAAGAAAGCTTTCTGGGCT-3’ and subcloned into pDNR-dual-YAP1 using BamHI and XbaI restriction sites. All YAP1 cDNAs were subsequently shuttled into JP1722 expression vector using the BD Creator System (BD Biosciences).
The TEAD1 C359C mutation was generated into pRK5-myc-TEAD1 backbone (a gift from Kunliang Guan, Addgene plasmid #33109) by PCR using primers 5’-TCCCCAATGAGTGAATATATGATCAAC-3’ and 5’-GCGGTTTATTCGGTATACAAATCG-3’. Both wild-type myc-TEAD1 and the myc-TEAD1 C359S mutant cDNAs were amplified from the pRK5-backbone using primers 5’-GGGGACAAGTTTGTACAAAAAAGCAGGCTTCGCCACCATGGAGCAAAAGCTCATCTCAG-3’ and 5’-GGGGACCACTTTGTACAAGAAAGCTGGGTCAGTCCTTTACAAGCCTGTAAATATG-3’ and shuttled into the pLEX307 lentiviral vector (a gift from David Root, Addgene plasmid #41392) using the Gateway cloning technology (Invitrogen).
The TBS-mCherry vector has been described previously (Mohseni et al., 2014).
Cell growth and viability assays
For figures 1A and 1C, 350 cells/well were plated into 96-well plates and treated as indicated in the figures (n=60 wells / condition). Medium with fresh drugs was changed every 3–5 days. The confluency of the wells was determined weekly using the Incucyte FLR live cell analysis system (Essen Bioscience). For figure S1B, cells were plated and treated as above, and the wells were manually scored as positive when the confluence was above 50 % and assessed weekly (Tricker et al., 2015). For figure S1C, 78 000 PC-9 cells were plated into T25 flasks and treated the next day as indicated. Cell proliferation was monitored using Incucyte HD live cell analysis system (Essen Bioscience) by imaging 32 sectors in the T25 flask. For all other long-term growth assays (≥10 days), 1000 cells/well were plated into 96-well plates and treated as indicated in the figures (n=5–12 wells / condition). The confluency of the wells was determined daily using Incucyte HD. Endpoint cell viability assays were performed using Cell Titer Glo (Promega) according to manufacturer’s instructions.
To determine number of dormant cells after treatment, viable cells were manually counted from the Incucyte images. A total of 10–12 wells with 3 images per well was analyzed for each condition.
Western blotting and antibodies
If not specified below, cells were plated at 15 × 104 cells / cm2, treated the next day (if applicable) and lysed at specified timepoints in RIPA buffer (Boston Bioproducts) supplemented with cOmplete Mini EDTA-free Protease inhibitor cocktail (Roche) and PhoSTOP phosphatase inhibitor cocktail (Roche). Twenty micrograms of total protein was used for immunoblotting according to the antibody manufacturer’s recommendations. For the assessment of protein levels in dormant cells, 13 × 104 cells / cm2 were plated into 2 × 15 cm dishes. Cells were treated the next day and medium with fresh drugs was changed every 3–5 days. Cells were trypsinized at specified timepoints, washed with ice-cold PBS, and the cell pellets were lysed and immunoblotted as above.
Cellular Barcoding
PC-9 cells were transduced with the EvoSeq barcode library (Feldman et al., 2019) and bottlenecked to a complexity of approximately 500,000 barcodes. The barcoded cells were plated into five replicates per treatment, 5×10⁶ cells per replicate. The cells were then treated with 300nM gefitinib, 100nM osimertinib, or 100nM osimertinib + 30nM trametinib for 3 weeks to establish the residual cell populations. After treatment, the cells were harvested and the genomic DNA was extracted, the barcode-containing sequences were amplified from the genomic DNA, and prepared for sequencing as described (Feldman et al., 2019). Each library was quantified by Qubit fluorometer, Agilent TapeStation 2200, and RT-qPCR using the Roche Kapa Biosystems library quantification kit according to manufacturer’s protocols. Uniquely indexed libraries were multiplexed in equimolar ratios into two pools — one pool of twelve libraries and the other of thirteen libraries — and sequenced on two Illumina NextSeq500 runs with paired-end 75bp reads by the Dana-Farber Cancer Institute Molecular Biology Core Facilities. Quantification of the barcode abundance and barcode clustering were performed within each replicate using the software package Starcode (v1.3) with default parameters (Zorita et al., 2015). Only clusters with abundance 2 or larger were retained for further analysis. The 500 most abundant barcodes in each sample were used for the downstream analyses (Bhang et al., 2015).
RNA extraction and quantitative PCR (QPCR)
Cells were plated at 15 × 104 cells / cm2, treated the next day, and RNA samples were extracted at specified timepoints using the RNeasy Mini kit (Qiagen). The RNA concentrations were measured with Nanodrop (Thermo Fisher Scientific) and 1 μg of total RNA was used for cDNA synthesis using the QuantiTect Reverse Transcription Kit (Qiagen). The QPCR reactions were set up in 20 μl using Taqman Gene Expression Master Mix (Thermo Fisher Scientific, cat. 4369016), Taqman Gene Expression Assays (Thermo Fisher Scientific) as per manufacturer’s instructions, and 2 μl of 1:10 diluted cDNA. The following Taqman Gene Expression Assays were used in the study: CTGF (Hs01026927_m1), ANKDR1 (Hs00173317_m1), BMF (Hs00372937_m1), SNAI1 (Hs00195591_m1), SNAI2 (Hs00161904_m1), TWIST1 (Hs00361186_m1), TWIST2 (Hs02379973_s1), ZEB1 (Hs00232783_m1), ZEB2 (Hs00207691_m1), and ACTB (Hs01060665_g1). The reactions were run in StepOne Plus Real-time PCR System (Applied Biosystems) using default reaction settings. The gene expression levels were normalized to ACTB housekeeping gene expression levels in each sample.
For the analysis of BMF expression in vivo, RNA was extracted from 25–30 mg of snap-frozen tumor samples using RNeasy Mini kit according to the kit protocol. Reverse transcription and gene expression analyses were performed as above.
RNA-sequencing
To analyze gene expression changes associated with dormancy, PC-9, HCC827 and HCC4006 cells were plated at 15 × 104 cells / cm2 into 10 cm plates (DMSO treated control cells) or into 15 cm plates (dormant cells). The next day, cells were treated either with DMSO or with the combination of 100 nM osimertinib and 30nM trametinib in duplicate. DMSO-treated control cells were harvested 24h later, and the dormant cells after 2 weeks of treatment. At these timepoints, cells were lysed into TRIzol and RNA extraction was performed according to the manufacturer’s protocol.
In order to analyze YAP1 KO –associated gene expression changes, PC-9 and HCC4006 CTRL and YAP1 KO cells were plated into 10 cm dishes at 15 × 104 cells / cm2. The next day, the cells were treated with DMSO or with the combination of 100 nM osimertinib and 30nM trametinib in triplicate. After 24 hours, the cells were lysed into TRIzol and RNA extraction was performed according to the manufacturer’s protocol.
Libraries were prepared using Illumina TruSeq Stranded mRNA sample preparation kits from 500ng of purified total RNA according to the manufacturer’s protocol. The finished dsDNA libraries were quantified by Qubit fluorometer, Agilent TapeStation 2200, and RT-qPCR using the Kapa Biosystems library quantification kit according to manufacturer’s protocols. Uniquely indexed libraries were pooled in equimolar ratios and sequenced on an Illumina NextSeq500 with single-end 75bp reads by the Dana-Farber Cancer Institute Molecular Biology Core Facilities. Sequenced reads were aligned to the UCSC hg19 reference genome assembly and gene counts were quantified using STAR (v2.5.1b). Differential gene expression testing was performed by DESeq2 (v1.10.1) and normalized read counts (FPKM) were calculated using cufflinks (v2.2.1). RNAseq analysis was performed using the VIPER snakemake pipeline (Cornwell et al., 2018).
Gene set enrichment analyses from the RNA-seq data were performed according to the instructions (http://www.broadinstitute.org/gsea/index.jsp).
Senescence-associated β-galactosidase staining
PC-9, HCC827 and HCC4006 were plated into 6-well plates at 50 000 cells / well, and treated the next day with DMSO, 100 nM osimertinib or with the combination of 100 nM osimertinib and 30nM trametinib in triplicate. DMSO-treated control cells were stained after 72h, and osimertinib and osimertinib/trametinib -treated cells were stained after 10-day treatment using Senescence β-Galactosidase Staining Kit (Cell signaling #9860) according to manufacturer’s protocol. After staining, cells were imaged (5 images / well), and stained cells were manually counted from the images.
Cytokine profiling
Multiplex assay was performed using the Human Cytokine/Chemokine Magnetic Bead Panel (Millipore cat# HCYTMAG-60K-PX30) on a Luminex MAGPIX system (Millipore). Conditioned media concentration levels of each protein were derived from 5-parameter curve fitting models. Protein levels were normalized to cell number in each well.
Immunofluorescence staining and imaging
Cells grown on coverslips were washed with PBS and fixed with 4 % PFA for 10 minutes. The cells were then permeabilized with 0.1 % Triton-X-PBS, followed by a blocking step in 1 % BSA-PBS. The cells were incubated for 60 minutes with Anti-Histone H3 (tri methyl K9) antibody (Abcam ab8898, 1:300) (Figure 1K) or with anti-YAP (Cell Signaling #14074, 1:200) (Figure 3B), washed 3 times with PBS, incubated with Alexa Fluor 488® -conjugated secondary antibody (A-11008, Life Technologies, 1:300) for 45 minutes, and washed 3 times with PBS. The nuclei were counterstained with 1 μg/ml DAPI (Cell Signaling #4083). The coverslips were mounted using Immu-Mount reagent (Thermo Scientific). Images from H3K9Me3-stainings were acquired using Leica SP5 X confocal microscope (Confocal and Light Microscopy Core, DFCI). Images from YAP stainings were acquired using Nikon eclipse 80i microscope. Image analysis was performed using ImageJ software. For H3K9Me3, images were segmented using standard thresholding parameters and objects were automatically counted using ImageJ Analyze particles-plugin. For the analysis of YAP nuclear localization, the Intensity Ratio Nuclei Cytoplasm Tool –plugin for ImageJ was used.
ATAC-sequencing
PC-9 cells were plated at 15 × 104 cells / cm2 into 15 cm plates, and treated the next day with DMSO, 100 nM osimertinib or with the combination of 100 nM osimertinib and 30nM trametinib in triplicate. DMSO-treated control cells were harvested 24h later. Osimertinib and osimertinib/trametinib -treated cells were harvested after 2 weeks of treatment. Rebound samples were obtained by withdrawing drugs from 3 additional osimertinib/trametinib -treated plates and harvesting the cells once the plates reached 60–70% confluence. Cells were trypsinized at timepoints, and cryopreserved in FBS + 8% DMSO in −80C until processing. After all samples were harvested, 50000 cells / sample were resuspended in 1 ml of cold ATAC-seq resuspension buffer (RSB; 10 mM Tris-HCl pH 7.4, 10 mM NaCl, and 3 mM MgCl2 in water). Cells were centrifuged at max speed for 5 min in a pre-chilled (4 C) fixed-angle centrifuge. After centrifugation supernatant was carefully aspirated. Cell pellets were then resuspended in 50 μl of ATAC-seq RSB containing 0.1% NP40, 0.1% Tween-20, and 0.01% digitonin by pipetting up and down 3 times. This cell lysis reaction was incubated on ice for 3 min. After lysis, 1 ml of ATAC-seq RSB containing 0.1% Tween-20 (without NP40 or digitonin) was added, and the tubes were inverted to mix. Nuclei were then centrifuged for 5 min at max speed in a pre-chilled (4 C) fixed-angle centrifuge. Supernatant was removed and nuclei were resuspended in 50 μl of transposition mix (Corces et al., 2017): 2.5 μl transposase (100 nM final), 16.5 μl PBS, 0.5 μl 1% digitonin, 0.5 μl 10% Tween-20, and 5 μl water) by pipetting up and down six times. Transposition reactions were incubated at 37 C for 30 min in a thermomixer with shaking at 1,000 r.p.m. Reactions were cleaned up with Qiagen columns. Libraries were amplified as described previously (Buenrostro et al., 2015). 36-bp paired-end reads were sequenced on a Nextseq instrument (Illumina).
ChIP-sequencing
PC-9 cells were plated at 15 × 104 cells / cm2 into 15 cm plates, and treated the next day either with DMSO or with the combination of 100 nM osimertinib and 30nM trametinib in duplicate. Cells were trypsinized at after 48h of treamtent, and cryopreserved in FBS + 8% DMSO in −80C until processing. Cells were washed in phosphate-buffered saline (PBS) and crosslinked with 1% Formaldehyde for 10 minutes (H3K27Ac) or crosslinked with two agents starting with 2 mM DSG (Pierce) for 45 min at RT, followed by 1 ml 1% Formaldehyde for 10 min (YAP and TEAD4). Crosslinked Cell lines were quenched with 0.125 M glycine for 5 min at room temperature. After quenching, the material was resuspended in 1% SDS (50 mM Tris-HCl pH8, 10 mM EDTA) and sonicated for 5 minutes with a Covaris E220 instrument, 5% duty cycle, 140 Peak Incident Power, 200 Cycles per burst, in 1ml AFA Fiber milliTUBEs. Soluble chromatin was immunoprecipitated with 10 μg of H3K27ac antibody (Diagenode cat# C15410196), 7 μg of YAP antibody (Cell signaling #14074), 7 μg of SLUG antibody (Cell signaling #9585), or 1.5 μg of TEAD antibody (ab58310, Abcam). 5 μg of chromatin was used for H3K27Ac ChIP, and 40 μg for YAP, TEAD4 and SLUG ChIPs. ChIP-seq libraries were constructed using Accel-NGS 2S DNA library kit from Swift Biosciences. Fragments of the desired size were enriched using AMPure XP beads (Beckman Coulter). 36-bp paired-end reads were sequenced on a Nextseq instrument (Illumina).
ATAC-seq and ChIP-seq analyses
The raw data from ATAC-seq and ChIP-seq was first ran through the ChiLin 2.0.0. pipeline (Qin et al., 2016) for initial quality control and preprocessing. Reads were mapped to human genome (hg19) using Burrows-Wheeler Aligner (Li and Durbin, 2010) and peak calling was performed using MACS2 (Zhang et al., 2008b). The output bedgraph files from MACS2 were converted to bigwig files for visualization in the Integrative Genomics Viewer. Deeptools (Ramírez et al., 2016) was used to create heatmap plots. The PCA plot was generated by using the R package ‘ggbiplot’. HOMER (Heinz et al., 2010) was used for the motif analysis.
CRISPR/CAS9 gene editing
YAP1 knock-outs were performed by CRISPR/CAS9 genome editing using the Alt-R CRISPR-CAS9 system (Integrated DNA Technologies, IDT) and Lonza 4D-Nucleofector (Lonza), following previously described protocol (Richardson et al., 2016). Guide sequences for YAP1 were designed using Deskgen (deskgen.com), and the corresponding Alt-R CRISPR-Cas9 crRNAs (crRNA) were ordered from IDT. The crRNA was hybridized with Alt-R CRISPR-Cas9 tracrRNA (tracrRNA, IDT) by mixing 120 pmol of crRNA with 120 pmol of tracrRNA in 5 μl of CAS9 buffer (20 mM HEPES (pH 7.5), 150 mM KCl, 1 mM MgCl2, 10% glycerol and 1 mM TCEP), incubating the mixture at 95°C for 5 minutes and then letting the mixture cool to room temperature on benchtop (5–10 minutes). 100 pmol of Alt-R® S.p. Cas9 Nuclease V3 (IDT) in 5 μl of CAS9 buffer was slowly added to the crRNA:tracrRNA duplex and the subsequent solution was incubated for 20 minutes in room temperature to allow ribonucleoprotein complex (RNP) formation. The RNP complex was then added to 20 μl of cell suspension containing 300 000 cells suspended in Nucleofector SE Cell line solution (Lonza, cat. V4XC-1032), mixed and 20 μl of the cell/RNP mix was pipetted into one well of a Nucleocuvette Strip (Lonza, cat. V4XC-1032). The reaction mixtures were nucleofected using cell line -specific programs (see below) in the 4D-Nucleofector, and finally transferred to 6-well plates. After 72 hours, the nucleofected cells were single-cell cloned, and loss of YAP protein expression was analyzed from the single-cell clones by western blotting. The guide sequence 5’- TAATAGGCCAGTACTGATGC-3’ was used to create PC-9, HCC4006, and DFCI243 YAP1 KOs. H3122 and EBC-1 YAP1 KOs were created using two guides with sequences 5’- TAATAGGCCAGTACTGATGC-3’ and 5’- GAATGAGCTCGAACATGCTG-3’ simultaneously to ensure high knock-out efficiency. The nucleofected H3122 and EBC-1 cells were not single-cell cloned, and bulk populations were used in the experiments. The nucleofection conditions were optimized using the Cell Line Optimization 4D-Nucleofector X Kit (Lonza, cat. V4XC-9064) following the kit protocol. The optimized programs used were: EN-138 for PC-9 and EBC-1 cells; CA-137 for H3122 cells; CM-137 for HCC4006 and DFCI243. All cell lines were nucleofected in SE Cell line solution. To tag BMF gene with a N-terminal HA-tag in the endogenous locus, PC-9 cells were nucleofected as above in the presence of 150 pmol of single-stranded donor oligonucleotide 5’GCTGAGGGGGCAGTCCAGTAGGCTCTGGGCAAACAGGTCAGCAGAGAGCAAGCT CCCGGGTTGGGTCACCGGCTCCCCATCCTCTGGTTGGAACACATCATCCTCCAGCTC CTCCACACACTGAGATGGCTCAGCGTAATCTGGTACGTCGTATGGGTACATCTCTCC TGTGAGGGGGCAACGCAGGCATCTGGGCTGCT-3’ (Ultramer®, IDT). Single-cell clones were screened for donor integration by PCR using primers 5’- AGAAGGGAAGGGGAGTCCTT-3’ and 5’-CGTAATCTGGTACGTCGTATGGGTA-3’, and positive clones were verified by Sanger sequencing.
Monitoring Caspase-3/7 activity
Cells were plated into 96-well plates at 3000 cells/well in 100 μl of growth medium. The next day, drugs were added onto cells in 50 μl containing CellEvent™ Caspase-3/7 Green ReadyProbes™ Reagent (Molecular Probes) as per manufacturer’s instructions (n=5–6 wells / condition). The wells were subsequently scanned every 2 hours using the Incucyte ZOOM live cell analysis system (Essen Bioscience) typically for a total of 72 hours. The acquired fluorescent signal for activated caspase-3/7 was normalized with well confluency at each timepoint (=normalized apoptosis). Peak apoptosis was determined as the highest normalized caspase-3/7 activity value during the assay.
Determining YAP activity and apoptosis in PC-9 YAP/Hippo reporter cells
3000 cells / well were plated into 96-well plates and treated the next day with the indicated drugs (n=5–6 wells / condition). YAP activity -induced mCherry expression was quantified using the Incucyte ZOOM live-cell analysis system. The mCherry signal was normalized to well confluency at each time point. For simultaneous detection of YAP activity and apoptosis, the cells were plated as above, and treated in the presence of CellEvent™ Caspase-3/7 Green ReadyProbes™ Reagent (Molecular Probes) as per manufacturer’s instructions. The mCherry signal as well as the green fluorescence signal was quantified every 2 hours using Incucyte ZOOM.
To determine the odds ratio for YAPhigh cells undergoing apoptosis in response to osimertinib/trametinib treatment, the number of YAPhigh cells (cells with higher mCherry signal than untreated cells), apoptotic cells (positive for green fluorescence) and apoptotic YAPhigh cells (YAPhigh cells positive for green fluorescence) was determined using the Incucyte ZOOM software. The analyses were done at a single timepoint corresponding to the peak in apoptosis in response osimertinib/trametinib treatment (72–80 hours after the start of treatment, depending on the experiment), and 5–6 wells with 3 images / well were analyzed. From the same images, the total number of cells per image was manually determined. Using these metrics, a contingency table was built for the average number of YAPhigh caspase-3/7 positive, YAPhigh caspase-3/7 negative, YAPl°w, caspase-3/7 positive, and YAPl°w, caspase-3/7 negative cells. The odds ratio was computed in GraphPad Prism 7.04 software, and two-sided Fisher’s exact test was used to analyze statistical significance.
The proportion of YAPhigh dormant cells (Figure 3H) was determined manually from the Incucyte images after 10-day treatment. 5–6 wells with 3 images per well were analyzed.
Viral Transductions
For stable expression of YAP1 or YAP1 mutants, PC-9 YAP1 KO and HCC4006 YAP1 KO cells were transduced with lentivirus according to previously described standard protocol (Bahcall et al., 2016). Transduced cells were selected with 2 μg/ml puromycin. PC-9 YAP/Hippo reporter cells were created by lentiviral transduction of TBS-mCherry YAP/Hippo reporter construct (Mohseni et al., 2014). The subsequent cell pool was flow sorted for EGFP expression to select transduced cells.
Single-cell RNA sequencing
For in vitro samples: 1.5 × 10⁶ PC-9 cells were plated onto T75 flasks. Cells were treated either with DMSO or with 100 nM osimertinib and 30 nM trametinib for 3 weeks. After treatment, the cells were washed with PBS, trypsinized, and loaded onto a 10X Chromium instrument (10X Genomics) per the manufacturer’s instructions. For in vivo samples: Fresh tumor specimens were pooled and minced in a 15 ml conical tube with media (DMEM + 10% FBS), penicillin–streptomycin (Fisher Scientific), 100 U/mL collagenase type IV (Life Technologies) and 2.5 mg/mL DNAse I (Sigma Aldrich), then incubated for 45min at 37°C. Single cell suspensions were isolated by straining through a 40μm filters. Cells were incubated with Zombie Green™ Fixable Viability Kit (BioLegend), blocked with Human TruStain FcX™ (BioLegend), and stained with human anti-EpCAM (clone 9C4). Viable EpCAM+ tumor cells were isolated via FACS Melody instrument (BD Biosciences) according to gating schema (Figure S6A). Cells were loaded onto a 10X Chromium instrument (10X Genomics) per the manufacturer’s instructions.
Single-cell RNA libraries were generated using the Single Cell 3’ Reagent Kit (10X Genomics) per user guide. Quality control of the completed libraries was performed using Bioanalyzer High Sensitivity DNA Kit (Agilent) and then sequenced using the Illumina NextSeq 500 platform by Novogene. The single-cell RNA-Seq data were processed with CellRanger software package (v.3.0.2). Briefly, the bcl files were converted to fastq files, which were aligned to human transcriptome (build GRCh38). After initial filtering with default parameters, the feature matrix generated by Cell Ranger was used to perform downstream analysis using R toolkit Seurat (v.3.0) (Butler et al., 2018). At this step, the cells with mitochondria percentages greater than 20 or expressing less than 200 genes were filtered out.
To characterize cell subpopulations in the samples, we performed the gene signature enrichment analysis for “YAP signature”, “HALLMARK EMT signature” (HALLMARK_EPITHELIAL_MESENCHYMAL_TRANSITI NSITION, MSigDB, http://software.broadinstitute.org/gsea/msigdb/index.jsp), and “FRIDMAN SENESCENCE UP” (MSigDB) signatures. The YAP signature was curated from gene sets obtained from multiple studies (Cordenonsi et al., 2011; Dupont et al., 2011; Wang et al., 2018; Zhang et al., 2009, 2008a). The YAP signature was filtered to include only those genes that were associated with strong YAP binding upon osimertinib/trametinib treatment in PC-9 cells based on the ChIP-Seq data (peaks with ChIP/input enrichment fold-change greater than 10) (Table S1). The enrichment scores for a given gene signature for each cell in a sample were calculated using R package AUCell (Aibar et al., 2017).
Immunohistochemistry
Staining of tumors from EGFRL858/T790M mice (Figure 4E, Figure S6B): Five-micron paraffin sections were stained on a Leica BondRX® autostainer, according to the manufacturers’ instructions, with primary antibodies against F480 (Cell Signaling, cat # 70076S, 1:500), CD4 (Cell Signaling; cat # 25229; 1:100), CD8a (Cell Signaling; cat # 98941S; 1:400), YAP (Cell Signaling; Cat # 14074, 1:200) and TTF1 (Abcam, AB133638, 1:50). Prior to antibody incubation, the sections were heat-retrieved with ER1 buffer (pH 6; Leica AR9961) for 20 minutes (YAP), ER2 (pH 9; Leica AR9640) for 20 minutes (CD4, CD8a, F480) or ER2 for 60 mins (TTF1) (Leica, AR9640) at 100° and then treated for 5 minutes with hydrogen peroxide. Sections were incubated with primary antibodies for 30 minutes (CD4, CD8a, F480, YAP) or 60 minutes (TTF1), followed by Leica anti-rabbit HRP-conjugated polymer, and then developed with DAB, counterstained with hematoxylin (Leica DAB KIT, Cat # DS9800) and mounted with permount.
Staining of the PC-9 xenograft tumors, WZ4002 and WZ4002/trametinib –resistant EGFRL858/T790M mice tumors, and the patient sample (Figure 4D, 4H, 4I): All IHC was performed on the Leica Bond III and RX automated staining platforms. Phospho-ERK (Cell Signaling # 4370) and YAP (Cell Signaling #14074) antibodies were run at 1:150 and 1:200 dilutions, respectively using the Leica Biosystems Refine Detection Kit with citrate antigen retrieval, and chromogenically stained with DAB (Leica Biosystems Refine Detection Kit).
All IHC stainings were quantified using the QuPath software (0.2.0-m4) (Bankhead et al., 2017). The Positive Cell Detection –analysis was used with default settings to detect and quantify cells staining positive for pERK, CD4, CD8, TTF1, or the nuclear staining of YAP. Five individual, randomly selected fields per tumor were quantified. Quantified values from each individual field from all tumors are shown in the graphs to represent the heterogeneity in the tumor samples.
Detection of activated BAX
For the analysis of BAX activation, cells (15 × 104 cells / cm2) growing on 10 cm plates were treated for 24 hours with DMSO or with the combination of 100 nM osimertinib and 30 nM trametinib, and lysed in CHAPS lysis buffer (50 mM Tris-HCl, 1 % CHAPS, 150 mM NaCl, 5 mM EDTA) supplemented with protease and phosphatase inhibitors. 1000 μg of total protein was used for immunoprecipitation with 1 μg of conformation-specific BAX antibody (clone 6A7; MA5–14003, Invitrogen) and 20 μl of Protein A/G PLUS-Agarose beads (Santa Cruz Biotechnology). The lysates were incubated with the antibody and beads overnight at +4°C, after which the beads were washed four times with 1000 μl of CHAPS buffer, resuspended to 50 μl SDS Sample Buffer (Boston Bioproducts), and incubated at +95°C for 5 minutes. Activated BAX was detected by immunoblotting using an antibody detecting total BAX (Cell Signaling #5023). For control, total BAX levels were also determined from total cell lysates.
Detection of mitochondrial cytochrome c release
Cells (15 × 104 cells / cm2) growing on 15 cm plates were treated with the combination of 100 nM osimertinib and 30 nM trametinib for 24 hours, and fractionated into mitochondrial and cytosolic fractions using Cell Fractionation Kit – Standard (ab109719, Abcam) according to the manufacturer’s instructions. Cytochrome c and ATP synthase subunit alpha (mitochondrial marker) was detected from the fractions by immunoblotting using ApoTrack™ Cytochrome c Apoptosis WB Antibody Cocktail (ab110415, Abcam). MEK 1/2 was used as the cytosolic marker (Cell Signaling #9122).
Gene knock-down by siRNA
Cells were plated on 6-well plates at 15 × 104 cells / cm2. The next day, the cells were transfected with 10 nM siRNAs using DharmaFECT 1 (Dharmacon) according to manufacturer’s protocol. Forty-eight hours later, the cells were trypsinized and plated into experiments. The following Dharmacon SMARTpool ON-TARGETplus siRNA pools were used in the analyses: BMF (L-004393-00-0005), SNAI2 (L-017386-00-0005), YAP1 (L-012200-00-0005), and ON-TARGETplus Non-Targeting Pool (D-001810-10-05). Gene knock-down was controlled by western blotting or QPCR 72h after transfection.
Co-immunoprecipitation
PC-9 and HCC4006 cells treated for 48h with either DMSO or with the combination of 100nM osimertinib and 30nM trametinib were lysed in IP buffer (1% Triton-X100, 50mM Tris, 150mM NaCl, pH 7.4) supplemented with cOmplete Mini, EDTA-free Protease inhibitor cocktail (Roche) and PhoSTOP phosphatase inhibitor cocktail (Roche). 1500 μg of total protein was used for immunoprecipitation with Cell Signaling antibodies recognizing endogenous YAP (#14074), TEAD (pan-TEAD) (#13295), or SLUG (#9585) and 20 μl of Protein A/G PLUS-Agarose beads (Santa Cruz Biotechnology; sc-2003). Immunoprecipitations were carried out overnight in +4C, followed by four washes with 1 ml IP buffer. After washes, the beads were re-suspended in SDS Sample Buffer (Boston Bioproducts), and boiled for 5 min. Co-immunoprecipitated proteins were analyzed by western blotting.
Chemistry
Unless otherwise noted, reagents and solvents were obtained from commercial suppliers and were used without further purification. 1H NMR spectra were recorded on 500 MHz (Varian AS600), and chemical shifts are reported in parts per million (ppm, δ) downfield from tetramethylsilane (TMS). Coupling constants (J) are reported in Hz. Spin multiplicities are described as s (singlet), br (broad singlet), d (doublet), t (triplet), q (quartet), and m (multiplet). Mass spectra were obtained on a Waters Micromass ZQ instrument. Preparative HPLC was performed on a Waters Sunfire C18 column (19 mm × 50 mm, 5 μM) using a gradient of 15–95% methanol in water containing 0.05% trifluoroacetic acid (TFA) over 22 min (28 min run time) at a flow rate of 20 mL/min. Purities of assayed compounds were in all cases greater than 95%, as determined by reverse-phase HPLC analysis.
Tert-butyl 3-methyl-3-((3-(trifluoromethyl)phenyl)amino)pyrrolidine-1-carboxylate (2)
To a solution of 1-bromo-3-(trifluoromethyl)benzene (223 mg, 1.0 mmol) and tert-butyl 3-amino-3-methylpyrrolidine-1-carboxylate (200 mg, 1.0 mmol) in 5 mL of toluene was added Pd(OAc)2 (22 mg, 0.1 mmol), XPhos (58 mg, 0.1 mmol) and NaOtBu (192 mg, 2 mmol) under N2. The mixture was stirred at 100 °C overnight. The mixture was filtered. The filtrate was concentrated in vacuo, then purified by flash chromatography on silica gel (hexane: ethyl acetate = 4:1) to provide compound 2 (240 mg, 70%). LC/MS (ESI) m/z = 345 (M + H)+.
3-methyl-N-(3-(trifluoromethyl)phenyl)pyrrolidin-3-amine (3)
To a solution of tert-butyl 3-methyl-3-((3-(trifluoromethyl)phenyl)amino)pyrrolidine-1-carboxylate (240 mg, 0.7 mmol) in 3 mL of methanol was added 4N HCl/dioxane (1 mL) solution. The result solution was stirred at room temperature for 1 h, and then concentrated in vacuo to obtain the product as HCl salt, which was used into next step without any purification. LC/MS (ESI) m/z = 245 (M + H)+.
1-(3-methyl-3-((3-(trifluoromethyl)phenyl)amino)pyrrolidin-1-yl)prop-2-en-1-one (MFY-1–37)
To a solution of 3-methyl-N-(3-(trifluoromethyl)phenyl)pyrrolidin-3-amine (28 mg, 0.1 mmol) and DIEA (33 uL, 0.2 mmol) in 1 mL of acetonitrile was added acryloyl chloride dropwise at 0 °C until the reaction completed. The mixture was diluted with dichloromethane, washed with 1 N NaHCO3 solution and brine. The organic layer was dried over sodium sulfate, concentrated in vacuo and then purified by prep-HPLC (MeOH/H2O, 0–100%) to provide the title compound (23.4 mg, 79%). LC/MS (ESI) m/z = 299 (M + H)+. 1H NMR (500 MHz, DMSO-d6) δ 7.28 (t, J = 8.0 Hz, 1H), 6.98 – 6.87 (m, 2H), 6.83 (d, J = 7.4 Hz, 1H), 6.56 (ddd, J = 18.1, 16.8, 10.3 Hz, 1H), 6.21 (d, J = 4.3 Hz, 1H), 6.12 (ddd, J = 16.8, 6.6, 2.4 Hz, 1H), 5.66 (ddd, J = 10.3, 8.8, 2.4 Hz, 1H), 3.87 – 3.73 (m, 1H), 3.71 – 3.59 (m, 1.5H), 3.53 – 3.43 (m, 1H), 3.39 (d, J = 12.3 Hz, 0.5H), 2.36 – 2.16 (m, 1H), 2.08 – 1.85 (m, 1H), 1.42 (s, 3H).
MYF-01–37 docking to TEAD2
MYF-01-037-02 was docked into TEAD2 crystal structure (pdbcode: 5HGU) using Glide covalent docking program (version 2019 release 1). The Cys380 was defined as the reactive residue for Michael addition reaction. Default parameter values were used for docking calculation. Prior to docking, the protein structure was processed and energy optimized using protein preparation protocol in Schrodinger suite software.
MYF-01–37 competition pulldown
Cells were treated with test compounds for 6 h at the indicated doses. Total cell lysates were prepared using pulldown buffer (50 mM Tris, pH 7.4, 250 mM NaCl, 5 mM EDTA, 50 mM NaF, 1 mM Na3VO4, 1% NP40, 0.02% NaN2, 1 mM PMSF and protease inhibitor cocktail). To pull down TEADs, 1mg of total protein was combined with biotinylated MYF-01–37 at 1 μM and rotated at 4 °C for 6 hrs followed by RT for 1 h. Subsequently, streptavidin agarose resin (30 μl 50% slurry) was added and samples rotated for another 2 h at 4 °C. The resin was subsequently washed 3x with pulldown buffer, and TEADs released from the resin by boiling for 10 min in 2x gel loading buffer and resolved by western blotting. As a loading control, 25 μg of total protein was used.
Mass Spectrometry Analysis
TEAD2 protein was incubated with DMSO or a 20-fold molar excess of MYF-01–37 for 6 hours at 37 °C. Reactions were then analyzed by LC-MS using a Shimadzu autosampler and LC (Marlborough, MA) coupled to an LTQ ion trap mass spectrometer (ThermoFisher Scientific, San Jose, CA). Protein was injected onto a self packed column (0.5 mm I.D., packed 5 cm POROS 50R2 from Applied Biosystems, Framingham, MA), desalted for 4 minutes with 100% A (A=0.2 M acetic acid in water), eluted with a gradient (0–100% B in 1 minute; A=0.2 M acetic acid in water, B=0.2 M acetic acid in acetonitrile), and introduced to the mass spectrometer by electrospray ionization (spray voltage=4.5 kV). The mass spectrometer acquired full scan MS data (m/z 300–2000). Mass spectra were deconvoluted using MagTran version 1.03b2 (Zhang and Marshall, 1998).
To identify the site of modification, labeled protein was diluted 1:1 with 100 mM ammonium bicarbonate, reduced with 10 mM DTT at 56 °C for 30 minutes, alkylated with 22.5 mM IAA for 30 minutes at room temperature, and then digested with trypsin overnight at 37 °C. Tryptic peptides were desalted by C18 (SOLA, ThermoFisher Scientific), dried by vacuum centrifugation, reconstituted in 5% MeCN, 0.1% trifluoroacetic acid, and analyzed by nanoLC-ion mobility MS/MS using a NanoAcquity UPLC system (Waters Corp., Milford, MA) interfaced to a timsTOF Pro mass spectrometer (Bruker, Billerica, MA). Peptides were injected onto a self-packed pre-column (4 cm POROS10R2, Applied Biosystems), resolved on an analytical column (30 μm I.D. × 50 cm Monitor C18, Orochem, Naperville, IL; 10–60% B in 40 minutes; A = 0.2 M acetic acid in water, B = 0.2 M acetic acid in acetonitrile) and introduced to the mass spectrometer by electrospray ionization using a captive spray ion source (spray voltage = 2 kV). The mass spectrometer collected ion mobility MS spectra over a mass range of m/z 100–1700 and 1/k0 of 0.6 to 1.6, and then performed 10 cycles of PASEF MS/MS with a target intensity of 20k and a threshold of 250. Active exclusion was enabled with a release time of 0.4 minutes. Raw data was converted to .mgf using the tdf to mgf converter (Bruker), and searched using Mascot 2.6.1 against a forward reversed human refseq database (NCBI). Search parameters specified a precursor mass tolerance of 20 ppm, a product ion tolerance of 50 mmu, fixed carbamidomethylation of cysteine, and variable oxidation of methionine as well as variable MYF-1–37 modification of cysteine. Search results were downloaded and converted to xls using multiplierz software (Alexander et al., 2017) , and peptide fragment ions were assigned using mzStudio (Ficarro et al., 2017). Inhibitor related fragment ions were assigned as described (Ficarro et al., 2016).
YAP-TEAD Split Gaussia Luciferase (SGL) Assay
The SGL assay monitors real-time cell-based protein-protein interaction between YAP and TEAD, as physical proximity between both proteins would result in luciferase signal reconstitution. 293T cells were plated in 24-well plates and transfected with N-GLuc-YAP and C-GLuc-TEAD using TransIT-293 (Mirus Bio). The pCMV-Red Firefly Luc Vector (Life Technologies) was used as an internal control. Cells were treated with indicated concentrations of compounds or vehicle control (DMSO) in duplicates. Luciferase activity was measured by Dual-Luciferase Assay (Promega, Madison, WI) according to the manufacturer’s manual.
QUANTIFICATION AND STATISTICAL ANALYSIS
Statistical Analyses
When comparing two groups, statistical significance was calculated by two-tailed unpaired t-test with Welch’s correction. One-way ANOVA with Dunnett’s multiple comparisons test was used when comparing 3 or more groups. Fisher’s exact test (two-sided) was used to analyze statistical significance for the odds ratio for YAPhigh cells undergoing apoptosis in response to osimertinib/trametinib treatment (Figure 3D). Kolmogorov-Smirnov Test was used to assess significance in single-cell RNA-seq analyses (Figure 4C). The statistical tests used are indicated in the figure legends. All statistical analyses were generated using GraphPad Prism 7.04 software, except for Figure 4C where statistical analyses were run in R. Data are presented as mean ± standard deviation or standard error, as indicated in the figure legends. A p-value that was less than 0.05 was considered significant in all analyses. Any cutoffs used for the p-value or FDR are indicated in the figure legends. All analyses were performed with 3–12 replicates as indicated in the Method Details. In animal experiments n represents the number of animals in treatment groups.
DATA AND CODE AVAILABILITY
The datasets generated during this study are available at GEO under accession number GSE131604.
Supplementary Material
Movie S1. Related to Figure 1. PC-9 cells were treated with a combination of osimertinib and trametinib for 25 days followed by drug washout. Cells were imaged every 2 hours for a total of 40 days using the Incucyte FLR live-cell imaging system.
Table S1. Related to Figure 4. YAP signature used for single-cell RNA-seq analysis.
Scheme 1: Synthesis of MYF-1–37.
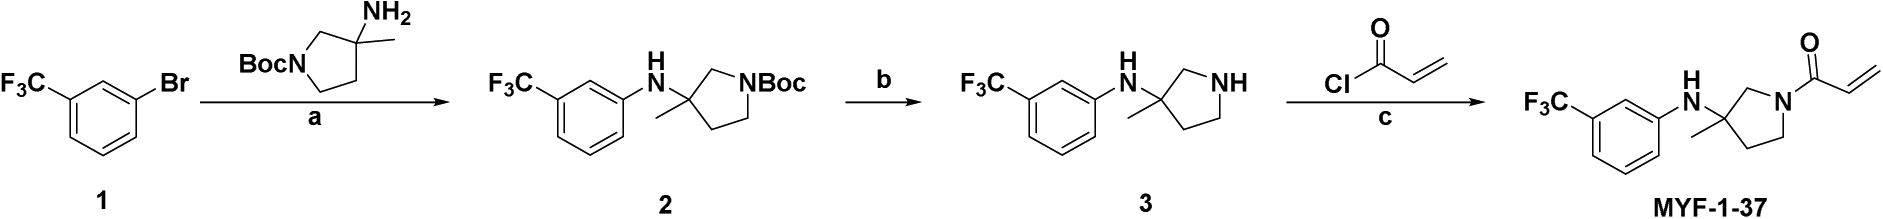
aReagents and conditions: (a) Pd(OAc)2, XPhos, NaOtBu, toluene, 100 °C ; (b) HCl/dioxane, MeOH; (c) DIEA, MeCN, 0°C
KEY RESOURCES TABLE
| REAGENT or RESOURCE | SOURCE | IDENTIFIER |
|---|---|---|
| Antibodies | ||
| Rabbit monoclonal (D17A5) anti-phosphorylated EGFR | Cell Signaling | Cat#3777; RRID: AB_2096270 |
| Rabbit anti-EGFR | Cell Signaling | Cat#2232; RRID: AB_331707 |
| Rabbit monoclonal (193H12) anti-phosphorylated AKT | Cell Signaling | Cat#4058; RRID: AB_331168 |
| Rabbit anti-AKT | Cell Signaling | Cat#9272; RRID: AB_329827 |
| Rabbit monoclonal (D13.14.4E) anti-phosphorylated ERK | Cell Signaling | Cat#4370; RRID: AB_2315112 |
| Rabbit anti-ERK | Cell Signaling | Cat#9102; RRID: AB_330744 |
| Rabbit anti-phosphorylated S6 | Cell Signaling | Cat#2215; RRID: AB_331682 |
| Rabbit monoclonal (5G10) anti-S6 | Cell Signaling | Cat#2217; RRID: AB_331355 |
| Mouse monoclonal (DM1A) anti-Tubulin | Sigma | Cat#T9026; RRID: AB_477593 |
| Rabbit anti-H3K9Me3 | Abcam | Cat#Ab8898; RRID: AB_306848 |
| Rabbit monoclonal (D8H1X) anti-YAP | Cell Signaling | Cat#14074; RRID: AB_2650491 |
| Rabbit monoclonal (D7D2Z) anti-CD4 | Cell Signaling | Cat#25229; RRID: AB_2798898 |
| Rabbit monoclonal (D4W2Z) anti-CD8α | Cell Signaling | Cat#98941; RRID: AB_2756376 |
| Rabbit monoclonal (EPR8190–6) anti-TTF1 | Abcam | Cat# ab133638; RRID: AB_2734144 |
| Rabbit monoclonal (C34C5) anti-BIM | Cell Signaling | Cat#2933; RRID: AB_1030947 |
| Mouse monoclonal (6E2) anti-HA | Cell Signaling | Cat#2367; RRID: AB_10691311 |
| Rabbit monoclonal (C19G7) anti-SLUG | Cell Signaling | Cat#9585; RRID: AB_2239535 |
| Rabbit monoclonal (D3F7L) anti-pan-TEAD | Cell Signaling | Cat#13295;’ RRID: AB_2687902 |
| Rabbit monoclonal anti-TEAD4 | Abcam | Cat#ab58310; RRID: AB_945789 |
| Rabbit anti-H3K27Ac | Diagenode | Cat#C15410196; RRID: AB_2637079 |
| Rabbit monoclonal (9B11) anti-Myc-tag | Cell Signaling | Cat#2276; RRID: AB_331783 |
| Rabbit anti-HSP90 | Santa Cruz | Cat#sc-7947; RRID: AB_2121235 |
| Rabbit monoclonal (D7C1M) anti-p16 | Cell Signaling | Cat#80772; RRID: AB_2799960 |
| Rabbit monoclonal (12D1) anti-p21 | Cell Signaling | Cat#2947; RRID: AB_823586 |
| Rabbit monoclonal (D69C12) anti-p27 | Cell Signaling | Cat#3686; RRID: AB_2077850 |
| Rabbit monoclonal (D9W2) anti-phosphorylated YAP | Cell Signaling | Cat#13008; RRID: AB_2650553 |
| Rabbit anti-phosphorylated LATS1 (S909) | Cell Signaling | Cat#9157; RRID: AB_2133515 |
| Rabbit monoclonal (D57D3) anti-phosphorylated LATS1 (T1079) | Cell Signaling | Cat#8654; RRID: AB_10971635 |
| Rabbit monoclonal (C66B5) anti-LATS1 | Cell Signaling | Cat#3477; RRID: AB_2133513 |
| Rabbit monoclonal (54H6) anti-BCL-XL | Cell Signaling | Cat#2764; RRID: AB_2228008 |
| Rabbit monoclonal (D55G8) anti-BCL-2 | Cell Signaling | Cat#4223; RRID: AB_1903909 |
| Rabbit monoclonal (D5V5L) anti-MCL1 | Cell Signaling | Cat#39224; RRID: AB_2799149 |
| Rabbit monocklonal (31H4) anti-BCL-w | Cell Signaling | Cat#2724; RRID: AB_10691557 |
| Rabbit monoclonal (D2E11) anti-BAX | Cell Signaling | Cat#5023; RID: AB_10557411 |
| ApoTrack™ Cytochrome c Apoptosis WB Antibody Cocktail | Abcam | Cat#ab110415 |
| Mouse anti-activaed BAX | Incvitrogen | Cat#MA5–14003; RRID: AB_10979735 |
| Rabbit anti-MEK | Cat#9122; RRID: AB_823567 | |
| Goat anti-rabbit HRP-linked antibody | Cell Signaling | Cat#7074; RRID: AB_2099233 |
| Horse anti-mouse HRP-linked antibody | Cell Signaling | Cat#7076; RRID: AB_330924 |
| Goat anti-Rabbit IgG (H+L) Cross-Adsorbed Secondary Antibody, Alexa Fluor 488 | Life Technologies | Cat# A-11008; RRID: AB_143165 |
| Chemicals, Peptides, and Recombinant Proteins | ||
| Osimertinib (in vivo) | MedChemExpress | Cat#HY-15772A |
| Osimertinib (in vitro) | Selleck Chem | Cat#S7297 |
| Trametinib | Selleck Chem | Cat#S2673 |
| XAV939 | Selleck Chem | Cat#S1180 |
| Selumetinib | Selleck Chem | Cat#1008 |
| MYF-01–37 | Synthesized at DFCI | N/A |
| Reversible control of MYF-01–37 | Synthesized at DFCI | N/A |
| TED-347 | Synthesized at DFCI | N/A |
| Reversible control of TED-347 | Synthesized at DFCI | N/A |
| ZSTK474 | Selleck Chem | Cat#S1072 |
| NVP-BEZ235 | Cayman Chemicals | Cat#10656 |
| AZD2014 | Selleck Chem | Cat#S2783 |
| Ruxolitinib | Selleck Chem | Cat#S1378 |
| Saracatinib | Cayman Chemicals | Cat#11497 |
| BMS-345541 | Cayman Chemicals | Cat#16667 |
| Sotrastaurin | Cayman Chemicals | Cat#16726 |
| Galunisertib | Cayman Chemicals | Cat#15312 |
| Gefitinib | Selleck Chem | Cat#S1025 |
| Crizotinib | Selleck Chem | Cat#S1068 |
| Cisplatin | Selleck Chem | Cat#S1166 |
| DAPT (GSI IX) | Selleck Chem | Cat#S2215 |
| LY451039 | Selleck Chem | Cat#S1594 |
| Alt-R® S.p. Cas9 Nuclease V3 | Integrated DNA Technologies | Cat#1081059 |
| Critical Commercial Assays | ||
| Quantitect Reverse Transcription Kit | Qiagen | Cat#205313 |
| TaqMan Gene expression MasterMix | Thermo Fisher Scientific | Cat#4369016 |
| RNeasy Mini Kit | Qiagen | Cat#74104 |
| Gateway™ LR Clonase™ II Enzyme mix | Invitrogen | Cat# 11789020 |
| Gateway™ BP Clonase™ II Enzyme mix | Invitrogen | Cat# 11791020 |
| Phusion® High-Fidelity PCR Master Mix with HF Buffer | New England Biolabs | Cat# M0531 |
| Senescence β-Galactosidase Staining Kit | Cell Signaling | Cat#9860 |
| CellEvent™ Caspase-3/7 Green ReadyProbes™ Reagent | Molecular Probes | Cat#R37111 |
| CellTiter-Glo® Luminescent Cell Viability Assay | Promega | Cat#G7570 |
| Cell Line Optimization 4D-Nucleofector X Kit | Lonza | Cat# V4XC-9064 |
| SE Cell Line 4D-NucleofectorTM X Kit S | Lonza | Cat# V4XC-1032 |
| Deposited Data | ||
| RNA-seq | This paper | GSE131604 |
| ATAC-seq | This paper | GSE131604 |
| ChIP-seq | This paper | GSE131604 |
| Single-cell RNA-seq | This paper | GSE131604 |
| Experimental Models: Cell Lines | ||
| PC-9; human EGFR-mutant NSCLC, male | Dr. Kazuto Nishio (Kindai University, Osaka, Japan) | Fingerprinted |
| HCC827; human EGFR-mutant NSCLC, female | Dr. Adi Gazdar (UT Southwestern, Dallas, TX) | Fingerprinted |
| HCC4006; human EGFR-mutant NSCLC, male | ATCC | (CRL-2871) |
| HCC2279; human EGFR-mutant NSCLC, female | Dr. Adi Gazdar (UT Southwestern, Dallas, TX) | Fingerprinted |
| H1975; human EGFR-mutant NSCLC, female | ATCC | (CRL-5908) |
| HCC827 GR6; human EGFR-mutant NSCLC, female | Established in the Jänne laboratory | N/A |
| DFCI243; human EGFR-mutant NSCLC, female | Established in the Jänne laboratory | N/A |
| H3122; human ALK-rearranged (EML4-ALK) NSCLC, sex unknown | Dr. Bruce Johnson (DFCI, Boston, MA) | Fingerprinted |
| EBC-1; human MET-amplified NSCLC, male | JCRB | (JCRB0820) |
| 293T/17 | ATCC | (CRL-11268) |
| Experimental Models: Organisms/Strains | ||
| Mouse: NCr nude mice | Taconic Biosciences | Model# NCRNU-F |
| Mouse: NSG mice | The Jackson Laboratory | Cat# 005557 |
| Mouse: EGFRL858R/T790M mice | Zhou et al., 2009 | N/A |
| Oligonucleotides | ||
| CTGF Taqman assay | Thermo Fisher Scientific | Cat# Hs01026927_m1 |
| ANKRD1 Taqman assay | Thermo Fisher Scientific | Cat# Hs00173317_m1 |
| BMF Taqman assay | Thermo Fisher Scientific | Cat# Hs00372937_m1 |
| SNAI1 Taqman assay | Thermo Fisher Scientific | Cat# Hs00195591_m1 |
| SNAI2 Taqman assay | Thermo Fisher Scientific | Cat# Hs00161904_m1 |
| TWIST1 taqman assay | Thermo Fisher Scientific | Cat# Hs00361186_m1 |
| TWIST2 taqman assay | Thermo Fisher Scientific | Cat# Hs02379973_s1 |
| ZEB1 Taqman assay | Thermo Fisher Scientific | Cat# Hs00232783_m1 |
| ZEB2 Taqman assay | Thermo Fisher Scientific | Cat# Hs00207691_m1 |
| ACTB taqman assay | Thermo Fisher Scientific | Cat# Hs01060665_g1 |
| ON-TARGETplus BMF siRNA | Dharmacon | L-004393-00-0005 |
| ON-TARGETplus YAP1 siRNA | Dharmacon | L-012200-00-0005 |
| ON-TARGETplus SNAI2 siRNA | Dharmacon | L-017386-00-0005 |
| ON-TARGETplus Non-Targeting siRNA Pool | Dharmacon | D-001810-10-05 |
| Recombinant DNA | ||
| JP1722-YAP1 | This paper | N/A |
| JP1722-YAP1-S94A | This paper | N/A |
| JP1722-YAP1-TAdel | This paper | N/A |
| JP1722-YAP1-PDZdel | This paper | N/A |
| JP1722-YAP1-WWmut | This paper | N/A |
| JP1722-YAP1-SH3bm | This paper | N/A |
| JP1722-YAP1-Y357F | This paper | N/A |
| TBS-mCherry (YAP/Hippo reporter plasmid) | Mohseni et al., 2014 | N/A |
| pLEX307-TEAD1 | This paper | N/A |
| pLEX307-TEAD1 C359S | This paper | N/A |
| Software and Algorithms | ||
| GraphPad Prism | GraphPad | https://www.graphpad.com/scientific-software/prism/ |
| ImageJ | ImageJ | https://imagej.net/Fiji |
| Starcode v1.3 | Zorita et al., 2015 | https://github.com/gui11aume/starcode/releases |
| VIPER snakemake pipeline | Cornwell et al., 2018 | https://bitbucket.org/cfce/viper/src/master/ |
| Burrows-Wheeler Aligner | Li and Durbin, 2010 | http://bio-bwa.sourceforge.net |
| MACS2 | Zhang et al., 2008b | https://github.com/taoliu/MACS/ |
| Deeptools | Ramírez et al., 2016 | https://github.com/deeptools/deepTools |
| HOMER | Heinz et al., 2010 | http://homer.ucsd.edu/homer/ |
| CellRanger | 10X Genomics | www.10xgenomics.com |
| R toolkit Seurat v.3.0 | Butler et al., 2018 | https://satijalab.org/seurat/ |
| R package AUCell | Aibar et al., 2017 | https://bioconductor.org/packages/release/bioc/html/AUCell.html |
| Qupath | Bankhead et al., 2017 | https://qupath.github.io |
Significance.
Genotype directed therapy rarely, if ever, leads to complete tumor eradication. The residual tumors, following drug treatment, can serve as reservoirs for the development of acquired drug resistance. Using EGFR-mutant lung cancer as a model system, we identify YAP activation as a major counter regulatory mechanism promoting cell survival and dormancy following sustained inhibition of EGFR- and its downstream signaling, through transcriptional repression of the pro-apoptotic protein BMF. Targeting YAP, indirectly using a tankyrase inhibitor or directly using a TEAD inhibitor, enhances the apoptotic effects of EGFR/MEK inhibition. Our findings suggest that targeting YAP/TEAD following genotype directed therapy maybe one strategy to enhance initial drug induced apoptosis, reduce residual disease and as such lead to improved treatment outcomes.
Highlights.
Loss of EGFR signaling leads to senescence-like dormancy in EGFR-mutant lung cancer
YAP promotes survival and dormancy in the absence of EGFR downstream signaling
YAP/TEAD/SLUG suppress apoptosis through transcriptional repression of BMF
A TEAD inhibitor enhances EGFR inhibitor-mediated apoptosis and prevents dormancy
Acknowledgments:
The authors would like to thank the following for valuable help with this study: David Feldman and Paul Blainey from the Massachusetts Institute of Technology in Cambridge, MA for providing research materials and expertise for the barcoding experiment; Zachary Herbert and Maura Berkeley from the Molecular Biology Core Facility at the Dana-Farber Cancer Institute for the sequencing services; Dana-Farber/Harvard Cancer Center in Boston, MA, for the use of the Specialized Histopathology Core, which provided histology and immunohistochemistry service. Dana-Farber/Harvard Cancer Center is supported in part by an NCI Cancer Center Support Grant # NIH 5 P30 CA06516; the members of the NYU Experimental Pathology Research Laboratory, which is partially supported by the Cancer Center Support Grant P30CA016087 at NYU Langone’s Laura and Isaac Perlmutter Cancer Center, for their expertise and immunohistochemistry support.
Funding: This work was supported by the National Cancer Institute grants R01CA135257 (PAJ) and R35CA220497 (PAJ) , The American Cancer Society (CRP-17-111-01-CDD (PAJ), the Claudia Adams Barr Program for Innovative Cancer Research (PAJ), the Ildiko Medve and Adria Sai-Halasz EGFR Lung Cancer Research Fund (PAJ), Balassiano Family Fund for Lung Cancer Research (PAJ), the Jane and Aatos Erkko Foundation (KJK), the Instrumentarium Science Foundation (KJK), and the Orion Research Foundation (KJK). SB was supported by fellowships from the Swiss Cancer League (KLS-3625-02 2015) and Swiss National Science Foundation (P300PB_161026/1 and P400PM_183862). JAM was supported by NIH R01 CA222218 and CA233800.
Footnotes
Publisher's Disclaimer: This is a PDF file of an unedited manuscript that has been accepted for publication. As a service to our customers we are providing this early version of the manuscript. The manuscript will undergo copyediting, typesetting, and review of the resulting proof before it is published in its final form. Please note that during the production process errors may be discovered which could affect the content, and all legal disclaimers that apply to the journal pertain.
Declaration of interests: PAJ has received consulting fees from AstraZeneca, Boehringer-Ingelheim, Pfizer, Roche/Genentech, Merrimack Pharmaceuticals, Chugai Pharmaceuticals, Ariad Pharmaceuticals, Eli Lilly and Company, Araxes Pharama, Ignyta, Novartis, Mirati Therapeutics, Takeda Oncology, Daiichi Sankyo, Biocartis, Voronoi, SFJ Pharmaceuticals and LOXO Oncology; receives post-marketing royalties from DFCI owned intellectual property on EGFR mutations licensed to Lab Corp; has sponsored research agreements with AstraZeneca, Daichi Sankyo, Boehringer Ingelheim, PUMA, Eli Lilly, Astellas Pharmaceuticals and Takeda Oncology; and has stock ownership in Gatekeeper Pharmaceuticals and LOXO Oncology. NSG is a founder, science advisory board member (SAB) and equity holder in Gatekeeper, Syros, Petra, C4, B2S and Soltego. The Gray lab receives or has received research funding from Novartis, Takeda, Astellas, Taiho, Janssen, Kinogen, Voronoi, Her2llc, Deerfield and Sanofi. R.H. has received research grants from Bristol-Myers-Squibb and Novartis. KKW is a founder and equity holder of G1 Therapeutics and he has Consulting/Sponsored Research Agreements with AstraZeneca, Janssen, Pfizer, Array, Novartis, Merck, Takeda, Ono, Targimmune and BMS. CPP has received honoraria from Bio-Rad and AstraZeneca, is a co-founder of Xsphera Biosciences, and is on the scientific advisory board of DropWorks and XSphera Biosciences. PB receives grant funding from Novartis Institute of Biomedical Research for an unrelated project. JAM serves on the SAB of 908 Devices.
References
- Aibar S, González-Blas CB, Moerman T, Huynh-Thu VA, Imrichova H, Hulselmans G, Rambow F, Marine JC, Geurts P, Aerts J, et al. (2017). SCENIC: Single-cell regulatory network inference and clustering. Nat. Methods 14, 1083–1086. [DOI] [PMC free article] [PubMed] [Google Scholar]
- Alexander WM, Ficarro SB, Adelmant G, and Marto JA (2017). multiplierz v2.0: A Python-based ecosystem for shared access and analysis of native mass spectrometry data. Proteomics 17, 15–16. [DOI] [PubMed] [Google Scholar]
- Bahcall M, Sim T, Paweletz CP, Patel JD, Alden RS, Kuang Y, Sacher AG, Kim ND, Lydon CA, Awad MM, et al. (2016). Acquired METD1228Vmutation and resistance to MET inhibition in lung cancer. Cancer Discov. 6, 1334–1341. [DOI] [PMC free article] [PubMed] [Google Scholar]
- Bankhead P, Loughrey MB, Fernández JA, Dombrowski Y, McArt DG, Dunne PD, McQuaid S, Gray RT, Murray LJ, Coleman HG, et al. (2017). QuPath: Open source software for digital pathology image analysis. Sci. Rep 7, 1–7. [DOI] [PMC free article] [PubMed] [Google Scholar]
- Beyer TA, Weiss A, Khomchuk Y, Huang K, Ogunjimi AA, Varelas X, and Wrana JL (2013). Switch enhancers interpret TGF-β and hippo signaling to control cell fate in human embryonic stem cells. Cell Rep. 5, 1611–1624. [DOI] [PubMed] [Google Scholar]
- Bhang HC, Ruddy DA, Krishnamurthy Radhakrishna V, Caushi JX, Zhao R, Hims MM, Singh AP, Kao I, Rakiec D, Shaw P, et al. (2015). Studying clonal dynamics in response to cancer therapy using high-complexity barcoding. Nat. Med 21, 440–448. [DOI] [PubMed] [Google Scholar]
- Bhola PD, and Letai A (2016). Mitochondria-Judges and Executioners of Cell Death Sentences. Mol. Cell 61, 695–704. [DOI] [PMC free article] [PubMed] [Google Scholar]
- Blanke CD, Rankin C, Demetri GD, Ryan CW, Von Mehren M, Benjamin RS, Raymond AK, Bramwell VHC, Baker LH, Maki RG, et al. (2008). Phase III randomized, intergroup trial assessing imatinib mesylate at two dose levels in patients with unresectable or metastatic gastrointestinal stromal tumors expressing the kit receptor tyrosine kinase: S0033. J. Clin. Oncol 26, 626–632. [DOI] [PubMed] [Google Scholar]
- Buenrostro J, Wu B, Chang H, and Greenleaf W (2015). ATAC-seq: A Method for Assaying Chromatin Accessibility Genome-Wide. Curr. Protoc. Mol. Biol 109, 21.29.1–21.29.9. [DOI] [PMC free article] [PubMed] [Google Scholar]
- Bum-Erdene K, Zhou D, Gonzalez-Gutierrez G, Ghozayel MK, Si Y, Xu D, Shannon HE, Bailey BJ, Corson TW, Pollok KE, et al. (2019). Small-Molecule Covalent Modification of Conserved Cysteine Leads to Allosteric Inhibition of the TEAD·Yap Protein-Protein Interaction. Cell Chem. Biol 26, 378–389.e13. [DOI] [PubMed] [Google Scholar]
- Butler A, Hoffman P, Smibert P, Papalexi E, and Satija R (2018). Integrating single-cell transcriptomic data across different conditions, technologies, and species. Nat. Biotechnol 36, 411–420. [DOI] [PMC free article] [PubMed] [Google Scholar]
- Byers LA, Diao L, Wang J, Saintigny P, Girard L, Peyton M, Shen L, Fan Y, Giri U, Tumula PK, et al. (2013). An epithelial-mesenchymal transition gene signature predicts resistance to EGFR and PI3K inhibitors and identifies Axl as a therapeutic target for overcoming EGFR inhibitor resistance. Clin. Cancer Res 19, 279–290. [DOI] [PMC free article] [PubMed] [Google Scholar]
- Campisi J, and D’Adda Di Fagagna F (2007). Cellular senescence: When bad things happen to good cells. Nat. Rev. Mol. Cell Biol 8, 729–740. [DOI] [PubMed] [Google Scholar]
- De Cesco S, Kurian J, Dufresne C, Mittermaier AK, and Moitessier N (2017). Covalent inhibitors design and discovery. Eur. J. Med. Chem 138, 96–114. [DOI] [PubMed] [Google Scholar]
- Chaib I, Karachaliou N, Pilotto S, Codony Servat J, Cai X, Li X, Drozdowskyj A, Servat CC, Yang J, Hu C, et al. (2017). Co-activation of STAT3 and YES-Associated Protein 1 (YAP1) Pathway in EGFR-Mutant NSCLC. JNCI J. Natl. Cancer Inst 109, 1–12. [DOI] [PMC free article] [PubMed] [Google Scholar]
- Chan P, Han X, Zheng B, Deran M, Yu J, Jarugumilli GK, Deng H, Pan D, Luo X, and Wu X (2016). Autopalmitoylation of TEAD proteins regulates transcriptional output of the Hippo pathway. Nat. Chem. Biol 12, 282–289. [DOI] [PMC free article] [PubMed] [Google Scholar]
- Coppé J-P, Patil CK, Rodier F, Sun Y, Muñoz DP, Goldstein J, Nelson PS, Desprez P-Y, and Campisi J (2008). Senescence-Associated Secretory Phenotypes Reveal Cell-Nonautonomous Functions of Oncogenic RAS and the p53 Tumor Suppressor. PLoS Biol. 6, e301. [DOI] [PMC free article] [PubMed] [Google Scholar]
- Coppé J-P, Desprez P-Y, Krtolica A, and Campisi J (2010). The Senescence-Associated Secretory Phenotype: The Dark Side of Tumor Suppression. Annu. Rev. Pathol. Mech. Dis 5, 99–118. [DOI] [PMC free article] [PubMed] [Google Scholar]
- Corces MR, Trevino AE, Hamilton EG, Greenside PG, Sinnott-Armstrong NA, Vesuna S, Satpathy AT, Rubin AJ, Montine KS, Wu B, et al. (2017). An improved ATAC-seq protocol reduces background and enables interrogation of frozen tissues. Nat. Methods 14, 959–962. [DOI] [PMC free article] [PubMed] [Google Scholar]
- Cordenonsi M, Zanconato F, Azzolin L, Forcato M, Rosato A, Frasson C, Inui M, Montagner M, Parenti AR, Poletti A, et al. (2011). The hippo transducer TAZ confers cancer stem cell-related traits on breast cancer cells. Cell 147, 759–772. [DOI] [PubMed] [Google Scholar]
- Cornwell MI, Vangala M, Taing L, Herbert Z, Köster J, Li B, Sun H, Li T, Zhang J, Qiu X, et al. (2018). VIPER: Visualization Pipeline for RNA-seq, a Snakemake workflow for efficient and complete RNA-seq analysis. BMC Bioinformatics 19, 1–14. [DOI] [PMC free article] [PubMed] [Google Scholar]
- Cortot AB, and Jänne PA (2014). Molecular mechanisms of resistance in epidermal growth factor receptor-mutant lung adenocarcinomas. Eur. Respir. Rev 23, 356–366. [DOI] [PMC free article] [PubMed] [Google Scholar]
- Costa DB, Halmos B, Kumar A, Schumer ST, Huberman MS, Boggon TJ, Tenen DG, and Kobayashi S (2007). BIM mediates EGFR tyrosine kinase inhibitor-induced apoptosis in lung cancers with oncogenic EGFR mutations. PLoS Med. 4, 1669–1680. [DOI] [PMC free article] [PubMed] [Google Scholar]
- Cragg MS, Kuroda J, Puthalakath H, Huang DCS, and Strasser A (2007). Gefitinib-induced killing of NSCLC cell lines expressing mutant EGFR requires BIM and can be enhanced by BH3 mimetics. PLoS Med 4, 1681–1690. [DOI] [PMC free article] [PubMed] [Google Scholar]
- Debacq-Chainiaux F, Erusalimsky JD, Campisi J, and Toussaint O (2009). Protocols to detect senescence-associated beta-galactosidase (SA-βgal) activity, a biomarker of senescent cells in culture and in vivo. Nat. Protoc 4, 1798–1806. [DOI] [PubMed] [Google Scholar]
- Drilon A, Laetsch TW, Kummar S, DuBois SG, Lassen UN, Demetri GD, Nathenson M, Doebele RC, Farago AF, Pappo AS, et al. (2018). Efficacy of Larotrectinib in TRK Fusion–Positive Cancers in Adults and Children. N. Engl. J. Med 378, 731–739. [DOI] [PMC free article] [PubMed] [Google Scholar]
- Dupont S, Morsut L, Aragona M, Enzo E, Giulitti S, Cordenonsi M, Zanconato F, Digabel J. Le, Forcato M, Bicciato S, et al. (2011). Role of YAP / TAZ in mechanotransduction. Nature 474, 179–183. [DOI] [PubMed] [Google Scholar]
- Engelman J. a, Zejnullahu K, Mitsudomi T, Song Y, Hyland C, Park JO, Lindeman N, Gale C-M, Zhao X, Christensen J, et al. (2007). MET amplification leads to gefitinib resistance in lung cancer by activating ERBB3 signaling. Science 316, 1039–1043. [DOI] [PubMed] [Google Scholar]
- Ercan D, Xu C, Yanagita M, Monast CS, Pratilas CA, Montero J, Butaney M, Shimamura T, Sholl L, Ivanova EV, et al. (2012). Reactivation of ERK signaling causes resistance to EGFR kinase inhibitors. Cancer Discov. 2, 934–947. [DOI] [PMC free article] [PubMed] [Google Scholar]
- Ewald JA, Desotelle JA, Wilding G, and Jarrard DF (2010). Therapy-induced senescence in cancer. J. Natl. Cancer Inst 102, 1536–1546. [DOI] [PMC free article] [PubMed] [Google Scholar]
- Feldman D, Tsai F, Garrity AJ, O’Rourke R, Brenan L, Ho P, Gonzalez E, Konermann S, Johannessen CM, Beroukhim R, et al. (2019). CloneRetriever: retrieval of rare clones from heterogeneous cell populations 2. BioRxiv 10.1101/762708. [DOI] [PMC free article] [PubMed] [Google Scholar]
- Ficarro S, Alexander W, and Marto J (2017). mzStudio: A Dynamic Digital Canvas for User-Driven Interrogation of Mass Spectrometry Data. Proteomes 5, 20. [DOI] [PMC free article] [PubMed] [Google Scholar]
- Ficarro SB, Browne CM, Card JD, Alexander WM, Zhang T, Park E, McNally R, Dhe-Paganon S, Seo HS, Lamberto I, et al. (2016). Leveraging gas-phase fragmentation pathways for improved identification and selective detection of targets modified by covalent probes. Anal. Chem 88, 12248–12254. [DOI] [PubMed] [Google Scholar]
- Fridman AL, and Tainsky MA (2008). Critical pathways in cellular senescence and immortalization revealed by gene expression profiling. Oncogene 27, 5975–5987. [DOI] [PMC free article] [PubMed] [Google Scholar]
- Gong Y, Somwar R, Politi K, Balak M, Chmielecki J, Jiang X, and Pao W (2007). Induction of BIM is essential for apoptosis triggered by EGFR kinase inhibitors in mutant EGFR-dependent lung adenocarcinomas. PLoS Med. 4, 1655–1668. [DOI] [PMC free article] [PubMed] [Google Scholar]
- Guler GD, Tindell CA, Pitti R, Wilson C, Nichols K, KaiWai Cheung T, Kim HJ, Wongchenko M, Yan Y, Haley B, et al. (2017). Repression of Stress-Induced LINE-1 Expression Protects Cancer Cell Subpopulations from Lethal Drug Exposure. Cancer Cell 32, 221–237.e13. [DOI] [PubMed] [Google Scholar]
- Hata AN, Niederst MJ, Archibald HL, Gomez-Caraballo M, Siddiqui FM, Mulvey HE, Maruvka YE, Ji F, Bhang HC, Krishnamurthy Radhakrishna V, et al. (2016). Tumor cells can follow distinct evolutionary paths to become resistant to epidermal growth factor receptor inhibition. Nat. Med 22, 262–269. [DOI] [PMC free article] [PubMed] [Google Scholar]
- Heinz S, Benner C, Spann N, Bertolino E, Lin YC, Laslo P, Cheng JX, Murre C, Singh H, and Glass CK (2010). Simple combinations of lineage-determining transcription factors prime cis-regulatory elements required for macrophage and B cell identities. Mol. Cell 38, 576–589. [DOI] [PMC free article] [PubMed] [Google Scholar]
- Hsu P-C, You B, Yang Y-L, Zhang W-Q, Wang Y-C, Xu Z, Dai Y, Liu S, Yang C-T, Li H, et al. (2016). YAP promotes erlotinib resistance in human non-small cell lung cancer cells. Oncotarget 5. [DOI] [PMC free article] [PubMed] [Google Scholar]
- Jamal-Hanjani M, Wilson GA, McGranahan N, Birkbak NJ, Watkins TBK, Veeriah S, Shafi S, Johnson DH, Mitter R, Rosenthal R, et al. (2017). Tracking the Evolution of Non–Small-Cell Lung Cancer. N. Engl. J. Med 376, 2109–2121. [DOI] [PubMed] [Google Scholar]
- Kapoor A, Yao W, Ying H, Hua S, Liewen A, Wang Q, Zhong Y, Wu CJ, Sadanandam A, Hu B, et al. (2014). Yap1 activation enables bypass of oncogenic KRAS addiction in pancreatic cancer. Cell 158, 185–197. [DOI] [PMC free article] [PubMed] [Google Scholar]
- Kim M, Kim T, Johnson RL, and Lim DS (2015). Transcriptional co-repressor function of the hippo pathway transducers YAP and TAZ. Cell Rep. 11, 270–282. [DOI] [PubMed] [Google Scholar]
- Ku G, Tan IB, Yau T, Boku N, Laohavinij S, Cheng A-L, Kang Y-K, and de Lima Lopes G (2012). Management of colon cancer: resource-stratified guidelines from the Asian Oncology Summit 2012. Lancet. Oncol 13, e470–81. [DOI] [PubMed] [Google Scholar]
- Kuwana T, Bouchier-Hayes L, Chipuk JE, Bonzon C, Sullivan BA, Green DR, and Newmeyer DD (2005). BH3 domains of BH3-only proteins differentially regulate Bax-mediated mitochondrial membrane permeabilization both directly and indirectly. Mol. Cell 17, 525–535. [DOI] [PubMed] [Google Scholar]
- Lehmann W, Mossmann D, Kleemann J, Mock K, Meisinger C, Brummer T, Herr R, Brabletz S, Stemmler MP, and Brabletz T (2016). ZEB1 turns into a transcriptional activator by interacting with YAP1 in aggressive cancer types. Nat. Commun 7, 1–15. [DOI] [PMC free article] [PubMed] [Google Scholar]
- Lei Q-Y, Zhang H, Zhao B, Zha Z-Y, Bai F, Pei X-H, Zhao S, Xiong Y, and Guan K-L (2008). TAZ Promotes Cell Proliferation and Epithelial-Mesenchymal Transition and Is Inhibited by the Hippo Pathway. Mol. Cell. Biol 28, 2426–2436. [DOI] [PMC free article] [PubMed] [Google Scholar]
- Ley R, Ewings KE, Hadfield K, and Cook SJ (2005). Regulatory phosphorylation of Bim: Sorting out the ERK from the JNK. Cell Death Differ. 12, 1008–1014. [DOI] [PubMed] [Google Scholar]
- Li H, and Durbin R (2010). Fast and accurate long-read alignment with Burrows-Wheeler transform. Bioinformatics 26, 589–595. [DOI] [PMC free article] [PubMed] [Google Scholar]
- Liberzon A, Birger C, Thorvaldsdóttir H, Ghandi M, Mesirov JP, and Tamayo P (2015). The Molecular Signatures Database Hallmark Gene Set Collection. Cell Syst. 1, 417–425. [DOI] [PMC free article] [PubMed] [Google Scholar]
- Lin L, Sabnis AJ, Chan E, Olivas V, Cade L, Pazarentzos E, Asthana S, Neel D, Yan JJ, Lu X, et al. (2015). The Hippo effector YAP promotes resistance to RAF- and MEK-targeted cancer therapies. Nat. Genet 47, 250–256. [DOI] [PMC free article] [PubMed] [Google Scholar]
- Liu Q, Sabnis Y, Zhao Z, Zhang T, Buhrlage SJ, Jones LH, and Gray NS (2013). Developing irreversible inhibitors of the protein kinase cysteinome. Chem. Biol 20, 146–159. [DOI] [PMC free article] [PubMed] [Google Scholar]
- Mohseni M, Sun J, Lau A, Curtis S, Goldsmith J, Fox VL, Wei C, Frazier M, Samson O, Wong KK, et al. (2014). A genetic screen identifies an LKB1-MARK signalling axis controlling the Hippo-YAP pathway. Nat. Cell Biol 16, 108–117. [DOI] [PMC free article] [PubMed] [Google Scholar]
- Mok TS, Wu Y, Thongprasert S, Yang C, Saijo N, Sunpaweravong P, Han B, Margono B, Ichinose Y, Nishiwaki Y, et al. (2009). Gefitinib or Carboplatin–Paclitaxel in Pulmonary Adenocarcinoma. N. Engl. J. Med 361, 947–957. [DOI] [PubMed] [Google Scholar]
- Mok TS, Wu Y-L, Ahn M-J, Garassino MC, Kim HR, Ramalingam SS, Shepherd FA, He Y, Akamatsu H, Theelen WSME, et al. (2017). Osimertinib or Platinum-Pemetrexed in EGFR T790M-Positive Lung Cancer. N. Engl. J. Med 376, 629–640. [DOI] [PMC free article] [PubMed] [Google Scholar]
- Narita M, Nun S, Heard E, Narita M, Lin AW, Hearn SA, Spector DL, Hannon GJ, Lowe SW, Brook S, et al. (2003). Rb-Mediated Heterochromatin Formation and Silencing of E2F Target Genes during Cellular Senescence State University of New York at Stony Brook. Cell 113, 703–716. [DOI] [PubMed] [Google Scholar]
- Noland CL, Gierke S, Schnier PD, Murray J, Sandoval WN, Sagolla M, Dey A, Hannoush RN, Fairbrother WJ, and Cunningham CN (2016). Palmitoylation of TEAD Transcription Factors Is Required for Their Stability and Function in Hippo Pathway Signaling. Structure 24, 179–186. [DOI] [PubMed] [Google Scholar]
- Peters S, Camidge DR, Shaw AT, Gadgeel S, Ahn JS, Kim D-W, Ou S-HI, Pérol M, Dziadziuszko R, Rosell R, et al. (2017). Alectinib versus Crizotinib in Untreated ALK -Positive Non–Small-Cell Lung Cancer . N. Engl. J. Med 377, 829–838. [DOI] [PubMed] [Google Scholar]
- Piccolo S, Dupont S, and Cordenonsi M (2014). The biology of YAP/TAZ: hippo signaling and beyond. Physiol. Rev 94, 1287–1312. [DOI] [PubMed] [Google Scholar]
- Pobbati AV, Han X, Hung AW, Weiguang S, Huda N, Chen GY, Kang CB, Chia CSB, Luo X, Hong W, et al. (2015). Targeting the Central Pocket in Human Transcription Factor TEAD as a Potential Cancer Therapeutic Strategy. Structure 23, 2076–2086. [DOI] [PMC free article] [PubMed] [Google Scholar]
- Qin Q, Mei S, Wu Q, Sun H, Li L, Taing L, Chen S, Li F, Liu T, Zang C, et al. (2016). ChiLin: A comprehensive ChIP-seq and DNase-seq quality control and analysis pipeline. BMC Bioinformatics 17, 1–13. [DOI] [PMC free article] [PubMed] [Google Scholar]
- Ramalingam S, Saka H, Ahn M-J, Yu H, Horn L, Hida T, Cantarini M, Verheijen R, Wessen J, Oxnard G, et al. (2019). Osimertinib plus selumetinib for patients with EGFR-mutant (EGFRm) NSCLC following disease progression on an EGFR-TKI: results from the Phase Ib TATTON study In AACR Annual Meeting 2019, Atlanta (GA) [Google Scholar]
- Ramírez F, Ryan DP, Grüning B, Bhardwaj V, Kilpert F, Richter AS, Heyne S, Dündar F, and Manke T (2016). deepTools2: a next generation web server for deep-sequencing data analysis. Nucleic Acids Res. 44, W160–W165. [DOI] [PMC free article] [PubMed] [Google Scholar]
- Richardson CD, Ray GJ, DeWitt MA, Curie GL, and Corn JE (2016). Enhancing homology-directed genome editing by catalytically active and inactive CRISPR-Cas9 using asymmetric donor DNA. Nat. Biotechnol 34, 339–344. [DOI] [PubMed] [Google Scholar]
- Rosell R, Carcereny E, Gervais R, Vergnenegre A, Massuti B, Felip E, Palmero R, Garcia-Gomez R, Pallares C, Sanchez JM, et al. (2012). Erlotinib versus standard chemotherapy as first-line treatment for European patients with advanced EGFR mutation-positive non-small-cell lung cancer (EURTAC): a multicentre, open-label, randomised phase 3 trial. Lancet Oncol. 13, 239–246. [DOI] [PubMed] [Google Scholar]
- Rosenbluh J, Nijhawan D, Cox AG, Li X, Neal JT, Schafer EJ, Zack TI, Wang X, Tsherniak A, Schinzel AC, et al. (2012). β-Catenin-driven cancers require a YAP1 transcriptional complex for survival and tumorigenesis. Cell 151, 1457–1473. [DOI] [PMC free article] [PubMed] [Google Scholar]
- Sequist LV, Waltman BA, Dias-Santagata D, Digumarthy S, Turke AB, Fidias P, Bergethon K, Shaw AT, Gettinger S, Cosper AK, et al. (2011). Genotypic and histological evolution of lung cancers acquiring resistance to EGFR inhibitors. Sci. Transl. Med 3, 75ra26. [DOI] [PMC free article] [PubMed] [Google Scholar]
- Shao DD, Xue W, Krall EB, Bhutkar A, Piccioni F, Wang X, Schinzel AC, Sood S, Rosenbluh J, Kim JW, et al. (2014). KRAS and YAP1 converge to regulate EMT and tumor survival. Cell 158, 171–184. [DOI] [PMC free article] [PubMed] [Google Scholar]
- Sharma SV, Lee DY, Li B, Quinlan MP, Takahashi F, Maheswaran S, McDermott U, Azizian N, Zou L, Fischbach MA, et al. (2010). A Chromatin-Mediated Reversible Drug-Tolerant State in Cancer Cell Subpopulations. Cell 141, 69–80. [DOI] [PMC free article] [PubMed] [Google Scholar]
- Shibue T, and Weinberg RA (2017). EMT, CSCs, and drug resistance: The mechanistic link and clinical implications. Nat. Rev. Clin. Oncol 14, 611–629. [DOI] [PMC free article] [PubMed] [Google Scholar]
- Soria J-C, Ohe Y, Vansteenkiste J, Reungwetwattana T, Chewaskulyong B, Lee KH, Dechaphunkul A, Imamura F, Nogami N, Kurata T, et al. (2018). Osimertinib in Untreated EGFR -Mutated Advanced Non–Small-Cell Lung Cancer. N. Engl. J. Med 378, 113–125. [DOI] [PubMed] [Google Scholar]
- Sudol M (2012). YAP1 oncogene and its eight isoforms. Oncogene 32, 3922. [DOI] [PubMed] [Google Scholar]
- Tang Y, Feinberg T, Keller ET, Li XY, and Weiss SJ (2016). Snail/Slug binding interactions with YAP/TAZ control skeletal stem cell self-renewal and differentiation. Nat. Cell Biol 18, 917–929. [DOI] [PMC free article] [PubMed] [Google Scholar]
- Thress KS, Jacobs V, Angell HK, Yang JCH, Sequist LV, Blackhall F, Su WC, Schuler M, Wolf J, Gold KA, et al. (2017). Modulation of Biomarker Expression by Osimertinib: Results of the Paired Tumor Biopsy Cohorts of the AURA Phase I Trial. J. Thorac. Oncol 12, 1588–1594. [DOI] [PubMed] [Google Scholar]
- Tricker EM, Xu C, Uddin S, Capelletti M, Ercan D, Ogino A, Pratilas CA, Rosen N, Gray NS, Wong K, et al. (2015). Combined EGFR/MEK Inhibition Prevents the Emergence of Resistance in EGFR-Mutant Lung Cancer. Cancer Discov. 5, 960–971. [DOI] [PMC free article] [PubMed] [Google Scholar]
- Wang W, Li N, Li X, Tran MK, Han X, and Chen J (2015). Tankyrase Inhibitors Target YAP by Stabilizing Angiomotin Family Proteins. Cell Rep. 13, 524–532. [DOI] [PMC free article] [PubMed] [Google Scholar]
- Wang Y, Xu X, Maglic D, Dill MT, Mojumdar K, Ng PK-S, Jeong KJ, Tsang YH, Moreno D, Bhavana VH, et al. (2018). Comprehensive Molecular Characterization of the Hippo Signaling Pathway in Cancer. Cell Rep. 25, 1304–1317.e5. [DOI] [PMC free article] [PubMed] [Google Scholar]
- Zaidi SK, Sullivan AJ, Medina R, Ito Y, van Wijnen AJ, Stein JL, Lian JB, and Stein GS (2004). Tyrosine phosphorylation controls Runx2-mediated subnuclear targeting of YAP to repress transcription. EMBO J. 23, 790–799. [DOI] [PMC free article] [PubMed] [Google Scholar]
- Zanconato F, Cordenonsi M, and Piccolo S (2016). YAP/TAZ at the Roots of Cancer. Cancer Cell 29, 783–803. [DOI] [PMC free article] [PubMed] [Google Scholar]
- Zhang Z, and Marshall AG (1998). A universal algorithm for fast and automated charge state deconvolution of electrospray mass-to-charge ratio spectra. J. Am. Soc. Mass Spectrom 9, 225–233. [DOI] [PubMed] [Google Scholar]
- Zhang H, Liu CY, Zha ZY, Zhao B, Yao J, Zhao S, Xiong Y, Lei QY, and Guan KL (2009). TEAD transcription factors mediate the function of TAZ in cell growth and epithelial-mesenchymal transition. J. Biol. Chem 284, 13355–13362. [DOI] [PMC free article] [PubMed] [Google Scholar]
- Zhang J, Smolen GA, and Haber DA (2008a). Negative regulation of YAP by LATS1 underscores evolutionary conservation of the Drosophila Hippo pathway. Cancer Res. 68, 2789–2794. [DOI] [PubMed] [Google Scholar]
- Zhang Y, Liu T, Meyer CA, Eeckhoute J, Johnson DS, Bernstein BE, Nussbaum C, Myers RM, Brown M, Li W, et al. (2008b). Model-based analysis of ChIP-Seq (MACS). Genome Biol. 9. [DOI] [PMC free article] [PubMed] [Google Scholar]
- Zhang Z, Lee JC, Lin L, Olivas V, Au V, Laframboise T, Abdel-Rahman M, Wang X, Levine AD, Rho JK, et al. (2012). Activation of the AXL kinase causes resistance to EGFR-targeted therapy in lung cancer. Nat. Genet 44, 852–860. [DOI] [PMC free article] [PubMed] [Google Scholar]
- Zhao B, Ye X, Yu J, Li L, Li W, Li S, Yu J, Lin JD, Wang C-Y, Chinnaiyan AM, et al. (2008). TEAD mediates YAP-dependent gene induction and growth control. Genes Dev. 22, 1962–1971. [DOI] [PMC free article] [PubMed] [Google Scholar]
- Zhou W, Ercan D, Chen L, Yun C-H, Li D, Capelletti M, Cortot AB, Chirieac L, Iacob RE, Padera R, et al. (2009). Novel mutant-selective EGFR kinase inhibitors against EGFR T790M. Nature 462, 1070–1074. [DOI] [PMC free article] [PubMed] [Google Scholar]
- Zorita E, Cuscó P, and Filion GJ (2015). Starcode: Sequence clustering based on all-pairs search. Bioinformatics 31, 1913–1919. [DOI] [PMC free article] [PubMed] [Google Scholar]
Associated Data
This section collects any data citations, data availability statements, or supplementary materials included in this article.
Supplementary Materials
Movie S1. Related to Figure 1. PC-9 cells were treated with a combination of osimertinib and trametinib for 25 days followed by drug washout. Cells were imaged every 2 hours for a total of 40 days using the Incucyte FLR live-cell imaging system.
Table S1. Related to Figure 4. YAP signature used for single-cell RNA-seq analysis.
Data Availability Statement
The datasets generated during this study are available at GEO under accession number GSE131604.