

Abstract
Previous work using visual feedback has identified two distinct sensorimotor circuits in the basal ganglia (BG): one that scaled with the duration of force and one that scaled with the rate of change of force. The present study compared functional MRI signal changes in the BG during a grip force task using either visual or auditory feedback to determine whether the BG nuclei process auditory and visual feedback similarly. We confirmed the same two sensorimotor circuits in the BG. Activation in the striatum and external globus pallidus (GPe) scaled linearly with the duration of force under visual and auditory feedback conditions, with similar slopes and intercepts across feedback type. The pattern of signal change for the internal globus pallidus (GPi) and subthalamic nucleus (STN) was nonlinear and parameters of the exponential function were altered by feedback type. Specifically, GPi and STN activation decreased exponentially with the rate of change of force. The rate constant and asymptote of the exponential functions for GPi and STN were greater during auditory than visual feedback. In a comparison of the BOLD signal between BG regions, GPe had the highest percentage of variance accounted for and this effect was preserved for both feedback types. These new findings suggest that neuronal activity of specific BG nuclei is affected by whether the feedback is derived from visual or auditory inputs. Also, the data are consistent with the hypothesis that the GPe has a high level of information convergence from other BG nuclei, which is preserved across different sensory feedback modalities.
INTRODUCTION
The basal ganglia (BG) are a set of interconnected nuclei in a circuit composed of excitatory and inhibitory neurotransmitters that are hypothesized to regulate cognitive, limbic, and sensorimotor processes (Alexander et al. 1990; Bhatia and Marsden 1994). During sensorimotor tasks, the BG are hypothesized to regulate specific parameters of movement and force (Anderson and Horak 1985; Anderson and Turner 1991; Turner et al. 1998, 2003; Vaillancourt et al. 2004) and the BG are hypothesized to be involved in sensorimotor adaptation during skill acquisition (Seidler et al. 2006). In addition, work on anesthetized cats has suggested that the BG are important in multisensory integration to facilitate the processing of complex sensory stimuli (Nagy et al. 2005). In the majority of human studies, BG output is usually examined when performing a motor task to a visual target. However, our understanding of how neuronal activation in the BG changes during motor tasks that rely on other types of sensory feedback, such as auditory feedback, is not well understood.
When gripping an object, the fingers produce force to both stabilize the object and maintain the object for the specific function, such as during eating. In performing this act, the CNS must regulate how long to hold the utensil (duration), how much force to exert (force amplitude), and how quickly to produce force against the utensil over time (rate of change of force). We have identified two distinct sensorimotor circuits in the BG that may regulate all three of these gripping parameters when contacting an object during a precision grip. One circuit is hypothesized to regulate the duration of force, whereas the other circuit is hypothesized to regulate the rate of change of force and the amplitude of the force (Spraker et al. 2007; Vaillancourt et al. 2004). Specifically, it was found that during a visually guided precision grip task, blood-oxygen-level–dependent (BOLD) activation in putamen, caudate, and external globus pallidus (GPe) scaled positively with the duration of force, whereas activation in the internal globus pallidus (GPi) and subthalamic nucleus (STN) scaled inversely with the rate of change of force (Vaillancourt et al. 2004). Also, GPi and STN increased in activation with the amplitude of force after 20% maximum voluntary contraction (MVC), whereas the putamen, caudate, and GPe did not change across a wide range of force levels (5–80% MVC). We have not been able to find any previous study in humans comparing BG activation with visual feedback to activation with other types of feedback such as auditory feedback. It is therefore not clear whether specific BG nuclei respond the same or differently when performing a precision grip force task using auditory feedback compared with one using visual feedback.
The purpose of the present study was to compare changes in the scaling of the BOLD signal in the basal ganglia during a precision grip force task using either visual or auditory feedback. The study had three objectives. First, we examined whether the previously identified BG circuit regulating the duration of force under visual feedback conditions would function for the auditory control of force. It was previously shown that a similar number of striatal neurons in the cat responded to visual feedback as to auditory feedback (Schneider 1991), suggesting that responses to both types of feedback would be equally represented in striatum. We therefore hypothesized that the putamen, caudate, and GPe would scale activation in the same pattern when using auditory as visual feedback to control the duration of a force contraction. Second, we examined whether the previously identified BG circuit regulating the control of rate of force development (i.e., the GPi and STN) under visual feedback conditions would also function for the auditory control of force. In contrast to data with respect to the striatum, we did not find any previous literature comparing neuronal activity in GPi or STN based on feedback type. We hypothesized that the GPi and STN would respond in the same manner to visual as to auditory feedback in the control of the rate of force development. Third, previous studies in nonhuman primates suggest that GPe may integrate multiple functions based on the fact that it receives a large number of afferent inputs from the striatum and STN (Parent and Hazrati 1995; Rivlin-Etzion et al. 2006). Therefore the third purpose examined whether the percentage signal change (PSC) in GPe is highly correlated with other BG nuclei and whether this correlation pattern is preserved across auditory and visual feedback modalities. We hypothesized that the GPe would have the highest correlated activity with the other BG nuclei.
METHODS
Subjects
Eleven right-handed subjects (five males and six females, age 20–37 yr) participated in the experiment. All subjects had normal hearing and normal or corrected vision. None of them had a history of neurological disorders. All subjects agreed to the experimental procedure by giving informed consent approved by the local Institutional Review Board and consistent with the Declaration of Helsinki.
Experimental design
During the experiment, subjects produced force output using a rigid precision grip device (Vaillancourt et al. 2004). Subjects pinched the grip apparatus with their right index and middle finger opposing the thumb to achieve different force levels. The custom grip apparatus is made of nonmetallic material, allowing its use inside the functional magnetic resonance imaging (fMRI) environment. The gripping apparatus is connected to a 35-ft nylon tube, which leads into an Entran (EPX-N13-250P) pressure transducer located outside the scanner room. When the pinch grip is performed, the hydraulic pressure inside the tube increases and this is sensed by the pressure transducer. The pressure transducer output was amplified through a pressure gauge amplifier. A PCMCI National Instruments A/D converter sampled the pressure at 100 Hz. The target force level in this experiment was specified at 15% of the maximal voluntary contraction (MVC), which was calculated for each subject at the beginning of data collection.
The experiment used a block design. There were five functional scans each lasting 7 min and 10 s. Each functional scan started and ended with a 30-s rest block, alternating with a 70-s task block for four times (Fig. 1A). Each 70-s task block consisted of 30-s force production with visual feedback, a 10-s break, and 30-s force production with auditory feedback (Fig. 1B). During the force conditions subjects were required to generate force to 15% of MVC every 5 s, resulting in six force contractions in one 30-s block. For each functional scan, subjects were instructed to generate force in one of five contraction types: Fast Pulse; 1, 2, and 4 s; and Hold (Fig. 1C). The Fast Pulse, 1-, 2-, and 4-s conditions change in both rate and duration of force production. The purpose of the Hold condition is to distinguish between the control of force rate and the control of force duration since the Hold condition is of a different rate but the same duration as that of the 4-s condition (Vaillancourt et al. 2004). In each condition, we carefully controlled the force amplitude produced by the subject by providing on-line feedback of the cursor and target (auditory or visual).
FIG. 1.
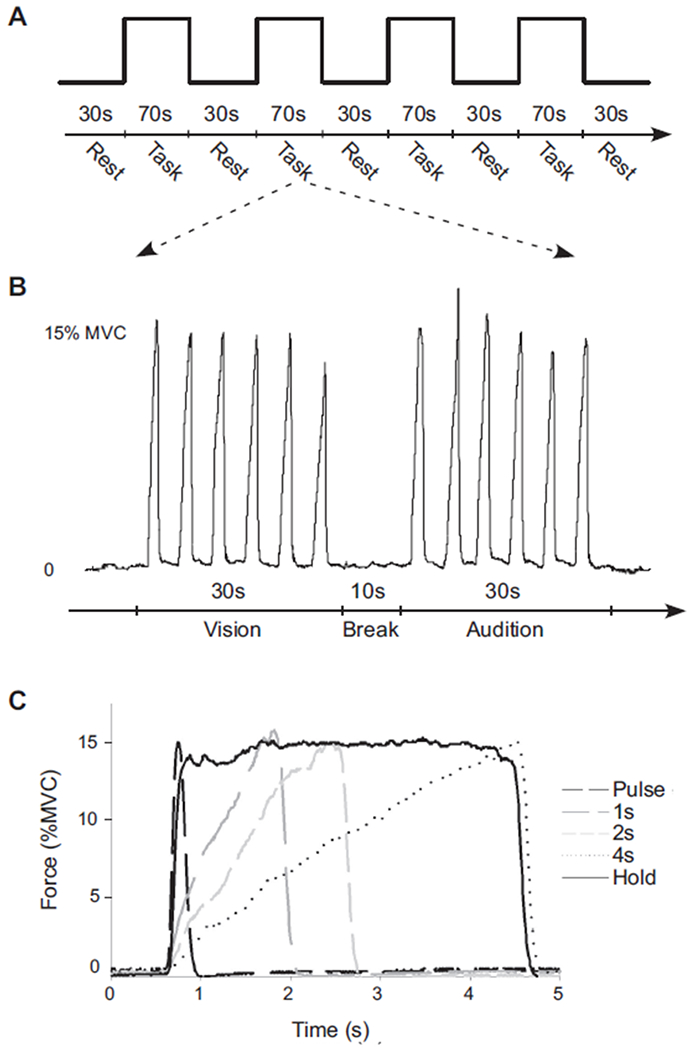
Behavioral paradigm and force output recordings during functional MRI. A: the block-design paradigm used during each scan. During each of the 5 scans a different force contraction was examined. B: force output during a 70-s task block from a representative subject during the 2-s force condition. The beginning of the force time series depicts the end of the rest block and the vertical bar below the force time series indicates the beginning of the task block. The individual produced 6 force contractions for 30 s with visual feedback, took a 10-s rest break, and produced similar force contractions for 30 s with auditory feedback. C: force output from one force pulse from each of the 5 different force conditions from the same subject. Note that each contraction was to the same target level, but the duration and rate of the contractions differed.
During each functional scan there was always a horizontal target bar presented on the screen that was stationary and set at 15% of MVC—the same for both visual and auditory feedback conditions. For the rest block, the target bar was a red color and subjects were required to fixate on the red target bar without producing force. During the force block, the red target bar turned green, which cued the initiation of force production. The contractions were as follows. 1) 0.5 s (Fast Pulse condition): the green time of the target bar lasted only 0.5 s and returned to red for 4.5 s. Correspondingly, subjects were to generate a force pulse to 15% MVC as accurately and fast as possible, within about 0.5 s, and release force for the remaining 4.5 s (Fig. 1C, black dashed line). 2) 1 s: the target bar turned green for 1 s and returned to red for 4 s. Subjects were required to produce force to 15% MVC over 1 s and then release force for the remaining 4 s (Fig. 1C, gray long dashed line). 3) 2 s: the target bar turned green for 2 s and returned to red for 3 s. Subjects were required to generate force to 15% MVC over 2 s and then release force for the remaining 3 s (Fig. 1C, gray short dashed line). 4) 4 s: the target bar turned green for 4 s and returned to red for 1 s. Subjects were required to generate force to 15% MVC over a 4-s period and then release force for the remaining 1 s (Fig. 1C, black dotted line). 5) Hold: the green time of the target bar was 4 s and returned to red for 1 s. Subjects were required to generate force to 15% MVC as fast as possible and maintain the force level for the 4-s period (Fig. 1C, black solid line).
During the visual feedback condition, there was also a horizontal white bar shown on the screen that represented the force magnitude produced by the subject. The white cursor moved vertically toward the green target bar when subjects produced force. At 15% force output there was a spatial overlap of the two bars. During the auditory feedback condition two auditory tones were delivered to the subject via headphones. The frequency of the target tone was 440 Hz and the baseline of the force tone was 400 Hz. The force tone changed according to the amount of force produced by the subject. A 15% force output was a pitch match between the target tone and the force tone. The two tones were presented in stereo, with the target tone presented in the right ear, and the moving force tone presented in the left ear. Our pilot testing indicated that switching ears did not alter the findings.
The order of the five scans was randomly presented for each subject. Five subjects had the auditory feedback condition first followed by the visual feedback condition, whereas the other six had the opposite order. Anatomical scans were taken following the functional scans. Each subject participated in a 2-h training session prior to data collection. A portion of these data was used to develop a template mask for the basal ganglia in humans (Prodoehl et al. 2008).
Force data analysis
The force data were analyzed using custom-written programs in MATLAB. Within each scan the peak force, duration of force, and the peak rate of change of force were calculated for each pulse and averaged separately for the visual and auditory conditions. The peak force was calculated as the maximum data sample of force per force contraction. The duration of force was defined as the period between the onset of force production and the time point when the force level dropped to 5% of MVC. The onset of force production was identified as the first force sample that was >5% of peak force. The peak rate of change of force was the maximum of the first derivative of force from the force onset to when the force level reached the target acquisition force. A successful trial was counted as one in which the subject produced force consistent with the duration requirements of the task ±500 ms. The exception to this was the 0.5-s (Fast Pulse) condition that had to be produced consistent with the duration requirements of the task ±200 ms. All trials for all subjects were performed within these criteria. Two-way repeated-measures ANOVAs were performed to detect significant main and interaction effects on each behavioral measure, respectively. The first factor was feedback mode (visual or auditory) and the second factor was contraction type (0.5, 1, 2, and 4 s, and Hold). Significant effects were reported at P < 0.05.
fMRI data acquisition
Imaging data were obtained on a GE 3T94 with Excite 2.0 whole body scanner with a volume head coil (General Electric Healthcare). Head motion was restricted by using adjustable padding between the head and head coil apparatus. In addition, a fixation point was given to the subject together with visual feedback to facilitate a stable head position within and between scans (Thulborn 1999). Functional images were obtained with a single-shot, gradient-echo, echo-planar pulse sequence (TE 25 ms, TR 2,500 ms, flip angle 90°, field of view 200 mm, image matrix 64 × 64, 42 slices at 3-mm thickness with a 0-mm gap in between). T1-weighted anatomical scans were acquired using a spoiled gradient-echo pulse sequence (TE 1.8 ms, TR 8.5 ms, flip angle 25°, field of view 220 mm, image matrix 256 × 256, 120 contiguous slices with 1.5-mm slice thickness). All slices were acquired axially.
fMRI data analysis
HEAD MOTION ANALYSIS.
fMRI data processing used the public-domain software Analysis of Functional NeuroImages (AFNI; http://afni.nimh.nih.gov/) (Cox 1996; Cox and Hyde 1997). Motion detection and correction procedures were performed on each functional time series using three-dimensional volume registration. The head motion (average peak-to-peak displacement) was <1 mm in any direction for all subjects in the study. The head motion was not significantly different among the five contraction types [F(4,40) = 0.38, P = 0.82]. The average head motion during visual and auditory conditions was 0.11 and 0.10 mm, respectively, and this small difference did not reach significance [F(1,10) = 3.20, P = 0.10].
REGION OF INTEREST (ROI) ANALYSIS.
The primary data analysis used for hypothesis testing was ROI analysis in the left BG. We used the BG ROIs from the basal ganglia human area template (BGHAT), which were drawn on a single Talairach-transformed anatomical image overlaid on each subject’s Talairach-transformed functional image. These ROIs have been used in previous work (Vaillancourt et al. 2007) and recently validated (Prodoehl et al. 2008). The centroid coordinate in the ROI volume in Talairach space is listed for each region (3dclust in AFNI). The regions included the caudate, anterior putamen, posterior putamen, external portion of the globus pallidus (GPe), internal portion of the globus pallidus (GPi), and subthalamic nucleus (STN). Anatomical guidelines from previously published literature were used to help identify each BG nucleus (Yelnik 2002).
Caudate nucleus (x = −11, y = 9, z = 11): a curved structure with the rostral head being more voluminous than the body (Yelnik 2002). It can be identified up to the level of the top of the ventricles. The medial border of the caudate nucleus is defined by the frontal horn or body of the lateral ventricle and the lateral edge by the anterior limb of the internal capsule (Ifthikharuddin et al. 2000).
Putamen (x = −24, y = 2, z = 4): limited medially on inferior sections by the globus pallidus and on more superior levels by the internal capsule (Ifthikharuddin et al. 2000). Anteriorly, the anterior limb of the internal capsule separates the putamen from the caudate. Laterally, it is limited by the external capsule. The anterior and posterior parts of the putamen were differentiated on a slice-by-slice basis using the anterior border of the thalamus and the posterior border of the caudate as the dividing line.
Globus pallidus:
limited medially by the posterior limb of the internal capsule and laterally by the putamen (Ifthikharuddin et al. 2000). It is divided into the globus pallidus internal portion (GPi) (x = −16, y = −4, z = 2) and the globus pallidus external portion (GPe) (x = −20, y = −4, z = 4). The GPe lies lateral to the GPi and is almost twice as large (Yelnik 2002).
STN (x = −11, y = −14, z = −3): lies ventral to the thalamus, medial to the peduncular portion of the internal capsule, and lateral and caudal to the hypothalamus. It is lateral to the red nucleus and dorsolateral to the substantia nigra in the coronal plane (or anteromedial in the axial plane) (Dormont et al. 2004). The size of the STN may be smaller than reported in the Talairach and Tournoux atlas, particularly in the medial–lateral direction (Richter et al. 2004).
The neuroimaging-dependent variable used in the study was the average percentage signal change (PSC) within each region. The PSC was obtained for each voxel by calculating the difference between the BOLD response in the force condition and the baseline rest condition. The average of the percentage signal of all voxels with a positive task-related regression coefficient within a region was then quantified (Vaillancourt et al. 2006). To estimate the task-related regression coefficient, the time series of the BOLD response for the force and rest blocks was first simulated as a box-car function. The box-car time series was then convolved with an ideal hemodynamic response function (Gamma variate waveform) in AFNI.
CORRELATION BETWEEN PSC AND FORCE.
To examine the relation between the PSC patterns with the duration of the force contraction and the rate of change of force, correlation analyses were performed using Pearson’s correlation coefficient, from which we computed the coefficient of determination (r2). The average PSC across subjects within each BG region was correlated with the average duration and rate of change of force, respectively. The correlation analysis was conducted separately for visual and auditory conditions. In addition, we used linear (polynomial) and nonlinear (exponential) functions to further examine the effects of sensory modality on the pattern of change for the PSC in each BG region.
CORRELATION BETWEEN BASAL GANGLIA REGIONS.
Correlations among BG structures were also examined to further discriminate between nuclei that were associated with the duration of force and those involved in the control of the rate of force development. Pearson correlation coefficients were calculated separately from the PSC of each BG region for visual and auditory conditions. Within each BG region the PSC of five force tasks from 11 subjects were pooled, resulting in 55 data points per region. The correlation was calculated for each BG region. We then computed the r2 for each region so that we could average the coefficient of determination across values for each region. For instance, we computed the average r2 value for GPe from the r2 values from these comparisons: GPe versus STN, GPe versus GPi, GPe versus posterior putamen, GPe versus anterior putamen, and GPe versus caudate.
RESULTS
Force output performance with visual and auditory feedback
Figure 1C depicts the force time series from a visual feedback condition for each of the five force contraction types. In each force task, the subject acquired the force target of 15% MVC and varied the duration and rate of change of force based on the instructions in each scan. We quantified the duration of force, rate of change of force, and peak force during each contraction type for both visual and auditory feedback. Figure 2A shows the peak force for all five task conditions. The main effects for stimulus [F(1,10) = 1.68, P = 0.22] and force task [F(4,40) = 2.07, P = 0.10] on force magnitude were not significant. The stimulus X task interaction was also nonsignificant [F(4,40) = 1.43, P = 0.24]. The force magnitude therefore did not differ across force tasks and was not a confounding variable in the study.
FIG. 2.
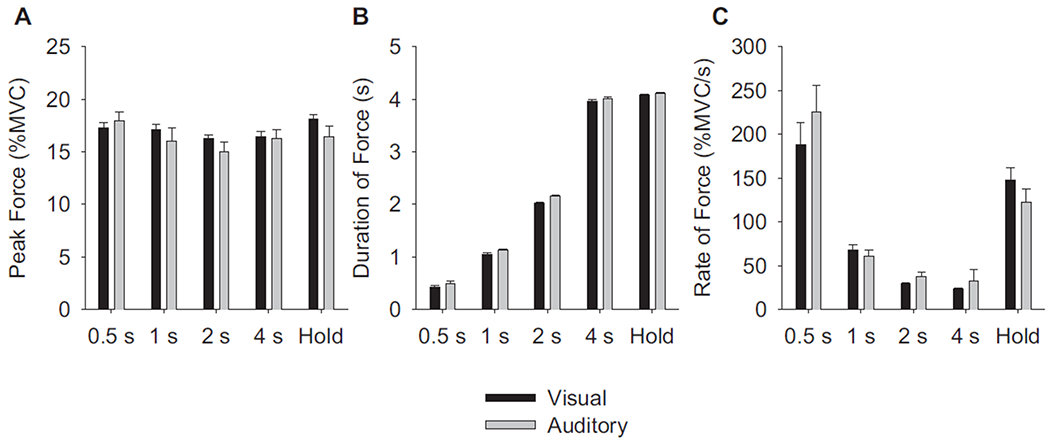
Behavioral measures of force performance across the force conditions and feedback. A: the peak force for the 0.5-, 1-, 2-, and 4-s, and Hold conditions. The duration of force (B) and rate of change of force (C) during the same force conditions as in A. In each panel, the black bars represent visual feedback and the gray bars represent auditory feedback. The error bars are +1SE from the mean across subjects.
Figure 2B shows that subjects effectively increased the duration of force contractions in compliance with the task across both feedback conditions [F(4,40) = 5.46, P < 0.005]. Although the effect was small in Fig. 2B, the repeated-measures ANOVA revealed that the duration of force with auditory feedback was slightly longer than that with visual feedback [F(1,10) = 13.38, P < 0.01]. There was not a significant feedback stimulus × task interaction.
Figure 2C shows the rate of change of force for each of the five task conditions. As expected, the 0.5-s task resulted in the fastest rate, whereas the 4-s task resulted in the slowest rate. The ANOVA confirmed that the effect of task was significant [F(4,40) = 47.4, P < 0.01] but the effect of feedback stimulus was nonsignificant [F(1,10) = 0.28, P = 0.61]. The feedback stimulus × task interaction, however, was significant [F(4,40) = 3.87, P < 0.01]. We conducted dependent sample t-test between the visual and auditory conditions to determine the locus of the interaction. For the 0.5-, 1-, 2-, and 4-s contractions there were no differences between visual and auditory conditions (P > 0.30 for all). The Hold condition did show a significantly faster rate for visual feedback compared with the auditory feedback condition (P < 0.05). Although Fig. 2C suggests that there might also have been a difference between auditory and visual conditions at 0.5 s, the between-subject variance during this condition was high, which likely caused the comparison to be nonsignificant. In summary, Fig. 2 shows that subjects were able to effectively regulate the duration of force and rate of change of force using either visual or auditory feedback.
Behavior versus PSC
BASAL GANGLIA DURATION CIRCUIT UNDER VISUAL AND AUDITORY FEEDBACK CONDITIONS.
Figure 3 shows group activation in putamen and STN under visual (top panels) and auditory (bottom panels) feedback conditions across the five force tasks. Examination of the putamen suggests increasing activation across the 0.5- to the 4-s force conditions under both types of feedback. Importantly, this activation appears consistent between the 4-s and Hold conditions, suggesting that the putamen may be scaling with the duration of the force contraction. This observation was confirmed by the statistical analysis. In each of the BG nuclei, we examined the relation between the PSC in a region and the duration of force.
FIG. 3.
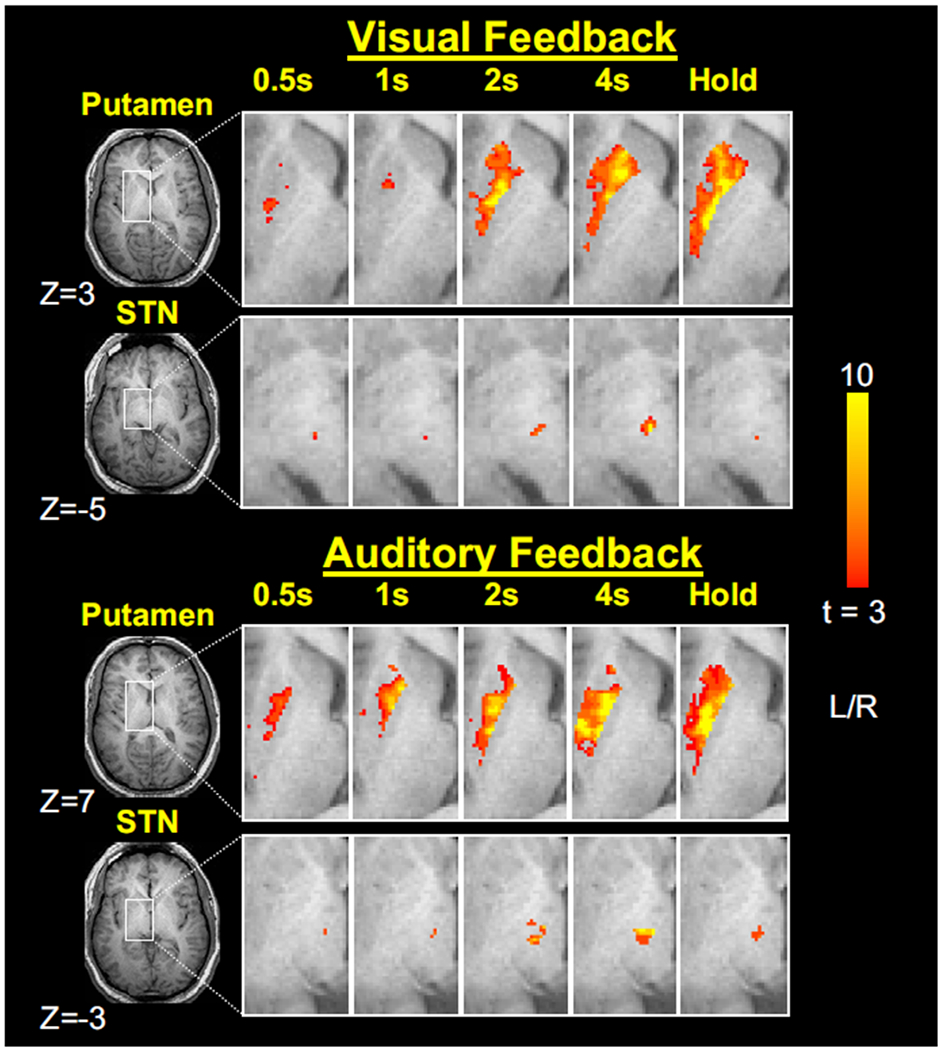
Group activation t-maps for the putamen and subthalamic nucleus (STN). Axial slices are shown for the 0.5-, 1-, 2-, and 4-s, and Hold conditions under visual (top panels) and auditory (bottom panels) feedback conditions. The activation in each slice is overlaid on the same anatomical brain in Talairach space and activation in regions other than putamen and STN is masked out using the basal ganglia human area template (BGHAT; Prodoehl et al. 2008). The group activation threshold is at t >3.
With visual feedback, in addition to anterior and posterior putamen, caudate and GPe were the only nuclei positively correlated with the duration of the force contraction. Figure 4A (gray bars) shows that the percentage variance accounted for in PSC by duration of force was high under visual feedback conditions in caudate, anterior putamen, posterior putamen, and GPe. The dashed horizontal line represents the significance threshold of P < 0.05.
FIG. 4.
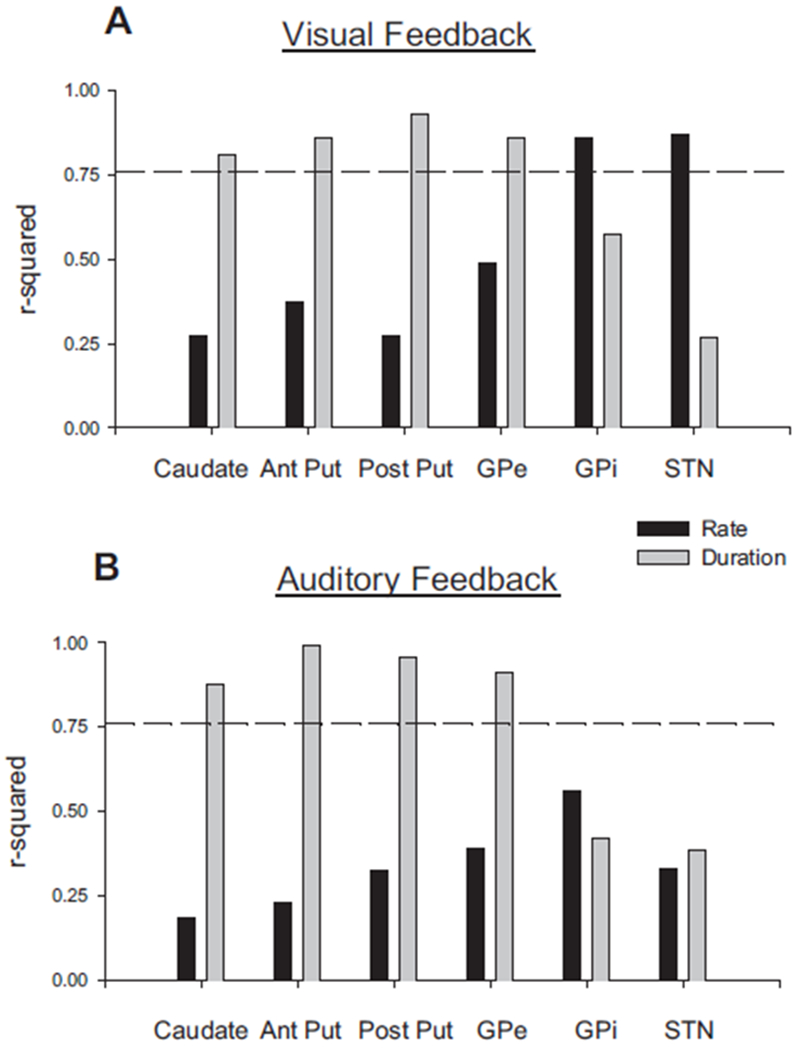
Percentage variance accounted for in percentage signal change (PSC) in each basal ganglia (BG) region compared with the duration of force and rate of change of force. A: the r2 values for the visual feedback condition. B: the r2 values for the auditory feedback condition. Black bars represent the values for the rate of change of force and the gray bars show the values for duration. The dashed line represents the significance threshold of P < 0.05.
With auditory feedback, the relation between the duration of force and PSC in the caudate, anterior putamen, posterior putamen, and GPe was consistent with results from the visual feedback condition. Figure 4B (gray bars) shows the significant percentage of variance accounted for in these four regions by the duration of force under auditory feedback.
To examine whether each region was functioning similarly in scaling activation with motor performance, we next used regression models to examine the relationship between PSC in the BG and the duration of force. Figure 5 depicts the four BG regions that were significantly correlated with the duration of force during both visual and auditory feedback conditions. A linear function was fitted to each BG region and, as expected, each function was significant. In each BG region under both feedback conditions in Fig. 5, the y-intercept in each function varied between 0.15 and 0.19, with a mean y-intercept of 0.175 and SD of 0.014. The slope of the linear regression equations varied between 0.027 and 0.041 with an average slope of 0.03 and SD of 0.004. These similarities in the y-intercept and slope of the regression equations across nuclei suggest that each of these regions is functioning similarly in scaling activation with the duration of force. Importantly, there was no difference in the functions depicted in Fig. 5 between visual and auditory feedback. This suggests that the type of sensory feedback did not modify neuronal activity in the striatum and GPe.
FIG. 5.
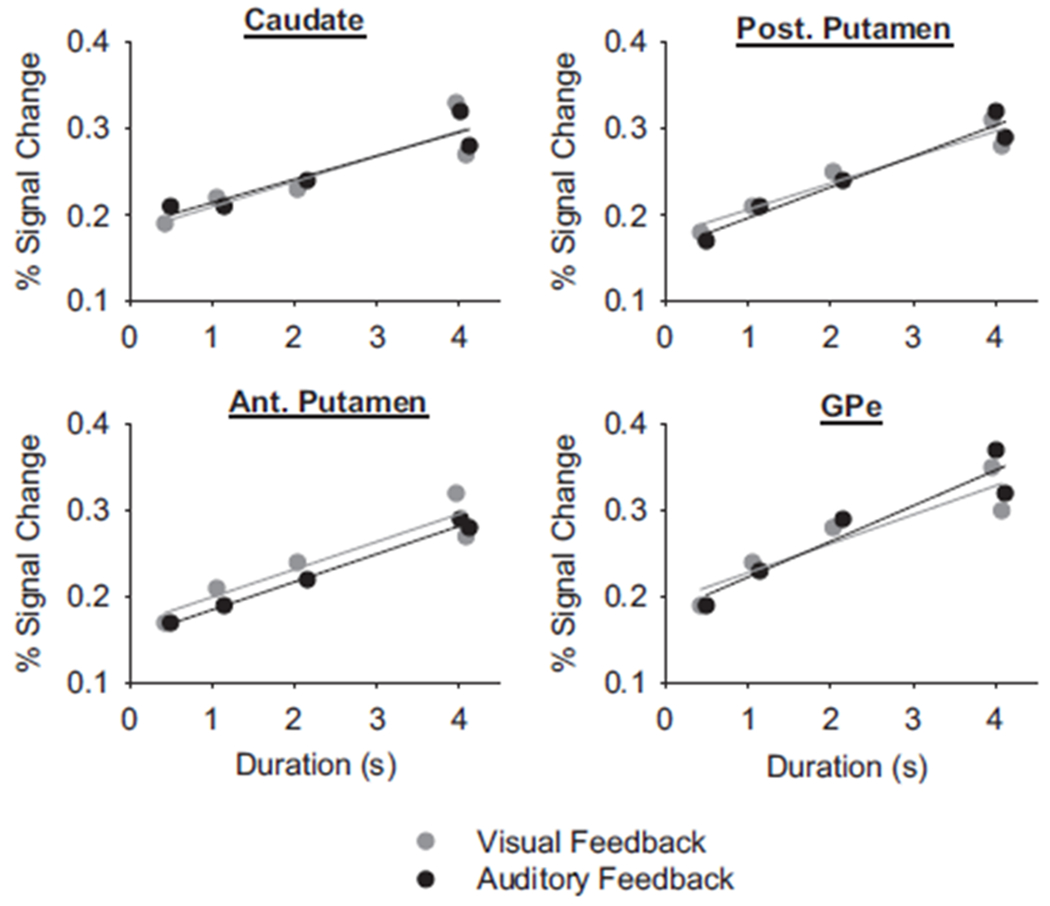
Duration of force and PSC in the caudate, anterior putamen, posterior putamen, and external globus pallidus (GPe). Each data point represents the average PSC across subjects for one type of force contraction. The lines are the linear regression lines. Gray represents visual feedback and black is auditory feedback.
BASAL GANGLIA RATE CIRCUIT UNDER VISUAL AND AUDITORY FEEDBACK CONDITIONS.
Examination of STN activation in Fig. 3 suggests increasing activation across the 0.5- to the 4-s force conditions under both types of feedback. However, in contrast to the putamen, the STN activation appears to decrease in the Hold condition compared with the 4-s condition, suggesting that the STN is not scaling with the duration of the force contraction but rather the rate of change of force. This observation was confirmed by the statistical analysis.
In each of the BG nuclei, we examined the relation between the PSC in a region and the rate of change of force. Under visual feedback conditions, only PSC in GPi and STN was significantly correlated with the rate of change of force (Fig. 4A, black bars). In contrast, under auditory feedback, there was no significant correlation between PSC in GPi and STN with the rate of change of force (Fig. 4B, black bars). These findings suggest that the type of sensory feedback modified the relation between signal intensity in GPi and STN with measures of motor performance.
To examine whether each region was functioning similarly in scaling activation with motor performance, we next used regression models to examine the relationship between PSC in the BG and the rate of change of force. Figure 6, A and B depicts the two BG regions that were significantly correlated with the rate of change of force during visual feedback (black lines). The relation between PSC in these two regions with rate of change of force under auditory feedback is shown in gray. The r2 values for GPi (r2 = 0.86) and STN (r2 = 0.87) with rate of change of force were high under visual feedback, but this was not the case during auditory feedback. The data under auditory feedback for GPi (r2 = 0.56) and STN (r2 = 0.33) were not significant (see Fig. 4B, black bars) and inspection of Fig. 6, A and B shows that a linear function does not fully capture the functional relationship of the data. Therefore we examined an exponential decay function for both visual feedback and auditory feedback to determine whether the percentage of variance accounted for increased [PSC = y0 + ae−b(rate)] (Fig. 6, C and D). The exponential function resulted in an r2 = 0.95 for GPi and r2 = 0.98 for STN for the visual feedback condition (Fig. 6, C and D, black lines) and r2 = 0.96 for GPi and r2 = 0.99 for STN for the auditory feedback condition (Fig. 6, C and D, gray lines). It is clear that when comparing the data in Fig. 6, C and D, the exponential decrease for GPi and STN is much sharper when controlling force with auditory feedback than when using visual feedback.
FIG. 6.
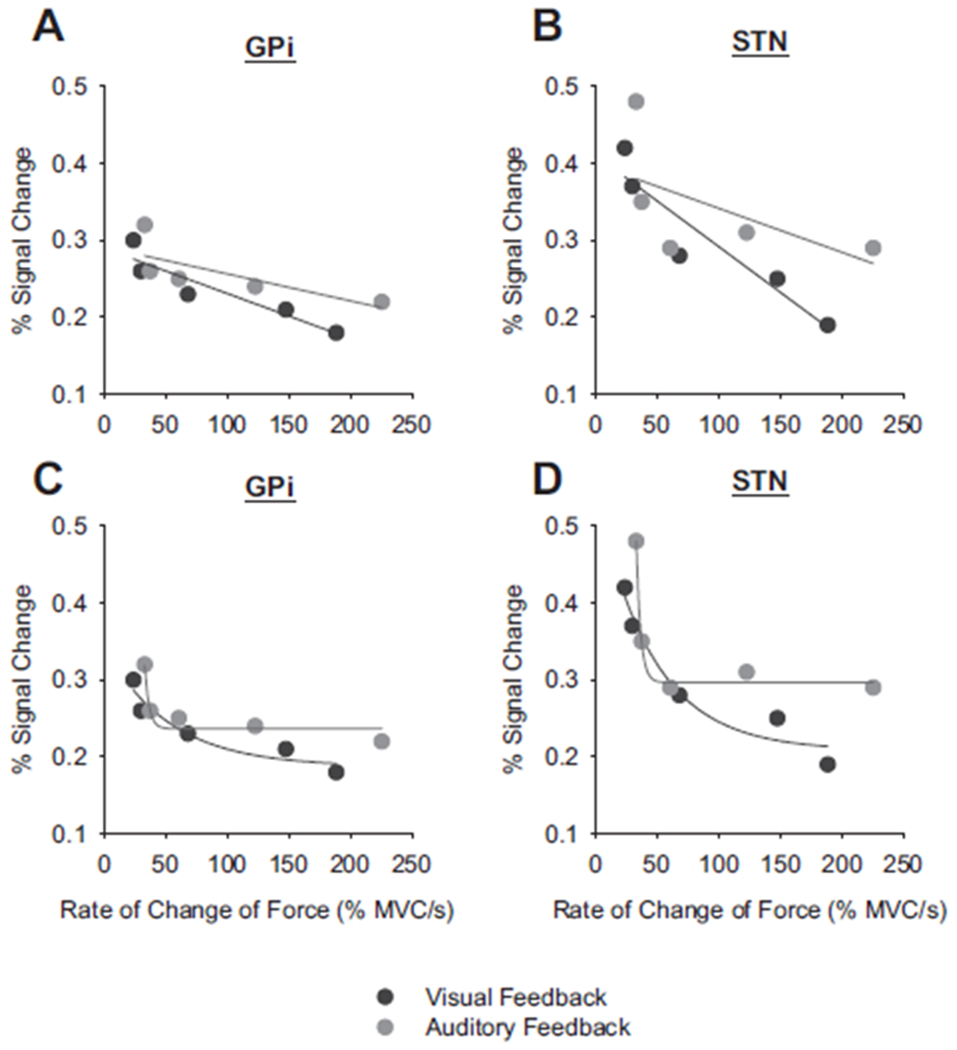
Rate of change of force and PSC in the internal globus pallidus (GPi) and STN. Each data point represents the average PSC across subjects for one type of force contraction. Black represents visual feedback and gray is auditory feedback. A and B: data fitted with a linear function. C and D: the same data fitted with a negative exponential function. Note that the negative exponential function fitted in C and D was similar for GPi and STN during the visual feedback condition and similar between structures for the auditory feedback condition. The nonlinear functions differed in a comparison between the different feedback modalities.
This steeper function in GPi and STN with auditory feedback was confirmed in comparing the rate constant (b from the equation) and asymptote values in the exponential functions. For visual feedback the rate constants (GPi = 0.02; STN = 0.02) were smaller than those during auditory feedback (GPi = 0.28; STN = 0.28). The asymptote values were also smaller with visual feedback (GPi = 0.18; STN = 0.20) compared with auditory feedback (GPi = 0.24; STN = 0.29). Since the parameters of the exponential functions were markedly different, this suggests that the activation in GPi and STN is differentially modified by auditory feedback compared with visual feedback.
Correlation structure between nuclei in the basal ganglia
To determine which regions of the BG scaled their activation similarly during the motor tasks, we examined the correlation in PSC between each of the different BG nuclei. A correlation matrix is shown in Fig. 7, A (visual) and B (auditory) for the BG. All correlations shown here were significant (P < 0.05), except for those between STN and anterior putamen under visual feedback and between STN with caudate and STN with anterior putamen under auditory feedback. Two patterns are evident in Fig. 7, A and B. The first pattern evident is the red and orange boxes in Fig. 7A (high correlation) when comparing caudate, anterior putamen, posterior putamen, and GPe. The correlations between each of these regions were also high during auditory feedback (Fig. 7B). These are the same BG nuclei that were correlated with the duration of force, which suggests that the relation between nuclei may be due to the sensorimotor function of the nucleus. In further support of this observation, the second pattern identified in Fig. 7, A and B is that STN had a reduced correlation with other BG regions, except for GPi. GPi and STN were the two BG nuclei that were related to the rate of change of force. Thus the correlations between regions also discriminates circuits in the BG related to duration and rate of change of force.
FIG. 7.
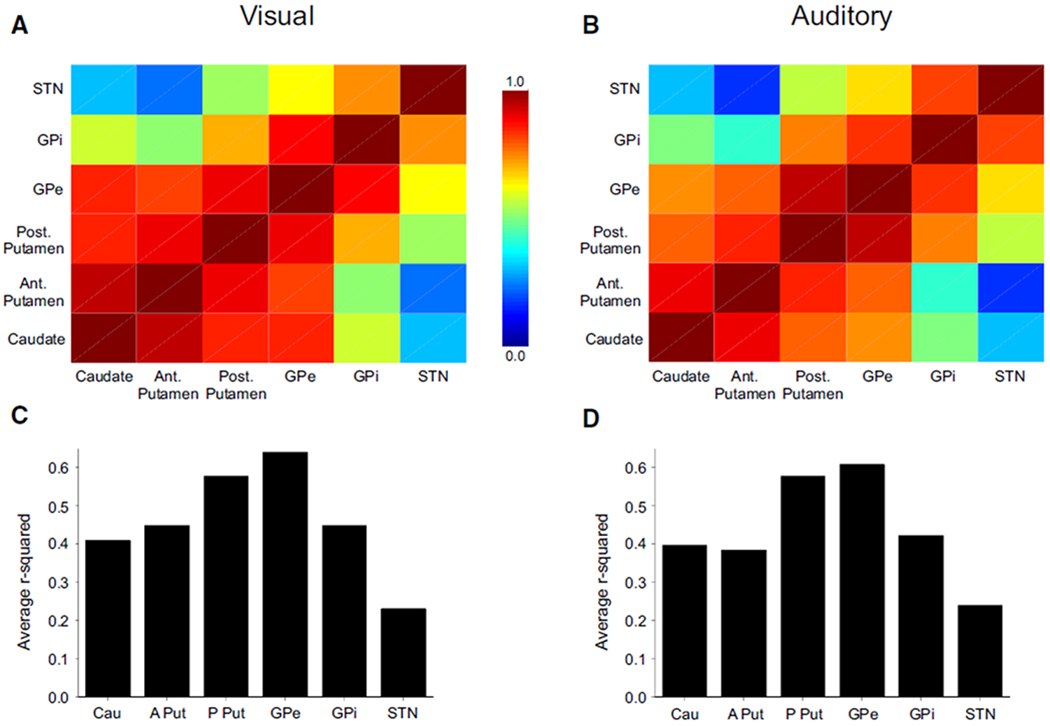
Correlation patterns between the PSC in each BG region. A and B: the correlation grid for the Pearson correlations between each nucleus during the visual and auditory feedback conditions. The color bar shows that high correlation corresponds with red and low correlation corresponds with blue. C and D: the composite r2 values for each region in A and B during the visual and auditory feedback conditions. For instance, we averaged the 5 r2 values that the caudate had with all other regions. Note that the GPe had the highest overall r2 during each feedback condition.
Figure 7, C and D shows the average r2 values for each region calculated from the correlation values that were visually depicted in each nuclei in Fig. 7, A and B. The GPe had the highest overall r2 value with all other BG regions; the posterior putamen had the second highest r2 value. The patterns in Fig. 7, C and D were not modified by the type of sensory feedback.
DISCUSSION
This study examined how BOLD activation patterns scale with the duration of force and the rate of change of force in individual nuclei of the human BG under visual and auditory feedback. The findings have confirmed that the caudate, posterior putamen, anterior putamen, and GPe increase in signal intensity with the duration of force, whereas GPi and STN scale negatively with the rate of change of force (Vaillancourt et al. 2004). The findings extend previous work by showing that the pattern of signal change in the striatum and GPe was not influenced by feedback modality, whereas the pattern of change in the GPi and STN was altered by the type of feedback. The current data provide the first demonstration in humans that the mode of sensory feedback modifies processing within selective BG nuclei. In addition, the BOLD signal in GPe had the highest overall correlation with activation in other nuclei of the BG and this effect was preserved with visual and auditory feedback. These new findings suggest that neuronal activity of specific BG nuclei is affected by whether the feedback is derived from visual or auditory inputs, whereas the relationship between neuronal activation in different BG nuclei is not modified by the type of sensory feedback.
Effect of feedback modality on basal ganglia function
We identified that the scaling of the BOLD activity in the caudate, anterior and posterior putamen, and GPe did not depend on the type of sensory feedback. This is consistent with previous work in cats that showed a similar number of striatal neurons that responded to visual as to auditory feedback (Schneider 1991). In contrast, a study by Johnstone and Rolls (1990) examined single-unit activity in striatal and pallidal neurons in identical short-term memory tasks that differed only on whether the monkeys used visual or auditory stimuli. They found that selected neurons in the striatum responded to visual stimuli but not to auditory stimuli, which differ from the current findings and those of Schneider (1991). However, Johnstone and Rolls (1990) did find that pallidal neurons responded in both visual and auditory versions of the task and our results in the globus pallidus support these findings. Thus previous work and the present study support the general view that neuronal activity in specific nuclei of the BG depends on the type of sensory input.
We determined that the rate constant of the exponential function that approximated the relationship between the rate of change of force and the BOLD signal change in GPi and STN was greater for auditory feedback compared with visual feedback (see earlier text and Fig. 6, C and D). This raises the question of why the scaling pattern (slope and asymptote) within the GPi and STN was steeper for auditory feedback compared with visual feedback. We suggest that for this task, using a visual signal allows a more finely calibrated response in GPi and STN than using an auditory signal. For example, producing force with visual feedback may have allowed subjects to grade neuronal activity more precisely, which is reflected as a reduced rate constant in the exponential function. This could be related to a differential weighting within each nucleus to visual and auditory input. It could also be related to differences in the magnitude of visual and auditory input to each BG nucleus.
The anatomical connectivity between visual and auditory information and the BG has received considerable attention, as have electrophysiological studies in the BG using visual and auditory stimuli. In monkeys, one of the outputs from the inferotemporal cortex (area TE) is to the ventral striatum (Saint-Cyr et al. 1990; Webster et al. 1993). This area of the inferotemporal cortex is thought to play a critical role in visual recognition and object discrimination (Ungerleider and Mishkin 1982). Middleton and Strick (1996) also showed that the substantia nigra pars reticulata projects via the thalamus to area TE of the inferotemporal cortex, suggesting that BG output can influence higher-order aspects of visual processing. There is also a direct projection from the superior colliculus, which receives visual information from the retina, to the substantia nigra of the rat (Comoli et al. 2003), and this may allow for quick detection of salient visual events. There is also evidence that auditory cortical fields project to the caudate and putamen in cats (Reale and Imig 1983). These anatomical connectivity studies are supported by several electrophysiological studies that have recorded auditory-responsive neurons in the caudate, putamen, and globus pallidus (Chudler et al. 1995; Schneider 1991; Strecker et al. 1985). Elegant work by Kolomiets et al. (2001) in anesthetized rats showed that stimulating the auditory and motor cortex elicited similar cells in the STN but different cells in the striatum. In summary, although this previous work has established anatomical and physiological connectivity between visual and auditory stimuli with the BG, it does not help in distinguishing whether the current findings are due to a differential weighting of sensory input within each BG nucleus or due to the magnitude of the visual and auditory input to each BG nucleus.
Although we cannot rule out the possibility that the changes in BG activation with the duration and rate of change of force is a simple reflection of scaled signals from peripheral proprioceptors, we suggest that this explanation is unlikely. Since the current study examined precision grip force production, and this was an isometric task, the cutaneous receptors are the most likely sensory receptors to influence the adaptive changes in force output (Witney et al. 2004). Indeed, studies in nonhuman primates examining responses to somatosensory stimulation have consistently elicited neural responses in the putamen (Crutcher and DeLong 1984) as well as the globus pallidus and STN (DeLong et al. 1985). However, the authors of these two studies indicated that the number of cells that specifically responded to cutaneous stimulation was rather small. Additionally, Kimura (1986) showed that putamen neurons in primates can have specific sensory responses to stimuli used to trigger movements. They examined putamen neuronal activation in association with sensory stimuli and movement. They found that cells did not respond to a sensory trigger stimulus when the stimulus lost behavioral significance to the animal. This suggests that the neuronal response was not simply related to the sensory input, but that this type of cell was involved in processing behaviorally relevant stimuli. Therefore we speculate that the duration and rate of change of force response patterns are not simply due to changes in cutaneous receptors, but instead reflect a more general sensorimotor process in the BG. Indeed, there is a growing body of evidence in humans and animals that suggests that the BG play an important role in regulating sensorimotor processes (Abbruzzese and Berardelli 2003; Boecker et al. 1999; Kaji and Murase 2001; Maschke et al. 2003; Murase et al. 2006; Nagy et al. 2005).
Effects of visual and auditory feedback on the relation between basal ganglia nuclei
In the monkey, previous work has established that the GPe receives input from two distinct input structures within the BG: the striatum and STN (Kita 1992; Nambu et al. 2000). There is a reduction in the number of neurons present in the GPe compared with one of its input structures—the striatum—that suggests a convergence of inputs onto GPe (Parent and Hazrati 1995). Arkadir and colleagues (2004) examined GPe neurons during a visuomotor task and showed that a large number of cells were modulated by the expected trial outcome and the direction of arm movement. The authors proposed that GPe neurons are uniquely positioned to process a multitude of parameters. It should be pointed out that recent evidence also shows a mixing of motor and incentive signals in the putamen and GPi (Pasquereau et al. 2007), indicating that information convergence may occur in other nuclei of the BG as well. In the current study, we examined the relation between nuclei of the BG and whether BOLD activation in the GPe would account for the most variance in activation of other BG nuclei. Indeed, the region with the highest average r2 value was GPe (Fig. 7, C and D) and this effect was preserved during both visual and auditory feedback conditions. We also found strong relations between each of the other BG nuclei. The posterior putamen followed the GPe as the nucleus that accounted for the second highest amount of variance in PSC of the other BG nuclei. These two findings are consistent with the hypothesis that all BG nuclei display properties consistent with information convergence but that GPe may have the highest level of information convergence. This interpretation is consistent with the hypothesis proposed by Parent and Hazrati (1995) that “… GPe occupies a central position in the basal ganglia circuitry” and that the GPe integrates multiple functions.
Summary and conclusions
The current study has confirmed the existence of two distinct sets of nuclei in the BG that scale in BOLD signal change with the duration and rate of change of force output. Our results also furnish new data supporting the hypothesis that the type of sensory feedback modifies processing within specific BG nuclei. In particular, GPi and STN (rate regions) depended on the type of sensory feedback. In contrast, the striatum and GPe (duration regions) were not affected by the type of sensory feedback. Furthermore, the type of sensory feedback did not modify the correlation pattern between BG regions. Future studies should address a physiological mechanism for the differential activation in BG nuclei.
ACKNOWLEDGMENTS
We thank M. Flannery and the staff at the Center for Magnetic Resonance Research for assistance in data collection.
GRANTS
This research was supported in part by National Institute of Neurological Disorders and Stroke Grants R01-NS-52318, R01-NS-58487, R01-NS-28127, and R01-NS-40902.
Footnotes
The costs of publication of this article were defrayed in part by the payment of page charges. The article must therefore be hereby marked “advertisement” in accordance with 18 U.S.C. Section 1734 solely to indicate this fact.
REFERENCES
- Abbruzzese G, Berardelli A. Sensorimotor integration in movement disorders. Mov Disord 18: 231–240, 2003. [DOI] [PubMed] [Google Scholar]
- Alexander GE, Crutcher MD, DeLong MR. Basal ganglia-thalamocortical circuits: parallel substrates for motor, oculomotor, “prefrontal” and “limbic” functions. Prog Brain Res 85: 119–146, 1990. [PubMed] [Google Scholar]
- Anderson ME, Horak FB. Influence of the globus pallidus on arm movements in monkeys. III. Timing of movement-related information. J Neurophysiol 54: 433–448, 1985. [DOI] [PubMed] [Google Scholar]
- Anderson ME, Turner RS. A quantitative analysis of pallidal discharge during targeted reaching movement in the monkey. Exp Brain Res 86: 623–632, 1991. [DOI] [PubMed] [Google Scholar]
- Arkadir D, Morris G, Vaadia E, Bergman H. Independent coding of movement direction and reward prediction by single pallidal neurons. J Neurosci 24: 10047–10056, 2004. [DOI] [PMC free article] [PubMed] [Google Scholar]
- Bhatia KP, Marsden CD. The behavioural and motor consequences of focal lesions of the basal ganglia in man. Brain 117: 859–876, 1994. [DOI] [PubMed] [Google Scholar]
- Boecker H, Ceballos-Baumann A, Bartenstein P, Weindl A, Siebner HR, Fassbender T, Munz F, Schwaiger M, Conrad B. Sensory processing in Parkinson’s and Huntington’s disease: investigations with 3D H(2)(15)O-PET. Brain 122: 1651–1665, 1999. [DOI] [PubMed] [Google Scholar]
- Chudler EH, Sugiyama K, Dong WK. Multisensory convergence and integration in the neostriatum and globus pallidus of the rat. Brain Res 674: 33–45, 1995. [DOI] [PubMed] [Google Scholar]
- Comoli E, Coizet V, Boyes J, Bolam JP, Canteras NS, Quirk RH, Overton PG, Redgrave P. A direct projection from superior colliculus to substantia nigra for detecting salient visual events. Nat Neurosci 6: 974–980, 2003. [DOI] [PubMed] [Google Scholar]
- Cox RW. AFNI: software for analysis and visualization of functional magnetic resonance neuroimages. Comput Biomed Res 29: 162–173, 1996. [DOI] [PubMed] [Google Scholar]
- Cox RW, Hyde JS. Software tools for analysis and visualization of fMRI data. NMR Biomed 10: 171–178, 1997. [DOI] [PubMed] [Google Scholar]
- Crutcher MD, DeLong MR. Single cell studies of the primate putamen. II. Relations to direction of movement and pattern of muscular activity. Exp Brain Res 53: 244–258, 1984. [DOI] [PubMed] [Google Scholar]
- DeLong MR, Crutcher MD, Georgopoulos AP. Primate globus pallidus and subthalamic nucleus: functional organization. J Neurophysiol 53: 530–543, 1985. [DOI] [PubMed] [Google Scholar]
- Dormont D, Ricciardi KG, Tande D, Parain K, Menuel C, Galanaud D, Navarro S, Cornu P, Agid Y, Yelnik J. Is the subthalamic nucleus hypointense on T2-weighted images? A correlation study using MR imaging and stereotactic atlas data. Am J Neuroradiol 25: 1516–1523, 2004. [PMC free article] [PubMed] [Google Scholar]
- Grafton ST. Contributions of functional imaging to understanding parkinsonian symptoms. Curr Opin Neurobiol 14: 715–719, 2004. [DOI] [PubMed] [Google Scholar]
- Ifthikharuddin SF, Shrier DA, Numaguchi Y, Tang X, Ning R, Shibata DK, Kurlan R. MR volumetric analysis of the human basal ganglia: normative data. Acad Radiol 7: 627–634, 2000. [DOI] [PubMed] [Google Scholar]
- Johnstone S, Rolls ET. Delay, discriminatory, and modality specific neurons in striatum and pallidum during short-term memory tasks. Brain Res 522: 147–151, 1990. [DOI] [PubMed] [Google Scholar]
- Kaji R, Murase N. Sensory function of basal ganglia. Mov Disord 16: 593–594, 2001. [DOI] [PubMed] [Google Scholar]
- Kimura M The role of primate putamen neurons in the association of sensory stimuli with movement. Neurosci Res 3: 436–443, 1986. [DOI] [PubMed] [Google Scholar]
- Kita H Responses of globus pallidus neurons to cortical stimulation: intracellular study in the rat. Brain Res 589: 84–90, 1992. [DOI] [PubMed] [Google Scholar]
- Kolomiets BP, Deniau JM, Mailly P, Menetrey A, Glowinski J, Thierry AM. Segregation and convergence of information flow through the cortico-subthalamic pathways. J Neurosci 21: 5764–5772, 2001. [DOI] [PMC free article] [PubMed] [Google Scholar]
- Maschke M, Gomez CM, Tuite PJ, Konczak J. Dysfunction of the basal ganglia, but not the cerebellum, impairs kinaesthesia. Brain 126: 2312–2322, 2003. [DOI] [PubMed] [Google Scholar]
- Middleton FA, Strick PL. The temporal lobe is a target of output from the basal ganglia. Proc Natl Acad Sci USA 93: 8683–8687, 1996. [DOI] [PMC free article] [PubMed] [Google Scholar]
- Murase N, Shimadu H, Urushihara R, Kaji R. Abnormal sensorimotor integration in hand dystonia. Suppl Clin Neurophysiol 59: 283–287, 2006. [DOI] [PubMed] [Google Scholar]
- Nagy A, Paroczy Z, Norita M, Benedek G. Multisensory responses and receptive field properties of neurons in the substantia nigra and in the caudate nucleus. Eur J Neurosci 22: 419–424, 2005. [DOI] [PubMed] [Google Scholar]
- Nambu A, Tokuno H, Hamada I, Kita H, Imanishi M, Akazawa T, Ikeuchi Y, Hasegawa N. Excitatory cortical inputs to pallidal neurons via the subthalamic nucleus in the monkey. J Neurophysiol 84: 289–300, 2000. [DOI] [PubMed] [Google Scholar]
- Parent A, Hazrati LN. Functional anatomy of the basal ganglia. II. The place of subthalamic nucleus and external pallidum in basal ganglia circuitry. Brain Res Rev 20: 128–154, 1995. [DOI] [PubMed] [Google Scholar]
- Pasquereau B, Nadjar A, Arkadir D, Bezard E, Goillandeau M, Bioulac B, Gross CE, Boraud T. Shaping of motor responses by incentive values through the basal ganglia. J Neurosci 27: 1176–1183, 2007. [DOI] [PMC free article] [PubMed] [Google Scholar]
- Prodoehl J, Yu H, Little DM, Abraham I, Vaillancourt DE. Region of interest template for the human basal ganglia: comparing EPI and standardized space approaches. Neuroimage 39: 956–965, 2008. [DOI] [PMC free article] [PubMed] [Google Scholar]
- Reale RA, Imig TJ. Auditory cortical field projections to the basal ganglia of the cat. Neuroscience 8: 67–86, 1983. [DOI] [PubMed] [Google Scholar]
- Richter EO, Hoque T, Halliday W, Lozano AM, Saint-Cyr JA. Determining the position and size of the subthalamic nucleus based on magnetic resonance imaging results in patients with advanced Parkinson disease. J Neurosurg 100: 541–546, 2004. [DOI] [PubMed] [Google Scholar]
- Rivlin-Etzion M, Marmor O, Heimer G, Raz A, Nini A, Bergman H. Basal ganglia oscillations and pathophysiology of movement disorders. Curr Opin Neurobiol 16: 629–637, 2006. [DOI] [PubMed] [Google Scholar]
- Saint-Cyr JA, Ungerleider LG, Desimone R. Organization of visual cortical inputs to the striatum and subsequent outputs to the pallido-nigral complex in the monkey. J Comp Neurol 298: 129–156, 1990. [DOI] [PubMed] [Google Scholar]
- Schneider JS. Responses of striatal neurons to peripheral sensory stimulation in symptomatic MPTP-exposed cats. Brain Res 544: 297–302, 1991. [DOI] [PubMed] [Google Scholar]
- Seidler RD, Noll DC, Chintalapati P. Bilateral basal ganglia activation associated with sensorimotor adaptation. Exp Brain Res 175: 544–555, 2006. [DOI] [PubMed] [Google Scholar]
- Spraker MB, Yu H, Corcos DM, Vaillancourt DE. Role of individual basal ganglia nuclei in force amplitude generation. J Neurophysiol 98: 821–834, 2007. [DOI] [PMC free article] [PubMed] [Google Scholar]
- Strecker RE, Steinfels GF, Abercrombie ED, Jacobs BL. Caudate unit activity in freely moving cats: effects of phasic auditory and visual stimuli. Brain Res 329: 350–353, 1985. [DOI] [PubMed] [Google Scholar]
- Thulborn KR. Visual feedback to stabilize head position for fMRI. Magn Reson Med 41: 1039–1043, 1999. [DOI] [PubMed] [Google Scholar]
- Turner RS, Desmurget M, Grethe J, Crutcher MD, Grafton ST. Motor subcircuits mediating the control of movement extent and speed. J Neurophysiol 90: 3958–3966, 2003. [DOI] [PubMed] [Google Scholar]
- Turner RS, Grafton ST, Votaw JR, DeLong MR, Hoffman JM. Motor subcircuits mediating the control of movement velocity: a PET study. J Neurophysiol 80: 2162–2176, 1998. [DOI] [PubMed] [Google Scholar]
- Ungerleider LG, Mishkin M. Two cortical visual systems In: Analysis of Visual Behavior, edited by Ingle DJ, Goodale MA, Mansfield RJW. Cambridge, MA: MIT Press, 1982, p. 540–586. [Google Scholar]
- Vaillancourt DE, Mayka MA, Corcos DM. Intermittent visuomotor processing in the human cerebellum, parietal cortex, and premotor cortex. J Neurophysiol 95: 922–931, 2006. [DOI] [PMC free article] [PubMed] [Google Scholar]
- Vaillancourt DE, Mayka MA, Thulborn KR, Corcos DM. Subthalamic nucleus and internal globus pallidus scale with the rate of change of force production in humans. Neuroimage 23: 175–186, 2004. [DOI] [PubMed] [Google Scholar]
- Vaillancourt DE, Yu H, Mayka MA, Corcos DM. Role of the basal ganglia and frontal cortex in selecting and producing internally guided force pulses. Neuroimage 36: 793–803, 2007. [DOI] [PMC free article] [PubMed] [Google Scholar]
- Webster MJ, Bachevalier J, Ungerleider LG. Subcortical connections of inferior temporal areas TE and TEO in macaque monkeys. J Comp Neurol 335: 73–91, 1993. [DOI] [PubMed] [Google Scholar]
- Witney AG, Wing A, Thonnard JL, Smith AM. The cutaneous contribution to adaptive precision grip. Trends Neurosci 27: 637–643, 2004. [DOI] [PubMed] [Google Scholar]
- Yelnik J Functional anatomy of the basal ganglia. Mov Disord 17, Suppl. 3: S15–S21, 2002. [DOI] [PubMed] [Google Scholar]