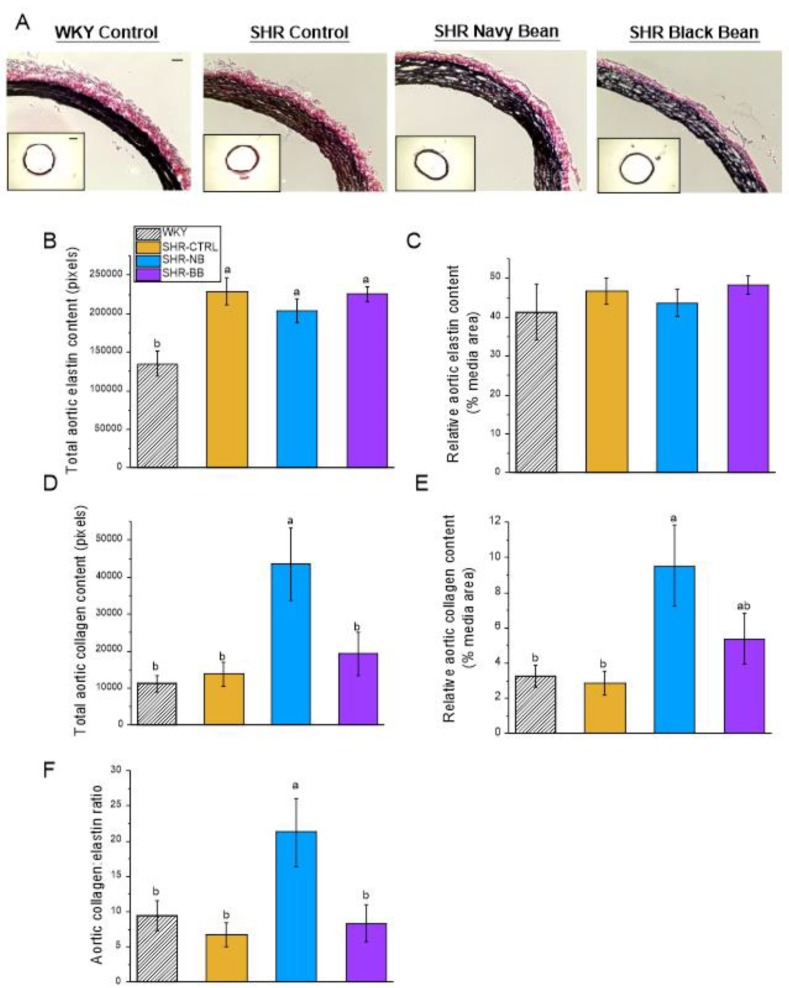
Figure 2.
Phase 1: Large-artery elastin and collagen. (A) Representative cross-sections (20× objective) of aorta stained for elastin (black) and collagen (red); (B) Elastin content in aorta as total area; (C) Elastin content in aorta as % media area; (D) Collagen content in aorta as total area; (E) Collagen content in aorta as % media area; (F) Aortic collagen:elastin ratio. Aorta cross-sections were stained with an Elastin Stain Kit (Sigma); elastin and collagen contents were determined using ImageJ to quantify the area of blackness (elastin) and redness (collagen). Inset: aortic cross-sections (4× objective). Scale bar applies equally to all aorta images (bar = 50 µm). Data are expressed as mean ± SEM (n = 6–9/group). Different letters represent significant differences (p < 0.05). An absence of letters indicates no statistical differences. Abbreviations: BB, black bean diet; CTRL, bean-free control diet; NB, navy bean diet; SHR, spontaneously hypertensive rat; WKY, Wistar Kyoto.

