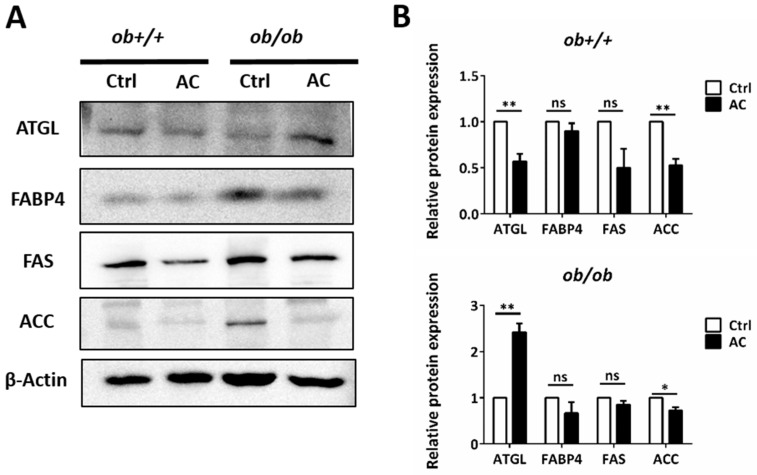
Figure 4.
AC promotes expression of a lipolysis-associated protein in the EWAT of ob+/+ and ob/ob mice. (A) Immunoblot analysis of lipolysis pathway protein. (B) Quantification and comparison of protein expression in ob+/+-Ctrl or ob/ob-Ctrl mice. All data are expressed as mean ± SEM, * p < 0.05, ** p < 0.01, *** p < 0.001. Non-significant; ns. n = 4–8 mice in each group. All experiments were repeated thrice.

