Figure 9.
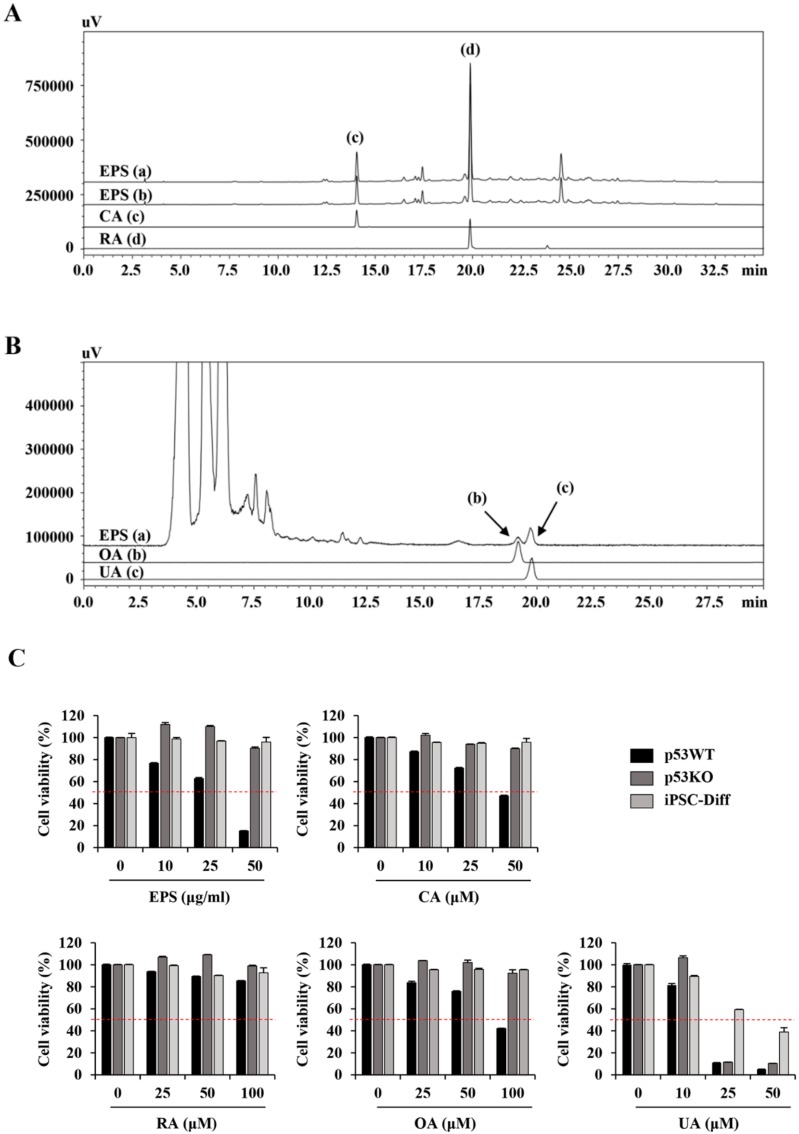
Chromatogram of four major standard compounds in EPS. (A) Using HPLC–PDA, EPS (a, 325 nm; b, 330 nm) and two phenylpropanoids, CA (c) and RA (d) were identified in EPS at 14.037 and 19.870 min, respectively. (B) Using HPLC–ELSD, EPS (a) and two triterpenoids, OA (b) and UA (c) were identified in EPS at 19.154 and 19.782 min, respectively. (C) p53WT and p53KO hiPSCs and iPSC-Diff were treated with the indicated concentrations of EPS, CA, RA, OA, and UA for 24 h, and the cell viability was measured using a CCK-8 assay. Relative cell viability compared with EPS-untreated control cells was calculated. Data are expressed as the mean ± SD from three independent experiments.

