Nijenhuis et al. developed a robust optogenetic toolbox to reversibly reposition organelles in populations of cells with minimal adverse effects on endogenous transport. This work opens new opportunities to dissect intracellular transport and spatial cell biology.
Abstract
Cellular functioning relies on active transport of organelles by molecular motors. To explore how intracellular organelle distributions affect cellular functions, several optogenetic approaches enable organelle repositioning through light-inducible recruitment of motors to specific organelles. Nonetheless, robust application of these methods in cellular populations without side effects has remained challenging. Here, we introduce an improved toolbox for optogenetic control of intracellular transport that optimizes cellular responsiveness and limits adverse effects. To improve dynamic range, we employed improved optogenetic heterodimerization modules and engineered a photosensitive kinesin-3, which is activated upon blue light–sensitive homodimerization. This opto-kinesin prevented motor activation before experimental onset, limited dark-state activation, and improved responsiveness. In addition, we adopted moss kinesin-14 for efficient retrograde transport with minimal adverse effects on endogenous transport. Using this optimized toolbox, we demonstrate robust reversible repositioning of (endogenously tagged) organelles within cellular populations. More robust control over organelle motility will aid in dissecting spatial cell biology and transport-related diseases.
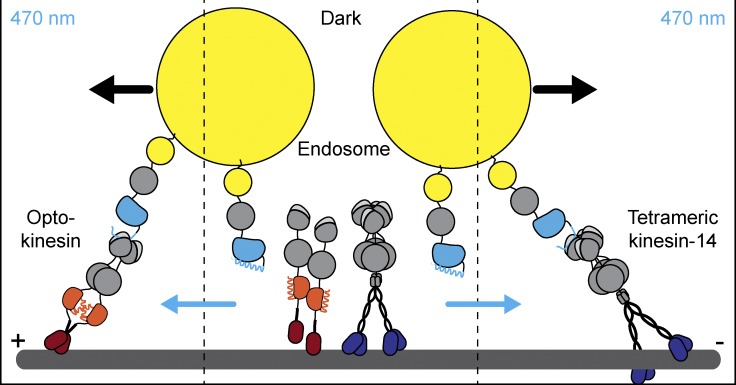
Graphical Abstract
Introduction
The directed transport and positioning of organelles is a fundamental property of eukaryotic cells that underlies cellular growth, polarity, and signaling. Long-range transport of organelles and other cellular constituents is mediated by motor proteins that move directionally along microtubules and actin. Transport toward the plus end of microtubules is mediated by members of the kinesin superfamily, whereas minus end–directed transport is mediated by dynein/dynactin as well as members of the atypical kinesin-14 family of minus end–directed kinesins (Vale, 2003).
To directly control organelle transport, we and others have developed assays using induced heterodimerization of organelle adaptor proteins to specific molecular motors (Adrian et al., 2017; Ballister et al., 2015; Duan et al., 2015; French et al., 2017; Gutnick et al., 2019; Harterink et al., 2016; Hoogenraad et al., 2003; Janssen et al., 2017; Kapitein et al., 2010a; Kapitein et al., 2010b; van Bergeijk et al., 2015). Inducing selective binding of motor proteins to specific organelles mediates directed transport along the cytoskeleton, which allows the selective subcellular enrichment or depletion of organelles. This approach enables addressing previously unanswerable questions about the functional relationship between organelle positioning and cellular pathways and has been used successfully in single cells, for example, to control axon outgrowth by modulating the distribution of recycling endosomes (van Bergeijk et al., 2015). To induce anterograde transport, these assays have mostly employed overexpressed constitutively active kinesins, such as truncations of kinesin-1 and kinesin-3. For retrograde transport, binding to the N-terminal part of the dynein/dynactin interaction protein BICD (BICDN) has been used to couple cargo to dynein/dynactin (Hoogenraad et al., 2003).
Earlier versions of these assays used chemically induced heterodimerization of FKBP and FRB, which requires the addition of a rapamycin analogue, is irreversible, and lacks spatial control. The subsequent adoption of various optogenetic heterodimerization systems greatly improved temporal acuity and provided reversibility and localized activation, but still several limitations remain. For example, the blue light–sensitive heterodimerization system TULIP is very sensitive to changes in expression levels because it is restricted to a sixfold increase in dimerization affinity upon illumination, and preventing dark-state activation is a major challenge (Strickland et al., 2012). Furthermore, the TULIP modules do not tolerate C-terminal fusions and cannot be used to directly label many organelle adaptors such as RAB proteins (van Bergeijk et al., 2015). The cryptochrome 2–derived Cry2 system homo-oligomerizes upon illumination, which can drive aggregation of the optogenetic modules and may perturb the function of Cry2-labeled organelles (Bugaj et al., 2013; Kennedy et al., 2010; Lee et al., 2014). The red/far-red light–sensitive phytochrome B system has a broad activation spectrum and requires the addition of the cofactor phycocyanobilin as well as continuous exposure with far-red light to prevent activation of the optogenetic module before experimental onset (Adrian et al., 2017; Levskaya et al., 2009).
The previously used constitutively active kinesins limit experimental robustness because these motors displace themselves from most cargoes, especially in neurons. Also, these overexpressed kinesin constructs potentially interfere with physiological transport pathways by dimerizing with and sequestering endogenous motor proteins or by saturating the microtubule lattice. Finally, BICDN overexpression can cause the mislocalization of organelles (Guardia et al., 2019; Hoogenraad et al., 2001), likely by displacing endogenous BICD from dynein/dynactin and thereby limiting dynein-based motility (Urnavicius et al., 2018). Together, these drawbacks have prevented the robust application of these methods in populations of cells. Examining the relationship between spatial distribution of organelles and cellular functions, such as signal transduction, has therefore remained challenging.
Several new optogenetic heterodimerization systems have recently been developed (Guntas et al., 2015; Kaberniuk et al., 2016; Kawano et al., 2015; Redchuk et al., 2017; Zimmerman et al., 2016). One of these, the improved light-induced dimer (iLID) system, employs a LOV2 domain that has been engineered to cage a bacterial SsrA peptide from binding its natural binding partner SspB. Three variants of the system were developed by mutational analysis of SspB: iLID-SspBWT (iLID nano; switches from 4.7 µM to 130 nM in blue light), iLID-SSPBR73Q (iLID micro; 47 µM to 800 nM), and iLID-SSPBAA58V/R73Q (iLID milli; >1 mM to 56 µM). All three variants showed an illuminated dimerization affinity increase of >25-fold over the dark state (Guntas et al., 2015; Zimmerman et al., 2016). The iLID system has the additional advantage that both the iLID photosensor and the SSPB adaptor are small and amenable to N-terminal and C-terminal fusions.
Here, we developed an optimized toolbox for the optical control of intracellular transport and organelle positioning. We adopted (1) the iLID optogenetic heterodimerization system to limit dark-state activation and enable cargo-labeling flexibility; (2) an optogenetic homodimerization system to create light-activatable kinesin; and (3) a plant-derived minus end–directed kinesin to circumvent dominant-negative effects introduced by the use of dynein adaptors. We show that these improvements allow the robust anterograde and retrograde repositioning of (endogenously labeled) organelles in populations of cells with minimal dark-state activation. Finally, we apply these tools to examine how the distribution of different organelles recovers from induced mislocalization.
Results
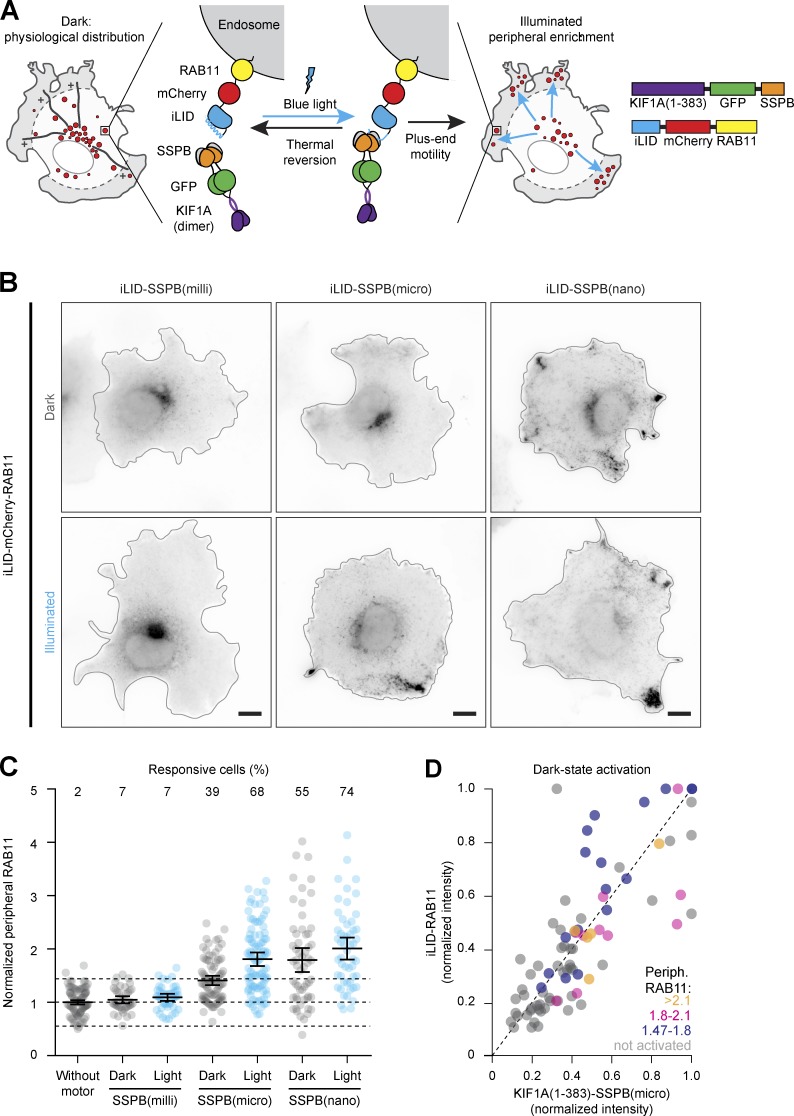
To couple motors to organelles, we created fusion constructs of iLID and mCherry-labeled organelle markers and fused the different SSPB variants to the dimeric kinesin-3 motor KIF1A(1–383). Light-induced heterodimerization of iLID to SSPB should then induce transport of the target cargo to the cell periphery (Fig. 1 A). We first tested peripheral enrichment of recycling endosomes in green monkey COS-7 cells that were transfected with the recycling endosome marker iLID-mCherry-RAB11 and globally exposed to blue light for 10 min immediately before fixation (Fig. 1, B–D). To quantify RAB11 distribution, we measured the fraction of mCherry intensity in the most peripheral 25% of the cell, typically 0.12 ± 0.03 (average ± SD) for control cells and normalized this fraction to control cells to correct for day-to-day variations in cellular density, resulting in the normalized peripheral fraction (NPF). Whereas KIF1A(1–383)-GFP-SSPB(milli) did not affect endosome distribution in either the presence or absence of blue light, KIF1A(1–383)-GFP-SSPB(micro) induced significant peripheral enrichment (defined as NPFblue light > NPFcontrol + 2× the SD of control cells without motor overexpression) of recycling endosomes in 68% of cells after illumination (NPF: 1.81 ± 0.12 95% confidence interval). However, 39% of nonilluminated cells also displayed an increase in NPF (1.41 ± 0.09), indicating binding of KIF1A to RAB11 in the dark (dark-state activation). This was most prominent in higher-expressing cells (Fig. 1 D). Unsurprisingly, dark-state activation was even stronger in cells expressing KIF1A(1–383)-GFP-SSPB(nano), of which 55% showed significant peripheral enrichment in the dark (NPF: 1.79 ± 0.22) and 74% in the light (NPF: 2.01 ± 0.2). Since the iLID-SSPB(micro) combination produced the largest responsive range in dark versus illuminated cells in our assay, we used it as our default optogenetic system in the rest of the study.
Figure 1.
Selecting optogenetic modules to reposition organelles. (A) Assay and constructs. Recycling endosomes (red) were tagged with fluorescently labeled RAB11 fused to iLID. Blue light illumination induced conformational changes to expose Jα helix for transient binding to KIF1A(1–383)-GFP-SSPB, promoting transport to the cellular periphery. (B–D) Fixed-cell imaging (B) and quantification (C and D) of iLID-mCherry-RAB11 in COS-7 cells expressing KIF1A(1–383) fused to GFP-SSPB(milli), GFP-SSPB(micro), or GFP-SSPB(nano) in the dark or after 10 min of illumination with 20 µW cm−2. Quantification in C shows the normalized iLID-mCherry-RAB11 intensity in the cellular periphery, defined as the 25% of cellular area that is most distal from the perinuclear region (gray in A). Dots represent one cell and bars indicate mean and 95% confidence intervals. Dotted lines represent the mean and the mean ± two times the SD of control cells. Numbers show the percentage of responsive cells for each dataset (peripheral enrichment greater than mean + two times the SD of control). Data from at least three experiments. (D) Graph showing normalized cellular expression levels of KIF1A(1–383)-GFP-SSPB(micro) and iLID-mCherry-RAB11 per cell in the dark, color coded for peripheral RAB11 intensity to indicate cells that were not activated (gray) or showed dark-state activation (yellow, magenta, and blue). Scale bars are 10 µm.
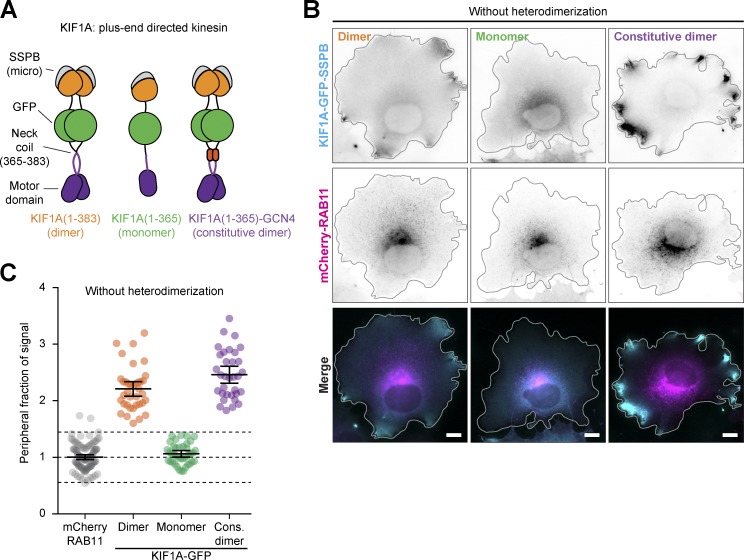
To enhance the dynamic range of our assays, we sought to introduce an additional layer of light-sensitive activation. The previously used truncated kinesin-3 construct, KIF1A(1–383), lacks the autoinhibitory tail domains and is constitutively active in the absence of cargo binding. However, KIF1A(1–383) retains the neck coil (aa 366–383), which forms the minimal dimerization domain and is essential for processive movement (the ability to take successive steps along the microtubule; Al-Bassam et al., 2003; Hammond et al., 2009; Lee et al., 2004; Soppina et al., 2014; van Bergeijk et al., 2015). By replacing the neck coil with a light-sensitive homodimerization domain, we reasoned that we could engineer a photosensitive kinesin that would switch from a mostly nonprocessive monomer to a processive dimer upon illumination with blue light. We therefore removed the neck coil to generate the monomeric truncation KIF1A(1–365), which was distributed homogenously throughout the cytosol (Fig. S1, A–C), as expected for a nonprocessive motor. Re-dimerizing KIF1A(1–365) by replacing the neck coil with an exogenous leucine zipper (GCN4) recovered peripheral accumulation of the motor, reinforcing the notion that kinesin-3 motility is strongly dependent on dimerization (Hammond et al., 2009; Soppina et al., 2014; Tomishige et al., 2002; Fig. S1, A–C).
Figure S1.
Disrupting kinesin-3 dimerization prevents spatial segregation between motor and cargo. Related to Fig. 2. (A) Design of kinesin-3 constructs. Monomeric and constitutively dimerized versions were engineered by deletion of the neck coil (aa 366–383) of KIF1A(1–383)-GFP-SSPB or replacement of the neck coil with the leucine zipper GCN4. (B and C) Fixed-cell imaging (B) and quantification (C) of KIF1A-GFP-SSPB variants and mCherry-RAB11 in COS-7 cells. Quantification (C) shows the NPF of intensity. Dots represent one cell and bars indicate mean and 95% confidence intervals. Dotted lines represent the mean and the mean ± two times the SD of RAB11 distribution. Data from three independent experiments. Scale bars are 10 µm.
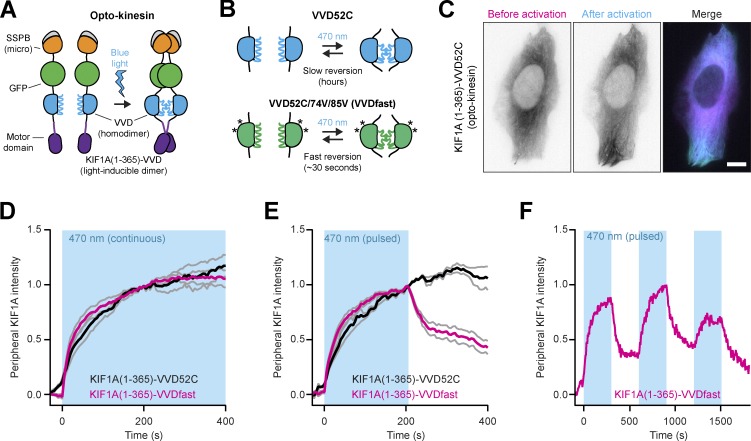
To engineer a light-sensitive kinesin (opto-kinesin hereafter), we replaced the neck coil with the small LOV domain of the Vivid (VVD) photoreceptor of Neurospora crassa, which transiently homodimerizes after illumination with blue light (Zoltowski and Crane, 2008) and which carries the Ile52Cys mutation (VVD52C), substantially stabilizing the homodimerization capacity (Nihongaki et al., 2014; Fig. 2, A and B) to generate KIF1A(1–365)-VVD52C. In the dark, this kinesin was distributed homogenously in the cytosol, but it faintly decorated microtubules, as expected for a monomeric kinesin-3. Under continuous illumination with blue light, we observed a rapid increase in microtubule decoration by and bulk peripheral accumulation of opto-kinesin (Fig. 2, C and D; and Video 1). However, when the activating blue light was subsequently turned off, KIF1A(1–365)-VVD52C remained enriched in the cellular periphery (Fig. 2 E). This could be explained by the unusually slow photocycle of the VVD module, which extends the lifetime of the dimer to several hours (Zoltowski et al., 2009).
Figure 2.
Engineering of opto-kinesin. (A) Design of opto-kinesin. A blue light–sensitive kinesin was engineered by replacing the neck coil (aa 366–383) of KIF1A(1–383)-GFP-SSPB with the blue light–sensitive homodimerization module VVD52C, generating KIF1A(1–365)-VVD52C-GFP-SSPB (opto-kinesin). (B) Schematic representation of the VVD52C and VVDfast modules. (C) Live-cell imaging of KIF1A(1–365)-VVD52C-mCherry-SSPB(micro) in U2OS cells before and after 10 min of illumination (see also Video 1). Scale bar is 10 µm. (D–F) Quantification of experiments as in C depicting normalized peripheral intensity of the two opto-kinesins relative to preillumination state following continuous (D) or pulsed (E and F) illumination (470 nm; blue box). Graphs in D and E represent mean and SEM of at least four cells.
Video 1.
Activation of opto-kinesin KIF1A(1–365)-VVD52C-GFP-SSPB(micro) in a U2OS cell during global 470-nm illumination. This video corresponds to Fig. 2 C. Total time: 10 min and 35 s. Acquired with 5 s between frames. 150× sped up.
To improve the off-kinetics of the opto-kinesin, we introduced mutations Ile74Val and Ile85Val to the Per-Arnt-Sim (PAS) core of the LOV domain of VVD52C (Fig. 2 B), which substantially shorten the VVD photocycle, albeit with some reduction in dimerization efficiency (Kawano et al., 2015; Nihongaki et al., 2014; Zoltowski et al., 2009), generating the rapidly reversing variant KIF1A(1–365)-VVDfast. Upon illumination, this motor rapidly enriched in the cellular periphery (Fig. 2 D), but now also rapidly reversed to its preactivation distribution after illumination (Fig. 2 E), even after multiple rounds of activation (Fig. 2 F). This confirmed that the fast opto-kinesin switched both on and off with sufficient temporal acuity for this assay.
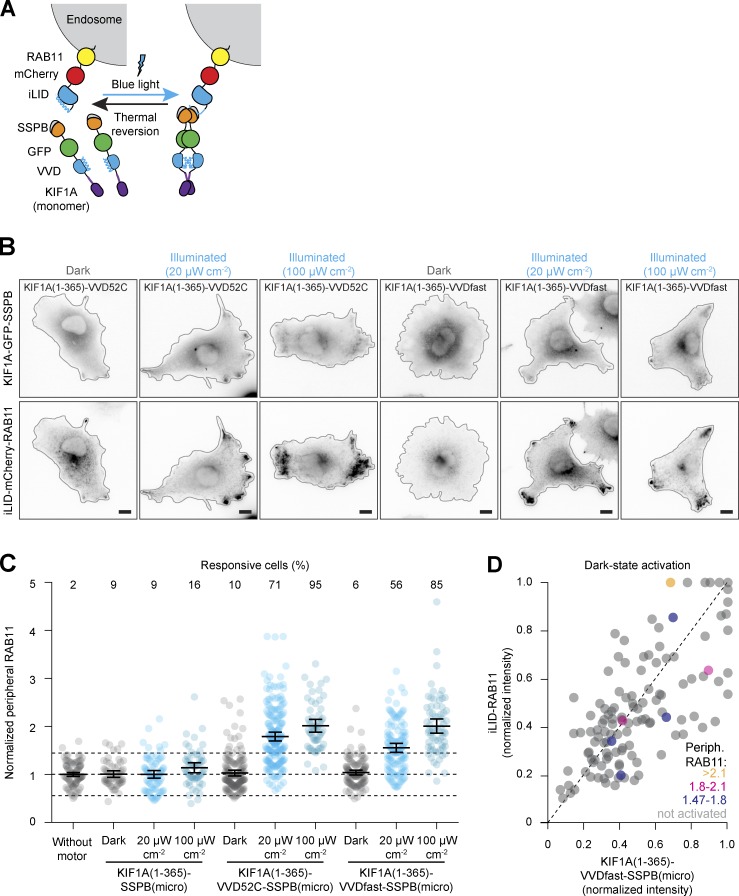
To test whether the introduction of a second layer of light-sensitive control improved the dynamic range of the assay, we again tested the peripheral enrichment of iLID-mCherry-RAB11 in opto-kinesin–expressing COS-7 cells after 10 min of exposure to blue light (Fig. 3, A–D). Indeed, dark-state activation was strongly reduced in cells expressing KIF1A(1–365)-VVD52C-SSPB(micro) or KIF1A(1–365)-VVDfast-SSPB(micro) compared with nonilluminated cells expressing KIF1A(1–383)-SSPB(micro) at similar levels (Fig. 1 C). Instead, the dark-state activation for both opto-kinesins was comparable to that of the monomer KIF1A(1–365). The much lower dark-state activation of the monomer suggests that low levels of iLID-SSPB binding do not affect organelle distribution in the case of a nonprocessive motor.
Figure 3.
Dual-layer optogenetic control limits dark-state activation of transport. (A) Assay: blue light illumination induces both dimerization of the opto-kinesin KIF1A(1–365)-VVD-GFP-SSPB(micro) and binding of the KIF1A motor to iLID-mCherry-RAB11, together stimulating plus end–directed intracellular transport of recycling endosomes into the cellular periphery. (B–D) Fixed-cell imaging (B) of indicated constructs in COS-7 cells in the dark or after illumination with low-intensity (20 µW cm−2, as in Fig. 1, B and C) or high-intensity (100 µW cm−2) blue light. Quantification in C shows the NPF of RAB11 intensity. Each dot represents one cell and bars indicate mean and 95% confidence intervals. Dotted lines represent the mean and the mean ± two times the SD of control cells. Numbers show the percentage of responsive cells for each dataset (peripheral enrichment greater than mean + two times the SD of control). Data were from at least three experiments. Graph in D shows normalized cellular expression levels of indicated constructs per cell in the dark, color coded for peripheral RAB11 intensity to indicate cells that were nonresponsive (gray) or showed dark-state activation (yellow, magenta, and blue). Scale bars are 10 µm.
Upon illumination with 20 µW cm−2 of blue light (as in Fig. 1, B and C), both opto-kinesins induced peripheral accumulation of RAB11. In contrast, the monomeric KIF1A(1–365) was unable to induce peripheral accumulation, demonstrating that dimerization of opto-kinesins is required to drive effective cargo transport (Fig. 3 C). Nonetheless, many cells expressing KIF1A(1–365)-VVDfast-SSPB(micro) failed to respond, likely because of the weaker dimerization capacity of the VVDfast module. Indeed, cells expressing KIF1A(1–365)-VVD52C-SSPB(micro), a more stable dimer, responded similarly to cells expressing KIF1A(1–383)-SSPB(micro) (Fig. 3 C; NPF: 1.90 ± 0.10 and 1.81 ± 0.12, respectively). We reasoned that the opto-kinesins might require a higher light dosage for full activation and decided to optimize the illumination regimen. We increased the blue light dosage to 100 µW cm−2, and this significantly improved overall peripheral enrichment of recycling endosomes as well as cellular responsiveness (Fig. 3, B and C; opto-kinesin 95%, fast opto-kinesin 85%). Thus, by adopting an optogenetic system with a larger dynamic range, introducing a second light-sensitive activation step, and optimizing the illumination regimen, we optimized our organelle-positioning assay to robustly induce peripheral redistribution in populations of cells with minimal dark-state activation.
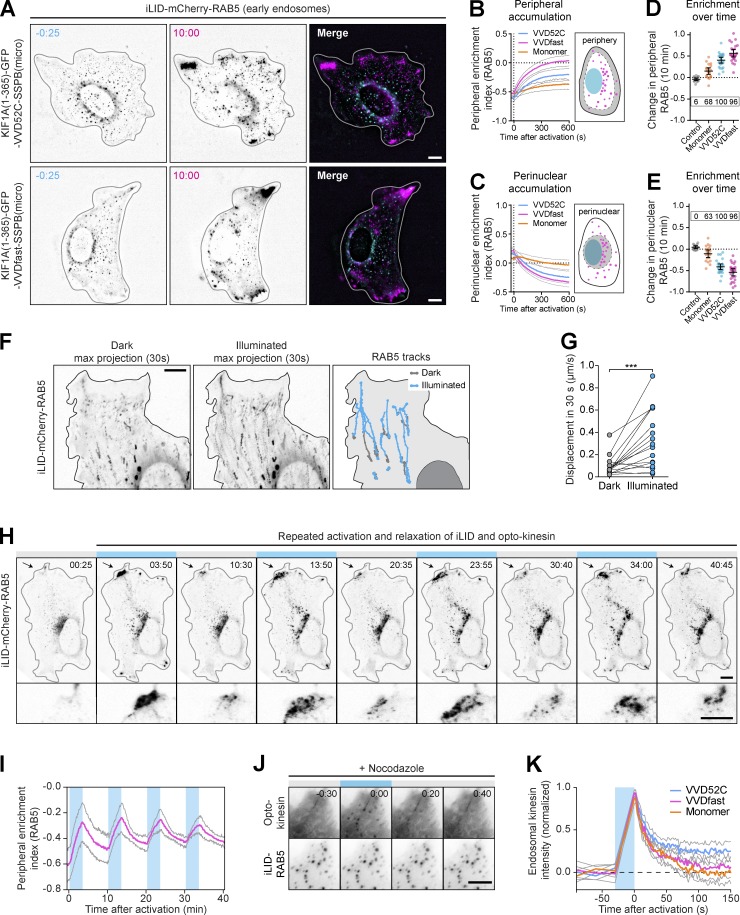
To directly probe organelle redistribution dynamics, we next performed live-cell imaging experiments. To facilitate image quantification and organelle tracking, we chose to redistribute RAB5-positive early endosomes, which are more homogeneously distributed and sparser than RAB11-positive recycling endosomes. We generated the construct iLID-mCherry-RAB5 to label early endosomes and expressed this in U2OS cells in the presence or absence of KIF1A-SSPB (Fig. 4, A–E). Cells were illuminated with blue light for 10 min, and we measured the relative mCherry-RAB5 intensity in both the peripheral region (Fig. 4 B) and the perinuclear region (Fig. 4 C) during illumination as well as the overall per-cell change in peripheral and perinuclear RAB5 intensities (Fig. 4, D and E). In the absence of exogenous motors, early endosomes were sparsely distributed throughout the cytosol, which was unaffected by illumination. However, in cells expressing the opto-kinesins, we observed rapid and efficient peripheral accumulation of early endosomes in >95% of cells (Fig. 4, A–E) after illumination. To validate that this repositioning was mediated by the dimerized form of opto-kinesin, we probed the redistribution capacity of the monomer KIF1A(1–365)-SSPB(micro). This monomer was capable of peripherally enriching early endosomes in 68% of cells, albeit far less efficiently than both opto-kinesins, confirming that opto-kinesin mainly repositions early endosomes as a dimer.
Figure 4.
Robust and multicycle peripheral organelle redistribution with opto-kinesin. (A–E) Live-cell imaging (A) and quantification (B–E) of U2OS cells expressing the indicated constructs before or after 10 min of illumination with blue light (see also Video 2 and Video 3 for top and bottom). (B–E) Graphs depicting peripheral enrichment (B) or perinuclear enrichment (C) of iLID-mCherry-RAB5 before and during illumination. Peripheral enrichment index was defined as (peripheral RAB5/total RAB5) − (nonperipheral RAB5/total RAB5), with the peripheral region defined as a 9.13-µm band along the cellular outline (see cartoon in B). Perinuclear enrichment index was similarly defined for the area around the nucleus and the perinuclear vesicle cloud (see cartoon in C). Plots in D and E depict per-cell change in peripheral (D) or perinuclear (E) enrichment index after 10 min of illumination. Dots represent one cell and bars indicate mean and 95% confidence intervals. Dotted lines represent the mean of control cells. Boxed numbers show the percentage of responsive cells for each dataset (peripheral or perinuclear enrichment greater than mean + two times the SD of control). Graphs represent mean and 95% confidence intervals of at least 15 cells from a total of at least three experiments. (F and G) Live-cell imaging (F) and quantification (G) of iLID-mCherry-RAB5 in U2OS cell expressing opto-kinesin KIF1A(1–365)-VVDfast before and after global illumination with blue light (see also Video 5). Left and middle panels show maximum intensity projections of a 30-frame time-lapse during 30 s. Right panel shows manually tracked trajectories of individual early endosomes before (gray) and after illumination (cyan). (G) Quantification of change in displacement of early endosomes tracked in (F) over 30 s before (left, gray) and during illumination (right, cyan). Asterisks indicate significance (Student’s t test, paired). ∗∗∗, P = 0.0009. (H and I) Live-cell imaging (H) and quantification (I) of iLID-mCherry-RAB5 in U2OS cell expressing opto-kinesin KIF1A(1–365)-VVDfast during pulsed global illumination (see also Video 6). Cell was exposed to four illumination cycles of 200 s of blue light, followed by 400 s of darkness. Bottom panels show enlarged region indicated by arrow in top panels. (I) Quantification of peripheral enrichment index of iLID-mCherry-RAB5 (magenta). Graph represents mean and 95% confidence intervals of six experiments. (J and K) Live-cell imaging (J) and quantification (K) of iLID-mCherry-RAB5 and opto-kinesin KIF1A(1–365)-VVDfast-mVenus-SSPB(micro) in U2OS cells treated with nocodazole (10 µM) to depolymerize microtubules. Cells were illuminated continuously for 30 s with 100 µW cm−2 of blue light, followed by 150 s of darkness. Graph in K shows normalized intensity of opto-kinesin on individual endosomes. Blue boxes indicate 470-nm illumination. Scale bars are 10 µm or 5 µm (K).
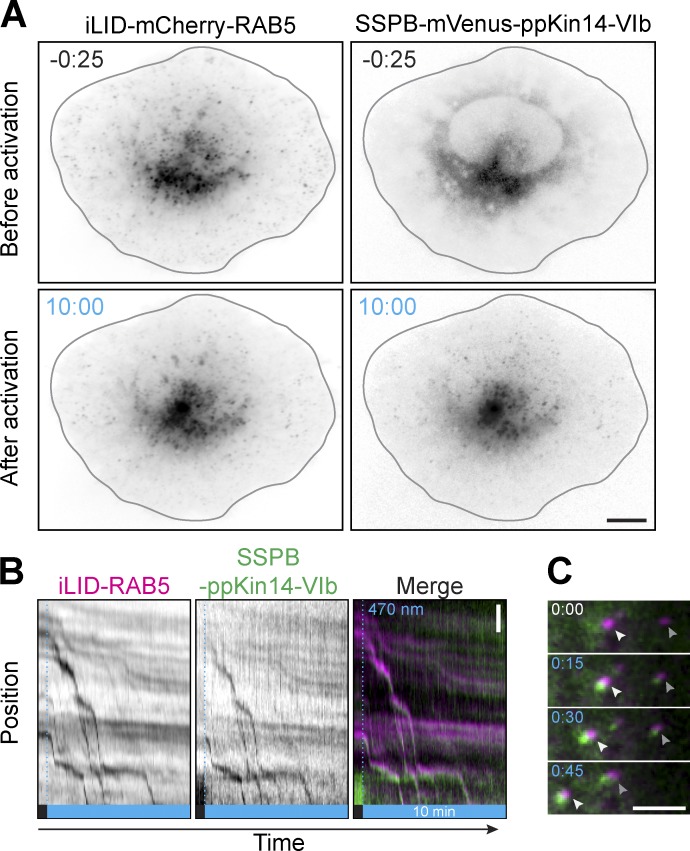
For both opto-kinesins, individual early endosomes were transported rapidly and persistently toward the periphery starting 20–30 s after illumination (Fig. 4 B; Fig. S2, A–C; Video 2; Video 3; and Video 4), although a pool of larger and more perinuclear early endosomes were transported only after a delay, if at all, likely because these endosomes were anchored to other structures. Nevertheless, the majority of mCherry-RAB5 was redistributed, of which 40–50% was transported into the cellular periphery during imaging, and this was reflected by a similar depletion of early endosomes from the perinuclear region. The peripheral accumulation of mCherry signal was indeed made up of RAB5-positive vesicles instead of unincorporated cytosolic RAB5, as validated by single organelle tracking (Fig. 4, F and G; and Video 5).
Figure S2.
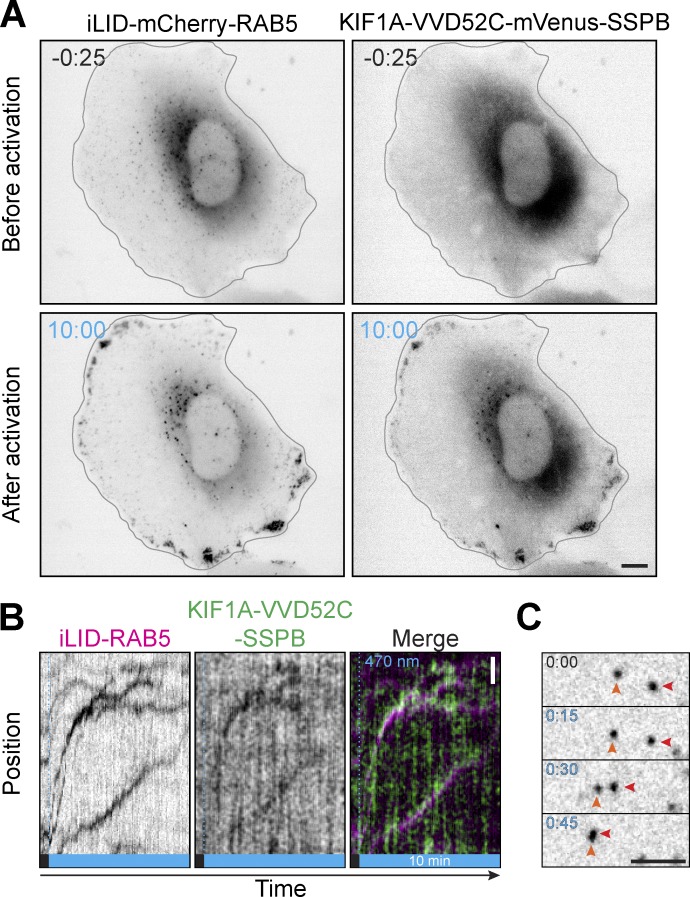
Dual color live-cell imaging of opto-kinesin and iLID mCherry-RAB5. Related to Fig. 4. (A) Live-cell imaging of iLID-mCherry-RAB5 and opto-kinesin KIF1A(1–365)-VVDfast-mVenus-SSPB(micro) in U2OS before and after 10 min of illumination (see also Video 4). Scale bar is 10 µm. (B) Kymograph showing early endosome motility and induced colocalization with opto-kinesin as in A. (C) Example of induced early endosome motility (marked by arrowheads) as in A, before and immediately after illumination. Scale bar is 5 µm.
Video 2.
Repositioning of iLID-mCherry-RAB5 with opto-kinesin KIF1A(1–365)-VVD52C-GFP-SSPB(micro) in a U2OS cell during global 470-nm illumination. This video corresponds to Fig. 4 A. Total time: 10 min and 35 s. Acquired with 5 s between frames. 150× sped up.
Video 3.
Repositioning of iLID-mCherry-RAB5 with opto-kinesin KIF1A(1–365)-VVDfast-GFP-SSPB(micro) in a U2OS cell during global 470-nm illumination. This video corresponds to Fig. 4 A. Total time: 10 min and 35 s. Acquired with 5 s between frames. 150× sped up.
Video 4.
Dual-color imaging of KIF1A(1–365)-VVD52C-mVenus-SSPB(micro) activation and repositioning of iLID-mCherry-RAB5 in a U2OS cell during global 470-nm illumination. This video corresponds to Fig. S2. Total time: 10 min and 35 s. Acquired with 5 s between frames. 150× sped up.
Video 5.
Repositioning of iLID-mCherry-RAB5 with opto-kinesin KIF1A(1–365)-VVDfast-GFP-SSPB(micro) in a U2OS cell during global 470-nm illumination. This video corresponds to Fig. 4 F. Total time: 6 min. Acquired with 1 s between frames. 15× sped up.
To probe reversibility of the assay, we tested the response of cells to multiple rounds of stimulation and relaxation. Cells expressing iLID-mCherry-RAB5 and the rapidly reversing opto-kinesin KIF1A(1–365)-VVDfast-SSPB(micro) were illuminated in 200-s pulses interspersed by 400-s dark phases, allowing refolding of the LOV domains and dissociation of opto-kinesin. This revealed that early endosomes that had moved to the periphery during blue light illumination got repositioned toward their physiological position in the absence of optical stimulation, most likely through the action of endogenous motor proteins. This cycle was repeated three times, and robust peripheral accumulation in the light and redistribution in the dark was observed throughout the experiment (Fig. 4, H and I; and Video 6). To confirm that dissociation of kinesin was not rate-limiting in this assay, we directly probed the release of mVenus-SSPB–labeled KIF1A(1–365) and opto-kinesin from early endosomes after illumination in cells that were treated with nocodazole to disassemble microtubules in order to prevent organelle motility (Fig. 4, J and K). Indeed, we found that the time scale of motor dissociation was much quicker (∼50 s) than the time scale of organelle redistribution (several minutes). These results demonstrate that the opto-kinesins allowed robust anterograde organelle redistribution over multiple cycles of activation.
Video 6.
Repositioning of iLID-mCherry-RAB5 with opto-kinesin KIF1A(1–365)-VVDfast-GFP-SSPB(micro) in a U2OS cell during pulsed global 470-nm illumination. This video corresponds to Fig. 4 H. Total time: 40 min and 35 s. Acquired with 5 s between frames. 300× sped up.
Next, we set out to optimize retrograde transport, because the previously used truncated dynein adaptor BICD2 (BICDN) can function as a dominant negative and disrupt organelle distribution in some cells (Guardia et al., 2019; Hoogenraad et al., 2001). We first explored the extent of these dominant-negative effects of BICDN overexpression in our assay. Instead of optogenetic heterodimerization, we used a chemically induced heterodimerization system that allows inducible recruitment of an FKBP12 domain to an FRB domain upon addition of the cell-permeable small molecule AP21967 (rapalog hereafter). This ensured that the peripheral dispersion of endosomes that could result from BICDN overexpression would not be masked by dark-state binding to BICDN. Indeed, whereas FKBP-mCherry-RAB11–labeled recycling endosomes were efficiently recruited to the perinuclear region after the addition of rapalog, we occasionally observed that the distribution of recycling endosomes was perturbed in BICDN-expressing cells that were not exposed to rapalog (Fig. 5 A).
Figure 5.
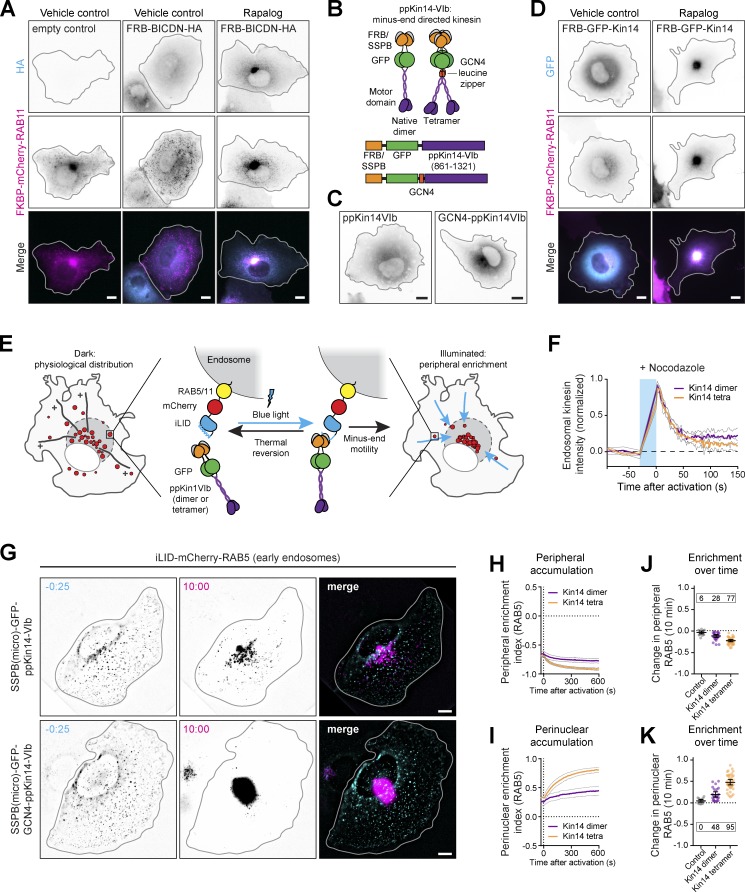
Minus end–directed organelle redistribution using moss-derived kinesin-14. (A) Fixed-cell imaging of recycling endosomes (middle) tagged with FKBP-mCherry-RAB11 and the dynein adaptor FRB-BICDN-HA (top) in COS-7 cells, with or without rapalog (100 nM, 1-h treatment). (B) Moss-derived kinesin-14 VIb constructs. Addition of GCN4 leucine zipper creates a dimer of dimers, effectively creating a tetrameric motor. (C) Fixed-cell imaging of kinesin-14 VIb constructs in COS-7 cells. (D) Similar to A, but with cells expressing dimeric FRB-GFP–ppKin14-VIb. (E) Assay: early endosomes were tagged with iLID-mCherry-RAB5. Blue light illumination induced unfolding of iLID and binding to SSPB-GFP–ppKin14-VIb or SSPB-GFP-GCN4–ppKin14-VIb, stimulating anterograde transport (gray). (F) Quantification of live-cell imaging of iLID-mCherry-RAB5 and opto-kinesin KIF1A(1–365)-VVDfast-mVenus-SSPB(micro) in U2OS cells treated with nocodazole (10 µM) to depolymerize microtubules. Cells were illuminated continuously for 30 s with 100 µW cm−2 of blue light, followed by 150 s of darkness. Graph shows normalized intensity of opto-kinesin on individual endosomes. (G) Live-cell imaging and quantifications (H–K) of iLID-mCherry-RAB5 in U2OS cells expressing the indicated constructs before or after 10 min of illumination. Quantifications in H–K show peripheral enrichment index (H) or perinuclear enrichment index (I) of iLID-mCherry-RAB5. Plots in J and K show per-cell change in peripheral (J) or perinuclear (K) enrichment index after 10 min. Dots represent one cell and bars indicate mean and 95% confidence intervals. Dotted lines represent the mean of control cells. Boxed numbers show the percentage of responsive cells for each dataset (peripheral or perinuclear enrichment greater than mean + two times the SD of control). Graphs represent mean and 95% confidence intervals of at least 15 cells from a total of at least three experiments. Blue box indicates 470-nm illumination. Scale bars are 10 µm.
As an alternative retrograde motor, we explored the possibility of adopting a minus end–directed kinesin-14. However, most kinesin-14 motors are slow and either weakly processive as single motors (Braun et al., 2017; Endow and Waligora, 1998; Furuta and Toyoshima, 2008; Norris et al., 2018) or, in the case of Saccharomyces cerevisiae Kar3, require heterodimerization with a nonmotor subunit (Hepperla et al., 2014; Mieck et al., 2015). Previous work has shown that all mammalian kinesin-14 motors were rather inefficient transporters of peroxisomes (Lipka et al., 2016). Interestingly, land plants have lost most genes encoding dynein components (Lawrence et al., 2001) but have evolved several highly processive and fast minus end–directed kinesins to serve as a dynein-independent mechanism for retrograde transport. In particular, type VI kinesin-14 b of the moss Physcomitrella patens (ppKin14-VIb hereafter) is the fastest reported minus end–directed kinesin and, although nonprocessive as a native dimer, shows highly processive motility when clustered as dimer of dimers (Jonsson et al., 2015; Yamada et al., 2017). We engineered fusion constructs of FRB-GFP or SSPB(micro)-GFP and the native dimeric form ppKin14-VIb(861–1321) or the tetramerized variant GCN4-ppKin14-VIb(861–1321) (Fig. 5 B). Both versions of this moss-derived motor were well expressed in mammalian cells (Fig. 5 C). We found that ppKin14-VIb localized homogenously throughout the cytosol, which is in line with the observation that the native dimer is not processive in vitro (Jonsson et al., 2015). In contrast, the tetramerized construct, GCN4–ppKin14-VIb, weakly decorated microtubules as well as the microtubule-organizing center. When we examined the capacity of these minus end–directed kinesins to transport FKBP-mCherry-RAB11 in COS-7 cells, we observed that FRB-GFP–ppKin14-VIb efficiently accumulated recycling endosomes in the perinuclear region. Importantly, in the absence of rapalog, even high overexpression of FRB-GFP–ppKin14-VIb did not affect recycling endosome localization (Fig. 5 D).
Next, we performed live-cell imaging experiments to probe the dynamics of retrograde transport using ppKin14-VIb in our optogenetic organelle repositioning assay (Fig. 5 E). We first validated that tetramerization of ppKin14-VIb would not perturb motor dissociation from cargo (Fig. 5 F) and then expressed iLID-mCherry-RAB5 and either motor variant in U2OS cells to monitor the distribution of early endosomes. We found that the native dimer induced retrograde transport of most individual early endosomes, albeit slowly and inefficiently (Fig. 5, G–K; Fig. S3, A–C; and Video 7). In contrast, the tetramerized motor induced rapid and persistent retrograde transport of early endosomes and nearly completely depleted RAB5 from the periphery (Fig. 5, G–K; and Video 8). Together, these results show that clustered teams of moss-derived ppKin14-VIb can mediate rapid and efficient retrograde transport of organelles, without negatively affecting endogenous trafficking. Whereas the native dimer ppKin14-VIb did not efficiently cluster early endosomes within 10 min, this motor could be an attractive alternative for slower retrograde transport of larger structures, such as mitochondria.
Figure S3.
Dual color live-cell imaging of moss kinesin-14 and iLID-mCherry-RAB5. Related to Fig. 5. (A) Live-cell imaging of iLID-mCherry-RAB5 and SSPB(micro)-mVenus–ppKin14-VIb in U2OS before and after 10 min of illumination (see also Video 7). Scale bar is 10 µm. (B) Kymograph showing early endosome motility and induced colocalization with ppKin14-VIb as in A. (C) Example of induced early endosome motility (marked by arrowheads) as in A, before and immediately after illumination. Scale bar is 5 µm.
Video 7.
Dual-color imaging of SSPB(micro)-mVenus-ppKin14-VIb and repositioning of iLID-mCherry-RAB5 in a U2OS cell during global 470-nm illumination. This video corresponds to Fig. S3. Total time: 10 min and 35 s. Acquired with 5 s between frames. 150× sped up.
Video 8.
Repositioning of iLID-mCherry-RAB5 with minus end–directed kinesin SSPB(micro)-GFP-GCN4-ppKin14-VIb in a U2OS cell during global 470-nm illumination. This video corresponds to Fig. 5 G. Total time: 10 min and 35 s. Acquired with 5 s between frames. 150× sped up.
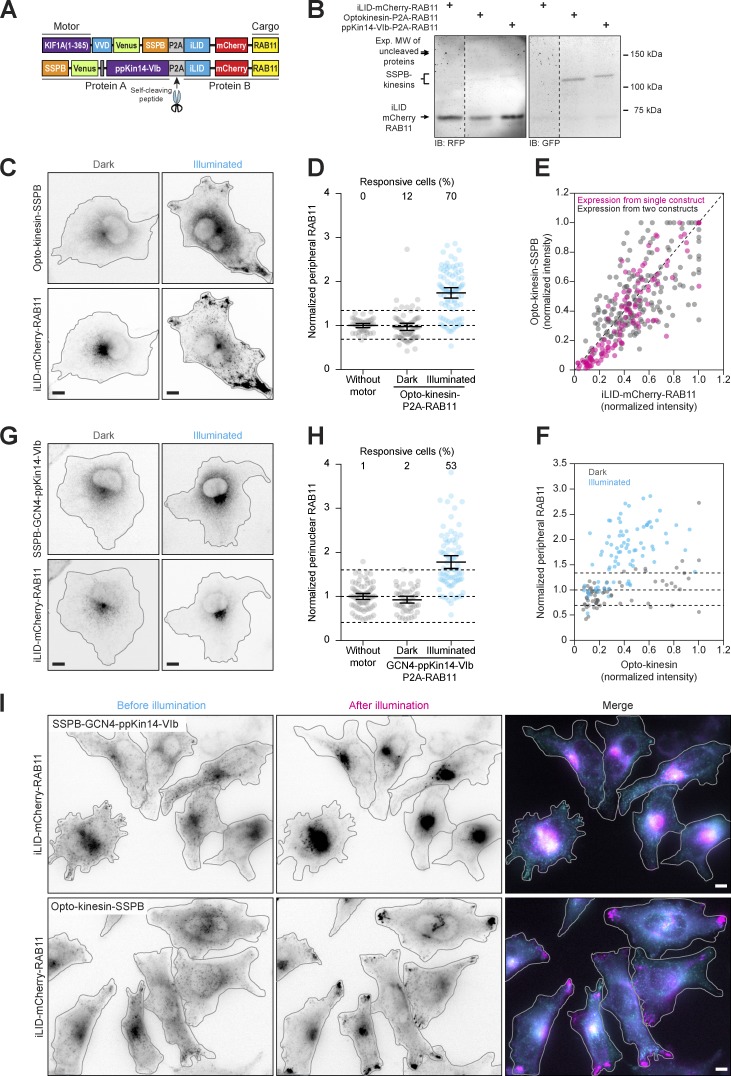
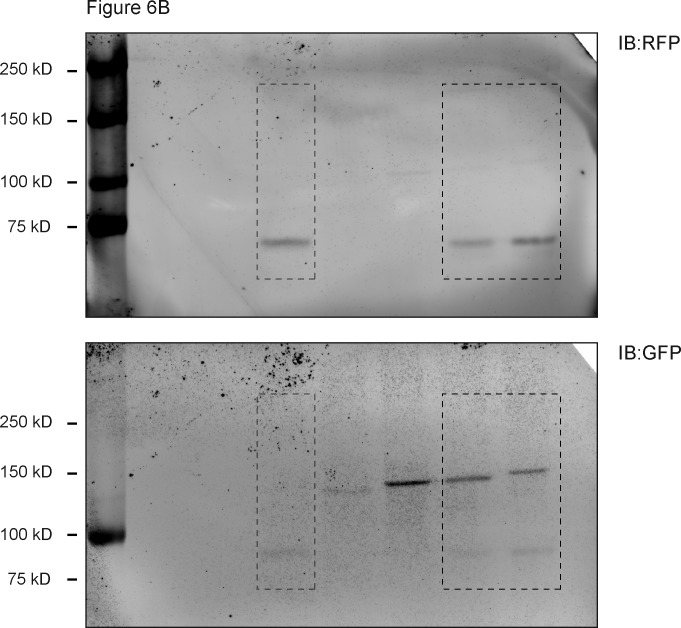
To explore the functional significance of specific organelle distributions, it is important to robustly control organelle transport in populations of cells. To better control the relative expression levels of motor and cargo, we designed two constructs in which either opto-kinesin–SSPB or SSPB-GCN4–ppKin14-VIb was fused to iLID-mCherry-RAB11 on a single plasmid, separated by a self-cleaving P2A peptide. This design ensures equimolar expression levels for both motor and cargo from a single mRNA (Fig. 6 and Fig. S4). We first validated that the P2A peptide was efficiently cleaved by immunoblotting (Fig. 6 B) before confirming the peripheral enrichment of iLID-mCherry-RAB11 in COS-7 cells after 10 min of exposure to blue light (Fig. 6, C–F). Expression of opto-kinesin and iLID-mCherry-RAB11 from a single plasmid did not strongly affect dark-state activation or responsiveness (Fig. 6 D), but the single plasmid approach reduced the degree of expression variation between motor and cargo per cell (Fig. 6 E). The plasmid with the minus end motor induced efficient clustering of RAB11 in the cell center (Fig. 6, G and H).
Figure 6.
Application of the optimized optogenetic toolbox to populations of cells. (A) Constructs: use of a P2A self-cleaving peptide enables expression of iLID-mCherry-RAB11 with SSPB-Kin14-VIb or opto-kinesin-SSPB at equimolar levels from a single construct. (B) Immunoblot (IB) of whole-cell lysates from U2OS cells expressing the indicated proteins. Dotted lines indicate the excision of lanes. Exp. MW, expected molecular weight. (C–F) Fixed-cell imaging (C) and quantification (D–F) of iLID-mCherry-RAB11 and opto-kinesin KIF1A(1–365)-VVDfast-GFP-SSPB(micro) from a single plasmid in COS-7 cells in the dark or after illumination with blue light (100 µW cm−2). (D) Quantification showing the NPF of RAB11 intensity. (E) Graph showing normalized cellular expression levels of KIF1A(1–365)-VVDfast-GFP-SSPB(micro) and iLID-mCherry-RAB11 when expressed from a single plasmid (magenta) as in A or using two separate constructs for motor and cargo (gray). (F) Graph showing normalized cellular expression levels of KIF1A(1–365)-VVDfast-GFP-SSPB(micro) and the peripheral fraction of RAB11 per cell in the dark (gray) and after illumination (blue). (G and H) Fixed-cell imaging (G) and quantification (H) of iLID-mCherry-RAB11 and SSPB(micro) in COS-7 from a single plasmid in COS-7 cells in the dark or after illumination with blue light (100 µW cm−2). Graph in H shows the normalized perinuclear fraction of RAB11 intensity (mean RAB11 MTOC intensity/mean cellular RAB11 intensity). (I) Live-cell imaging of iLID-mCherry-RAB11 in HeLa Flp-in cells treated with doxycycline to induce the equimolar expression of SSPB-GCN4-mVenus–ppKin14-VIb and iLID-mCherry-RAB11 (top; see also Video 9) or of KIF1A(1–365)-VVDfast-mVenus-SSPB(micro) and iLID-mCherry-RAB11 (bottom; see also Video 10) before or during illumination. Dots represent one cell and bars indicate mean and 95% confidence intervals. Dotted lines represent the mean and the mean ± two times the SD of control cells. Numbers show the percentage of responsive cells for each dataset. Data were from at least three experiments. Scale bars are 10 µm.
Figure S4.
Full scans of all immunoblot images. Related to Fig. 6. IB, immunoblot.
We next subcloned the motor-P2A-RAB11 modules into a pCDNA5/Flp recombination target (FRT)/TO backbone and targeted these plasmids into a single genomic integration site in HeLa Flp-in cells using Flp-FRT recombination to generate cell lines stably expressing these constructs from a doxycycline-inducible promoter to ensure comparable genetic background and expression levels. Overnight stimulation with doxycycline induced the expression of iLID-mCherry-RAB11 and motor proteins in both cell lines. Live-cell imaging demonstrated that upon illumination, recycling endosomes became perinuclearly enriched in all mCherry-ppKin14-VIb–positive cells within the field of view (Fig. 6 I and Video 9). Similarly, in the opto-kinesin cells, recycling endosomes were enriched in the cellular periphery of all mCherry-positive cells in the field of view (Fig. 6 I and Video 10), demonstrating that this approach allows the robust optogenetic control of both anterograde and retrograde organelle repositioning in populations of cells.
Video 9.
Repositioning of stably expressed iLID-mCherry-RAB11 with minus end–directed kinesin SSPB(micro)-mVenus-GCN4-ppKin14-VIb in multiple HeLa Flp-in cells during global 470-nm illumination. This video corresponds to Fig. 6 I. Total time: 27 min. Acquired with 30 s between frames. 300× sped up.
Video 10.
Repositioning of stably expressed iLID-mCherry-RAB11 with opto-kinesin KIF1A(1–365)-VVDfast-mVenus-SSPB(micro) in multiple HeLa Flp-in cells during global 470-nm illumination. This video corresponds to Fig. 6 I. Total time: 27 min. Acquired with 30 s between frames. 300× sped up.
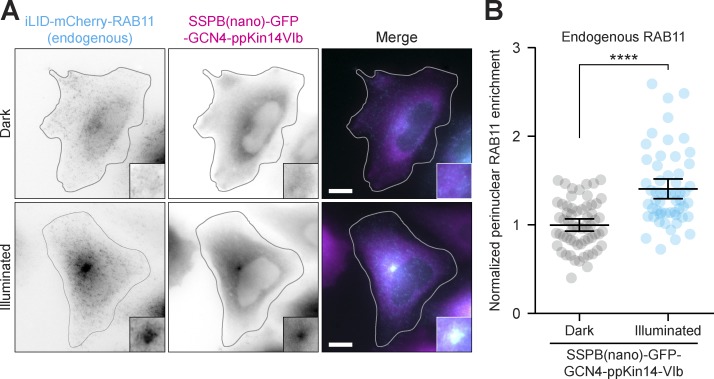
To reposition endogenously tagged organelles, we next generated an iLID-mCherry-RAB11 knock-in line in HeLa cells using CRISPR-Cas9–mediated genome editing, which did not affect RAB11 localization. To induce retrograde repositioning of endogenously tagged RAB11, we expressed SSPB(nano)-GFP-GCN4–ppKin14-VIb and found that upon illumination endogenous RAB11 was significantly enriched in the center of the cell compared with nonilluminated cells (Fig. 7, A and B). Importantly, we were unable to efficiently reposition endogenous RAB11 using the lower affinity SSPB(micro) variant of GCN4–ppKin14-VIb, likely because the low expression level of endogenous RAB11 requires a higher affinity coupling to motors to be repositioned efficiently. Thus, we demonstrate the repositioning of organelles without overexpression of organelle adaptors.
Figure 7.
Application of the optimized optogenetic toolbox to endogenously tagged cargo. (A and B) Fixed-cell imaging (A) and quantification (B) of recycling endosomes, endogenously tagged with iLID-mCherry-RAB11 and transiently expressed SSPB(nano)-GFP-GCN4–ppKin14-VIb in HeLa cells, in the dark or after 30 min of blue light. Insets show 2.5-fold magnifications of the MTOC region. (B) Quantification shows the normalized enrichment of RAB11 at the MTOC relative to nonilluminated cells. Dots represent one cell and bars indicate mean and 95% confidence intervals. Data were from three independent experiments. Scale bars are 10 µm. Asterisks indicate significance (Student’s t test, unpaired). ∗∗∗∗, P < 0.0001.
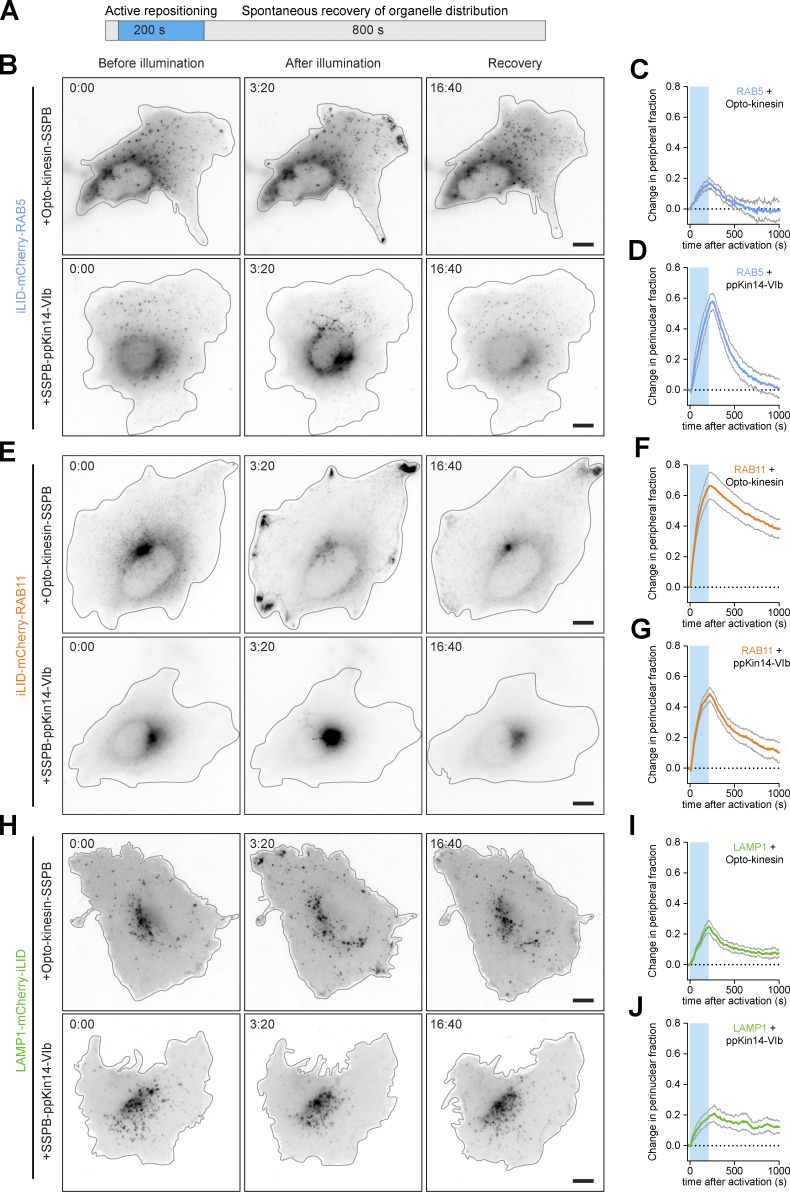
Finally, we applied our optimized toolbox to explore how the reversibility of positioning after induced misplacement differs between different organelles. We transfected U2OS cells with iLID fused to markers for late endosomes/lysosomes, early endosomes, or recycling endosomes and opto-kinesin–SSPB or SSPB-GCN4–ppKin14-VIb. Cells were then illuminated with blue light for 200 s (Fig. 8 A), after which the blue light was switched off and the recovery of organelle distributions was monitored. This revealed that early endosomes were highly dynamic and completely regained their original distribution within 500–1,000 s (Fig. 8, B–D). Importantly, because of the short activation time, early endosomes were not displaced to the extent observed in Fig. 4, A and B, and Fig. 5, G–I, where cells were illuminated for 600 s. Recycling endosomes also regained their distribution (Fig. 8, E–G), but more slowly, and did not completely recover from peripheral enrichment within the course of the assay, in line with our earlier observation that full recovery of RAB11 distribution requires 30 min (Adrian et al., 2017). Strikingly, we observed that perinuclear enrichment of recycling endosomes was reversed more quickly than peripheral enrichment, possibly because recycling endosomes interact with the endocytic and exocytic machineries in the cellular periphery. Finally, lysosomes did show some distribution restoration but appeared to settle on a new base line (Fig. 8, H–J). Together, these results demonstrate that different endolysosomes differ in their degree of displacement and the speed of recovery from displacement, as well as the degree of recovery from either anterograde or retrograde displacement.
Figure 8.
Spontaneous recovery from induced repositioning reveals transport dynamics of different organelles. (A) Assay. (B–J) Live-cell imaging (B, E, and H) and quantifications (C, D, F, G, I, and J) of LAMP1-mCherry-iLID (B–D), iLID-mCherry-RAB5 (E–G), or iLID-mCherry-RAB11 (H–J) in U2OS cells expressing opto-kinesin KIF1A(1–365)-VVDfast-GFP-SSPB(micro) or SSPB(micro)-GFP-GCN4-ppKin14-VIb before, during (middle), or 800 s after 200 s of illumination with blue light. Quantifications show change in peripheral organelle enrichment index (C, F, and I) or change in perinuclear enrichment index (D, G, and J). Graphs represent mean and SEM of at least three cells. Blue box indicates 470-nm illumination. Scale bars are 10 µm.
Discussion
Here, we present an optimized toolbox for the optogenetic control of intracellular transport. By careful selection of optogenetic modules, introduction of an additional layer of optogenetic control, and adoption of plant-derived molecular motors, we have established a system that allows for the robust repositioning of organelles in populations of cells. In comparison to existing methods for induced organelle repositioning, the approach introduced here has a high dynamic range, which ensures that most cells will respond to optogenetic stimulation, even in transient transfections, and minimizes dark-state activation.
Existing methods rely on chemical heterodimerization (Guardia et al., 2019; Kapitein et al., 2010a; Kapitein et al., 2010b), optogenetic heterodimerization (Adrian et al., 2017; Duan et al., 2015; van Bergeijk et al., 2015), or a hybrid approach (Ballister et al., 2015; Gutnick et al., 2019). In general, the chemical heterodimerization systems suffer less from background activation but are more difficult to reverse. In addition, such systems lack spatial control and temporal acuity. Also, systems that rely on the disruption of streptavidin-binding peptide-streptavidin binding by the addition of biotin are already active at the onset of experiments and require the use of a culture medium that does not contain biotin (Guardia et al., 2019). Hybrid approaches employ a chemical heterodimerizer that can be uncaged or cleaved by illumination with UV light (Ballister et al., 2015; Gutnick et al., 2019). These systems have the advantage of switch-like (in)activation (the light-sensitive step), but these systems are typically poorly reversible, as reactivation of the system relies on replacement of the cleaved heterodimerizer with the uncleaved molecule.
The use of optogenetic systems for the control of intracellular transport has the clear advantages of spatial control, high temporal acuity of activation, and requires no exogenous compounds. However, many light-sensitive heterodimerization systems to control intracellular transport have suffered from a low dynamic range (Duan et al., 2015; van Bergeijk et al., 2015). The iLID-SSPB system that we adopted here (Guntas et al., 2015; Zimmerman et al., 2016) has a significantly improved dynamic range (59-fold dark versus light for iLID-SSPB(micro) over the first-generation CRY2 system [approximately sevenfold] and the TULIP system [sixfold; Duan et al., 2015; van Bergeijk et al., 2015]), yet still suffers from significant dark-state activation in our assays when used with dimeric KIF1A(1–383) (Fig. 1 C). Dark-state activation only reduces to baseline levels when a second layer of optogenetic control is introduced, as in the opto-kinesins. This two-step activation system provides a far greater dynamic range than the existing methods for blue light–sensitive organelle repositioning assays, while preserving acute spatiotemporal control and high reversibility.
In addition, the use of opto-kinesin for anterograde transport prevents motility of the motor in the dark. This prevents potential remodeling of the microtubule cytoskeleton in response to high local concentration of constitutively active processive kinesin at microtubule plus ends. It also prevents accumulation of motor near high concentrations of microtubule plus ends, which can segregate these motors from cargo and impede efficient recruitment (Fig. S1), especially in highly polarized cells. Thereby, a high concentration of motor remains available to bind cargo, even after illumination (Fig. 3 B), and this facilitates experiments that require multiple rounds of activation (Fig. 4, H and I), in particular when using the fast reversing opto-kinesin.
The use of ppKin14-VIb as an alternative retrograde motor prevents dominant-negative effects on dynein/dynactin activity that result from overexpression of BICDN. Owing to a very low degree of homology with mammalian kinesin-14 motors, ppKin14-VIb is also unlikely to perturb endogenous transport or mitotic spindle organization by heterodimerization with endogenous motor. In addition, ppKin14-VIb is considerably faster than mammalian minus end–directed kinesins previously used for organelle repositioning (Farías et al., 2019; Guardia et al., 2019; Lipka et al., 2016). Finally, like opto-kinesin, both ppKin14-VIb variants are distributed throughout the cytosol before illumination, ensuring a high concentration of available motor near cargo.
Cargo-transporting kinesins generally exist as dimers, allowing the two motor domains to undergo alternating ATPase cycles and ensuring that one head of the motor remains bound to the microtubule as the other takes a step forward (Gennerich and Vale, 2009). The current model for kinesin-3 regulation is that in the absence of cargo, endogenous KIF1A is kept in an autoinhibited, catalytically inactive monomeric state (Al-Bassam et al., 2003; Lee et al., 2004; Soppina et al., 2014; Tomishige et al., 2002). In this conformation, the neck coil, which forms the minimal dimerization unit, is sequestered by an intramolecular interaction with coiled coil 1. Upon binding of cargo, this inhibitory conformation is released and a stable dimer is formed by multiple dimerization interfaces within the neck coil, coiled coil 1, and the FHA domain, resulting in superprocessive motility (Al-Bassam et al., 2003; Hammond et al., 2009; Huo et al., 2012; Lee et al., 2004; Soppina et al., 2014; Tomishige et al., 2002). Truncated kinesin-3 variants lacking both the neck coil and the autoinhibitory domains are nonprocessive as single molecules in vitro, but they can transport cargo when clustered in teams on cargo both in vitro and in cells (Okada et al., 2003; Schimert et al., 2019; Tomishige et al., 2002). This is confirmed by our observation that monomeric KIF1A(1–365) was able to peripherally enrich early endosomes (Fig. 4, B and D). Interestingly, it was recently demonstrated that monomeric KIF1A was equally capable of transporting PEX3(1–42)-labeled peroxisomes as dimeric KIF1A, but unable to reposition loads that require high-force generation, such as the Golgi apparatus (Schimert et al., 2019). Here, we found that monomeric KIF1A can reposition early endosomes, but far less potently than the dimeric opto-kinesins.
We have shown that the response to transient mispositioning differs between different organelles of the endolysosomal system (Fig. 8). Transport dynamics differ widely among organelles and are dependent on many factors, including organelle size, endogenous transport by different molecular motors, and interaction with other structures, in particular the ER. The organelle connectome has not been explored systematically for the endolysosomal system, but it has been demonstrated that endosomes make extensive, persistent contacts with the ER, and that these contacts increase as endosomes mature (Friedman et al., 2013; Raiborg et al., 2015; Zajac et al., 2013). Indeed, lysosomes are nearly always in contact with the ER, and this has been shown to regulate lysosomal transport and ER tubulation (Guo et al., 2018; Raiborg et al., 2015; Valm et al., 2017). The large difference in extent of repositioning between early endosomes, recycling endosomes, and lysosomes that we observed (Fig. 8) likely results in part from a different degree of endosome–ER coupling.
We expect that this improved toolbox, especially in combination with endogenous tagging approaches in well-designed cellular models, will facilitate exploration of the interplay between organelle positioning and cellular functions and of transport-related diseases. In addition, it will enable systematic exploration of how particular cellular compartments respond to the redistribution of other organelles, which could shed new light on organelle contacts and organelle interdependence.
Materials and methods
Cell culture and reagents
COS-7 cells, U2OS cells, HeLa cells, and HeLa Flp-in cells were grown in DMEM supplemented with 10% FBS and 50 µg/ml penicillin/streptomycin at 37°C in 5% CO2. U2OS cells and HeLa cells were obtained from ATCC; HeLa Flp-in cells stably expressing a TetR and carrying a single genomic FRT site were a gift from Stephen Taylor (University of Manchester, Manchester, UK). All cell lines were routinely screened (every 8–12 wk) to ensure they were free from mycoplasma contamination. All isogenic HeLa Flp-in cells stably expressing doxycycline-inducible, equimolar expression of RAB11 and kinesin constructs were derived from the HeLa Flp-in cell line by transfection with the pCDNA5/FRT/TO vector (Invitrogen) and pOG44 (Invitrogen) and cultured in the same medium but containing 200 µg/ml hygromycin B. To induce protein expression in the inducible cell lines, 1 µg/ml doxycycline was added for 16–24 h. The HeLa iLID-mCherry-RAB11 cell line, in which RAB11 was endogenously tagged with iLID-mCherry, was generated by CRISPR-Cas9–mediated genome editing (Ran et al., 2013). In brief, HeLa cells (ATCC) were transfected with the donor plasmid pDONOR-iLID-mCherry-RAB11 and pSpCas9(BB)-2A-Puro (pX459) V2.0 (a gift from Feng Zhang, Broad Institute, Cambridge, MA; Addgene, #62988), bearing the appropriate targeting sequence (5′-GGGTGCCCATTGCGCGGCCG-3′; pX459v2RAB11 1.4). 24 h after transfection, Cas9-positive cells were selected by treatment with 1 µg/ml puromycin for 64–72 h. Subsequently, cells were grown to confluency and validated to have correct labeling of RAB11 by live-cell microscopy and colocalization analysis with RAB11 markers by immunofluorescence microscopy. Doxycycline-hyclate was from Abcam (ab141091), hygromycin B was from InvivoGen (ant-hg-5), and puromycin (hydrochloride) was from Cayman (13884).
Plasmids and cloning
pOG44 (Invitrogen) encodes a FLP recombinase expression vector. HA-BICD2(1–500)-FRB was a gift from Casper Hoogenraad (Utrecht University, Utrecht, Netherlands). All other motor and cargo encoding constructs were generated for this study by a combination of conventional molecular cloning, PCR-based cloning, Gibson assembly, and DNA synthesis. All constructs were validated by sequencing of the full ORF. Sequences and details of constructs are provided in Table S1. In brief, constructs used for transient overexpression were cloned into the mammalian expression vector pβactin-16-pl (chicken β-actin promoter, referred to hereafter as pB80; Kaech et al., 1996), in which the multiple cloning site was replaced by AscI-XbaI-HindIII-NheI-SnaBI-MluI-AgeI. For expression of cargo adaptors, the photosensitive heterodimerization module iLID or the FKBP heterodimerization module and the cargo adaptor modules were spaced by two synthetic 29–aa GGGS linkers and the RFP mCherry. The iLID module was derived from pLL7.0-Venus-iLID-Mito (Guntas et al., 2015), a gift from Brian Kuhlman (University of North Carolina at Chapel Hill, Chapel Hill, NC; Addgene plasmid #60413). FKBP was derived from FKBP-tagRFPt-Rab11 (van Bergeijk et al., 2015). Full-length WT human RAB11, decorating recycling endosomes, was subcloned from GFP-RAB11A WT, a gift from Richard Pagano (Mayo Clinic College of Medicine, Rochester, MN; Addgene plasmid #12674). Full-length WT human RAB5, decorating early endosomes, was derived from p-Raichu-Rab5, a gift from Takeshi Nakamura (Tokyo University of Science, Noda, Japan). Full-length WT human LAMP1, decorating lysosomes/late endosomes, was derived from LAMP1-mGFP (Falcón-Pérez et al., 2005), a gift from Esteban Dell’Angelica (University of California, Los Angeles, Los Angeles, CA; Addgene plasmid #34831).
For expression of kinesin-3, murine dimeric KIF1A (aa 1–383) encoding the kinesin motor domain, the neck linker, and the neck coil or monomeric KIF1A (aa 1–365), which lacks the neck coil or truncated, dimeric ppKin14-VIb (aa 861–1321), which includes the motor domain and the neck coil, or an artificially tetramerized version GCN4-kin14-VIb (aa 861–1321) was separated from the iLID-binding partner SSPB by again two synthetic 29–aa GGGS linkers, the nuclear export signal DLSQLTLQ, and the fluorescent protein GFP, mVenus, or mCherry. The high-affinity SspB WT (SSPB(nano)) was derived from pLL7.0:hITSN1(1159–1509)-tgRFPt-SSPB WT, Addgene plasmid #60419 (Guntas et al., 2015); the lower affinity mutant SspBR73Q (SSPB(micro)) was derived from pLL7.0: mTiam1(64–437)-tgRFPt-SSPB R73Q, Addgene plasmid #60418 (Guntas et al., 2015); and the lowest affinity mutant SspBA58V/R73Q (SSPB(milli)) was derived from pLL7.0: tgRFPt-NES-SSPB R73Q A58V (Zimmerman et al., 2016). All were gifts from Brian Kuhlman. KIF1A modules were subcloned from Kif1a (1–383)-GFP-ePDZb1 (van Bergeijk et al., 2015). Dimeric kin14-VIb (aa 861–1321) and tetramerized GCN4-kin14-VIb (aa 861–1321) were derived from the plasmid kin14-VIb–GCN4, a gift from Gohta Goshima (Nagoya University, Nagoya, Japan). To redimerize monomeric KIF1A(1–365), the GCN4 leucine zipper (LEDKIEELLSKIYHLENEIARLKKLIGEI), the blue light–sensitive homodimerization domain VVDI52C, or the rapidly reversing variant VVDI52C/I74V/I85V (VVDfast) was flanked by 10-aa linkers and inserted between the KIF1A(1–365) and GFP modules, thereby generating the constitutive dimer KIF1A(1–365)-GCN4-GFP-SSPB(micro) and the opto-kinesins KIF1A(1–365)-VVD52C-GFP-SSPB and KIF1A(1–365)-VVDfast-GFP-SSPB. The VVDI52C module was derived from pSV40-GAVP52C, a gift from Moritoshi Sato (The University of Tokyo, Komabo, Japan).
To generate stable isogenic HeLa Flp-in cell lines, iLID-mCherry-RAB11 and KIF1A(1–365)-mVenus-SSPB(micro) or SSPB(micro)-mVenus-GCN4-ppKin14-VIb cassettes were subcloned into pCDNA5/FRT/TO (Invitrogen) and split by a 2A self-cleaving peptide from porcine teschovirus-1 (P2A).
To produce a cell line in which RAB11 was endogenously tagged with iLID-mCherry, a donor plasmid was generated to encode an iLID-mCherry cassette, flanked by 1,000-bp homology arms that are homologous to the genomic regions immediately surrounding the RAB11 start codon. This construct, pDONOR-iLID-mCherry-RAB11, was generated by PCR and Gibson assembly strategies. pX459v2RAB11 1.4 was cloned by ligating a primer dimer encoding the targeting sequence 5′-GGGTGCCCATTGCGCGGCCG-3′ into the BbsI sites of pX459v2.
Transfections and fluorescence microscopy
Plasmids were transfected using Fugene6 transfection reagent (Promega) according to the manufacturer’s instructions.
For fixed experiments, cells were seeded on 18-mm glass coverslips and transfected with 1 µg plasmid DNA (1:3 ratio cargo:motor) and Fugene6 (1:3) for 40–48 h before fixation. Cells were maintained in the dark until fixation or exposed according to illumination schemes described below, followed by fixation with 4% PFA for 10 min at 37°C during continuing illumination. When required, cells were incubated with 100 nM rapalog (AP21967/AC Heterodimerizer; Clontech; stock dissolved to 0.1 mM in ethanol) before illumination or fixation. After fixation, cells were washed in PBS, permeabilized using 0.5% Triton X-100, and blocked using 3% BSA in PBS, incubated with primary antibodies for 2–4 h at room temperature or 16 h at 4°C, washed with 0.1% Triton X-100 in PBS (PBST), and incubated with secondary antibodies for an additional hour at room temperature. Coverslips were then washed with PBST and again with PBS, rinsed with 96% ethanol, dried, and mounted using antifade (ProLong Diamond; Molecular Probes).
For live experiments, cells were seeded on 24-mm glass coverslips and transfected with 2 µg plasmid DNA (1:3 ratio cargo:motor) and Fugene6 (1:3) for 20–30 h before imaging. Coverslips were mounted in metal rings, immersed in 1 ml Ringer’s solution (10 mM Hepes, 155 mM NaCl, 5 mM KCl, 1 mM CaCl2, 1 mM MgCl2, 2 mM NaH2PO4, and 10 mM glucose, pH 7.4) or (in Figs. 4, J and K; and 5 F) in DMEM without phenol red, supplemented with 10% FBS and 50 µg/ml penicillin/streptomycin, sealed, and maintained at 37°C. Cells were imaged every 1 s for 6 min (Fig. 4, F and G), every 5 s for 10–45 min (Fig. 2, C–F; Fig. 4, A–E, H, and I; Fig. 5, G–K; Fig. 8, B–J; Fig. S2; and Fig. S3), or every 30 s for 27 min (Fig. 6 I).
Epifluorescence images were acquired using a 40× (Plan Fluor, NA 1.3; Nikon; live-cell imaging) or 60× (Plan Apo, NA 1.4; Nikon; fixed-cell imaging) oil-immersion objective on a Nikon Ti inverted microscope equipped with a sample incubator (Tokai-Hit), mercury lamp (Osram), ET-DAPI (49000), ET-GFP (49002), ET-mCherry (49008), and ET 514-nm Laser Bandpass (49905) filter cubes (all Chroma) and a Coolsnap HQ2 charge-coupled device camera (Photometrics), controlled with µManager 1.4 software (Edelstein et al., 2010).
Illumination schemes
For fixed experiments, transfected cells were incubated in the dark or illuminated inside the incubator with blue light (470 nm, ∼20–100 µW cm−2) using a custom array of RGB-LEDs for 10 min. HeLa cells in which RAB11 was endogenously tagged were instead illuminated for 30 min to compensate for the lower expression levels of iLID-mCherry-RAB11 in these cells.
To illuminate the cells during live-cell imaging, we used a Polygon 2000 digital mirror device equipped with 470-nm LEDs (Mightex) that exposed the full field of view between imaging frames with 470-nm light with an intensity of 2 mW cm−2 or (in Fig. 4, J and K; and Fig. 5 F) 20 mW cm−2. Light exposure was synchronized with camera frames using camera-evoked TTL triggers.
Antibodies
The following primary antibodies were used for immunofluorescence imaging and immunoblotting: GFP (3E6; Molecular Probes/Life Tech), GFP (11814460001, clones 7.1 and 13.1; Roche) RFP (600-401-379; Rockland), and HA (3F10; Sigma-Aldrich). Secondary antibodies were high-crossed goat–anti-mouse Alexa Fluor 488 and goat–anti-rabbit, goat–anti-rat Alexa Fluor 568 (Molecular Probes), and goat–anti-rabbit IRdye680TL and goat–anti-mouse IRdyeCW (LI-COR/Westburg).
Image quantification
Analyses of acquired images were performed with FIJI software, and the resulting graphs were plotted with Graphpad Prism 5 and Microsoft Excel.
Analysis of organelle distribution in fixed cells
For the analysis of organelle distribution in fixed COS-7 cells, transfected cells were randomly selected for imaging. To ensure comparable cellular area, exogenous cargo, and motor expression within and between experiments, some cells were excluded from analysis based on these parameters. Before analysis, two regions of interest (ROIs) were drawn: the first outside the cell to measure extracellular background and the second around the cell of interest to exclude contributions from neighboring cells to the analysis. The image was subsequently processed by applying Gaussian blur (5-pixel radius) and used to select an ROI that defined the cellular outline by including all pixels that had an organelle staining intensity that was higher than the mean intensity + 2–20× the SD of the background ROI (depending on the intensities of signal and noise). Subsequently, the center of the perinuclear vesicle “cloud” (Jongsma et al., 2016) was defined by the center of mass of the pixels within the cellular outline that fell within the brightest ∼5% of the organelle staining intensity histogram, and the resulting coordinates were used to position a 10-pixel-wide circular ROI. This ROI was then enlarged by 10 pixels for >50 iterations to generate an array of concentric circular ROIs with an increasing diameter, which were all restricted to the area within the cellular outline and from which the area and the mean and minimal intensities were measured. Data were transferred to Microsoft Excel, where background was subtracted (extracellular background for motor proteins and intracellular background as defined by minimal intracellular intensity for organelles) and integrated intensity was calculated per concentric circle. For organelle distribution shown in Figs. 1 C, 3 C, and 6 D and Fig. S1 C, the fraction of staining intensity in the most peripheral 25% of the cell, normalized for the average peripheral fraction of staining intensity in control cells, was plotted. Cells in which normalized peripheral staining intensity was greater than the mean plus two times the SD of control cells were considered to be responding to the assay. Similarly, Fig. 6 H plots the normalized microtubule organizing center (MTOC) intensity of RAB11, which was calculated as the mean background-subtracted intensity within a circular ROI with a diameter of 30 pixels, centered on the perinuclear vesicle cloud (effectively the MTOC), followed by division by the mean cellular intensity of RAB11 and normalized for the average MTOC staining intensity of control cells.
For the analysis of endogenously tagged recycling endosome distribution in fixed HeLa cells, transfected cells were randomly selected for imaging. To ensure comparable motor expression within and between experiments, some cells were excluded from analysis. Before analysis, three ROIs were drawn: the first outside the cell to measure extracellular background, the second around the cell of interest to exclude contributions from neighboring cells to the analysis, and the third around the MTOC. The image was subsequently processed by applying Gaussian blur (5-pixel radius) and used to select an ROI that defined the cellular outline by including all pixels that had an organelle staining intensity higher than the mean intensity + 0.2–2× the SD of the background ROI (depending on the intensities of signal and noise). Area and the mean intensities were measured. Data were transferred to Microsoft Excel, where extracellular background was subtracted (extracellular background) and mean mCherry intensity was calculated for the total cellular area and the MTOC ROI. For organelle distribution shown in Fig. 7 B, the mean MTOC RAB11 intensity relative to the total mean RAB11 intensity, normalized to nonilluminated cells, was plotted.
Analysis of organelle distribution in live cells
For the analysis of organelle distribution in live cells, isolated transfected cells were selected for imaging based on the expression level of iLID-mCherry–labeled cargo adaptor modules. For endosome distribution, movies were corrected for bleaching using the CorrectBleach FIJI plugin (release 2.02) with histogram matching, and background was subtracted (rolling ball radius of 50 pixels). Three ROIs were drawn: outside the cell to measure extracellular background, manually tracing the cellular outline, and around the perinuclear region to include the nucleus as well as the center of the perinuclear vesicle cloud. The ROI defining the cellular outline was then shrunk by 9.13 µm and merged with the perinuclear ROI to create a “nonperipheral” ROI. From these ROIs, the mean intensity and area were measured for all time points. Data were transferred to Microsoft Excel, where background was subtracted. To calculate the peripheral enrichment index shown in Figs. 4, B and I; 5 J; and 8, C, F, and I, the peripheral fraction of mCherry intensity (defined as [total signal − signal in the nonperipheral ROI]/total signal) was calculated for every time point and subtracted by the nonperipheral fraction (defined as signal in the nonperipheral ROI/total signal). For perinuclear enrichment shown in Figs. 4 C, 5 G, and 8 D, G, and J, the fraction of mCherry intensity in the perinuclear ROI was calculated similarly.
Analysis of motor distribution in live cells
For the analysis of kinesin distribution in live cells, isolated transfected cells were selected for imaging based on the expression level of mCherry-labeled motor. ROIs were drawn outside the cell to measure extracellular background and for manually tracing the cellular outline. The ROI defining the cellular outline was then shrunk by 9.13 µm and merged with the perinuclear ROI to create a nonperipheral ROI. From these ROIs, the mean intensity and area were measured for all time points. Data were transferred to Microsoft Excel, where background was subtracted. To calculate the peripheral KIF1A intensity shown in Fig. 2, D–F, the peripheral fraction of mCherry intensity (defined as [total signal − signal in the nonperipheral ROI]/total signal) was calculated and normalized to t(0), and to directly compare reversion kinetic, peripheral intensity at t(200) after illumination was set to 1 for Fig. 2, D and E.
Analysis of motor dissociation from endosomes after optogenetic stimulation
To visualize the dissociation of SSPB-kinesins from iLID-decorated organelles, U2OS cells were transfected with iLID-mCherry-RAB5 and KIF1A(1–365)-mVenus-SSPB(micro), KIF1A(1–365)-VVD52C-mVenus-SSPB(micro), KIF1A(1–365)-VVDfast-mVenus-SSPB(micro), SSPB(micro)-mVenus–ppKin14-VIb, or SSPB(micro)-GCN4-mVenus–ppKin14-VIb. Cells were maintained in DMEM without phenol red supplemented with 10% FBS and 50 µg/ml penicillin/streptomycin and treated with 10 µM nocodazole (Sigma-Aldrich) for 2–4 h to induce disassembly of microtubules and prevent endosome transport during the assay. Cells were then imaged for three frames with a 30-s interval before 30-s continuous exposure of the field of view to 470-nm light with an intensity of 20 mW cm−2 to recruit SSPB-labeled kinesin to iLID-decorated endosomes. Cells were then subsequently imaged for 120 frames with a 2-s interval in the absence of 470-nm light to visualize release dissociation of kinesin from endosomes. For analysis, 10 ROIs per cell were drawn to encompass the motility of individual endosomes throughout the movie and the background subtracted, and integrated density of mCherry and mVenus fluorescence was measured for all time points. To correct for endosome size and expression levels, individual traces were normalized by subtracting the average prestimulation intensity and dividing by the maximal intensity of the trace.
Immunoblotting
U2OS cells were transfected with iLID-mCherry-RAB11, KIF1A(1–365)-VVDfast-mVenus-SSPB(micro)_P2A_iLID-mCherry-RAB11 or SSPB(micro)-mVenus-GCN4–ppKin14-VIb(861–1321)_P2A_iLID-mCherry-RAB11 using polyethylenimine (Polysciences). Cells were lysed in Laemmli sample buffer and samples were separated by SDS-PAGE. Immunoblotting was performed using standard protocols; the signal was visualized and analyzed on a scanner (Odyssey; LI-COR Biosciences) using fluorescently labeled secondary antibodies.
Online supplemental material
Fig. S1 shows the intracellular distribution of kinesin-3 truncations. Fig. S2 shows dual color live-cell imaging of iLID-RAB5 and opto-kinesin. Fig. S3 shows dual color live-cell imaging of iLID-RAB5 and ppKin14-VIb. Fig. S4 shows full-length scans of immunoblots. Video 1 corresponds to Fig. 2 C. Video 2 corresponds to Fig. 4 A. Video 3 corresponds to Fig. 4 A. Video 4 corresponds to Fig. S2. Video 5 corresponds to Fig. 4 F. Video 6 corresponds to Fig. 4 H. Video 7 corresponds to Fig. S3. Video 8 corresponds to Fig. 5 G. Video 9 corresponds to Fig. 6 I. Video 10 corresponds to Fig. 6 I. Table S1 list plasmids used in this study.
Supplementary Material
lists sequences and details of constructs.
Acknowledgments
We thank Brian Kuhlman for iLID and SSPB constructs, Gohta Goshima for the ppKin14 constructs, Moritoshi Sato for the VVD construct, Casper Hoogenraad for the BICDN-FRB construct, Stephen Taylor for the HeLa Flp-in cell line, and members of the Cell Biology Department for valuable discussions.
This work is supported by the Netherlands Organisation for Scientific Research (NWO; NWO-ALW-VENI 016.Veni.171.030 to W. Nijenhuis and NWO-ALW-VIDI 864.12.008 to L.C. Kapitein) and the European Research Council (ERC Starting Grant 336291 to L.C. Kapitein and ERC Consolidator Grant 819219 to L.C. Kapitein).
The authors declare no competing financial interests.
Author contributions: W. Nijenhuis and M.M.P. van Grinsven created reagents, performed experiments, and analyzed data. W. Nijenhuis and L.C. Kapitein designed the study, interpreted data, and wrote the manuscript.
References
- Adrian M., Nijenhuis W., Hoogstraaten R.I., Willems J., and Kapitein L.C.. 2017. A Phytochrome-Derived Photoswitch for Intracellular Transport. ACS Synth. Biol. 6:1248–1256. 10.1021/acssynbio.6b00333 [DOI] [PMC free article] [PubMed] [Google Scholar]
- Al-Bassam J., Cui Y., Klopfenstein D., Carragher B.O., Vale R.D., and Milligan R.A.. 2003. Distinct conformations of the kinesin Unc104 neck regulate a monomer to dimer motor transition. J. Cell Biol. 163:743–753. 10.1083/jcb.200308020 [DOI] [PMC free article] [PubMed] [Google Scholar]
- Ballister E.R., Ayloo S., Chenoweth D.M., Lampson M.A., and Holzbaur E.L.F.. 2015. Optogenetic control of organelle transport using a photocaged chemical inducer of dimerization. Curr. Biol. 25:R407–R408. 10.1016/j.cub.2015.03.056 [DOI] [PMC free article] [PubMed] [Google Scholar]
- Braun M., Lansky Z., Szuba A., Schwarz F.W., Mitra A., Gao M., Lüdecke A., Ten Wolde P.R., and Diez S.. 2017. Changes in microtubule overlap length regulate kinesin-14-driven microtubule sliding. Nat. Chem. Biol. 13:1245–1252. 10.1038/nchembio.2495 [DOI] [PMC free article] [PubMed] [Google Scholar]
- Bugaj L.J., Choksi A.T., Mesuda C.K., Kane R.S., and Schaffer D.V.. 2013. Optogenetic protein clustering and signaling activation in mammalian cells. Nat. Methods. 10:249–252. 10.1038/nmeth.2360 [DOI] [PubMed] [Google Scholar]
- Duan L., Che D., Zhang K., Ong Q., Guo S., and Cui B.. 2015. Optogenetic control of molecular motors and organelle distributions in cells. Chem. Biol. 22:671–682. 10.1016/j.chembiol.2015.04.014 [DOI] [PMC free article] [PubMed] [Google Scholar]
- Edelstein A., Amodaj N., Hoover K., Vale R., and Stuurman N.. 2010. Computer control of microscopes using µManager. Curr. Protoc. Mol. Biol. Chapter 14:20. [DOI] [PMC free article] [PubMed] [Google Scholar]
- Endow S.A., and Waligora K.W.. 1998. Determinants of kinesin motor polarity. Science. 281:1200–1202. 10.1126/science.281.5380.1200 [DOI] [PubMed] [Google Scholar]
- Falcón-Pérez J.M., Nazarian R., Sabatti C., and Dell’Angelica E.C.. 2005. Distribution and dynamics of Lamp1-containing endocytic organelles in fibroblasts deficient in BLOC-3. J. Cell Sci. 118:5243–5255. 10.1242/jcs.02633 [DOI] [PubMed] [Google Scholar]
- Farías G.G., Fréal A., Tortosa E., Stucchi R., Pan X., Portegies S., Will L., Altelaar M., and Hoogenraad C.C.. 2019. Feedback-Driven Mechanisms between Microtubules and the Endoplasmic Reticulum Instruct Neuronal Polarity. Neuron. 102:184–201.e8. 10.1016/j.neuron.2019.01.030 [DOI] [PubMed] [Google Scholar]
- French A.R., Sosnick T.R., and Rock R.S.. 2017. Investigations of human myosin VI targeting using optogenetically controlled cargo loading. Proc. Natl. Acad. Sci. USA. 114:E1607–E1616. 10.1073/pnas.1614716114 [DOI] [PMC free article] [PubMed] [Google Scholar]
- Friedman J.R., Dibenedetto J.R., West M., Rowland A.A., and Voeltz G.K.. 2013. Endoplasmic reticulum-endosome contact increases as endosomes traffic and mature. Mol. Biol. Cell. 24:1030–1040. 10.1091/mbc.e12-10-0733 [DOI] [PMC free article] [PubMed] [Google Scholar]
- Furuta K., and Toyoshima Y.Y.. 2008. Minus-end-directed motor Ncd exhibits processive movement that is enhanced by microtubule bundling in vitro. Curr. Biol. 18:152–157. 10.1016/j.cub.2007.12.056 [DOI] [PubMed] [Google Scholar]
- Gennerich A., and Vale R.D.. 2009. Walking the walk: how kinesin and dynein coordinate their steps. Curr. Opin. Cell Biol. 21:59–67. 10.1016/j.ceb.2008.12.002 [DOI] [PMC free article] [PubMed] [Google Scholar]
- Guardia C.M., De Pace R., Sen A., Saric A., Jarnik M., Kolin D.A., Kunwar A., and Bonifacino J.S.. 2019. Reversible association with motor proteins (RAMP): A streptavidin-based method to manipulate organelle positioning. PLoS Biol. 17:e3000279 10.1371/journal.pbio.3000279 [DOI] [PMC free article] [PubMed] [Google Scholar]
- Guntas G., Hallett R.A., Zimmerman S.P., Williams T., Yumerefendi H., Bear J.E., and Kuhlman B.. 2015. Engineering an improved light-induced dimer (iLID) for controlling the localization and activity of signaling proteins. Proc. Natl. Acad. Sci. USA. 112:112–117. 10.1073/pnas.1417910112 [DOI] [PMC free article] [PubMed] [Google Scholar]
- Guo Y., Li D., Zhang S., Yang Y., Liu J.J., Wang X., Liu C., Milkie D.E., Moore R.P., Tulu U.S., et al. . 2018. Visualizing Intracellular Organelle and Cytoskeletal Interactions at Nanoscale Resolution on Millisecond Timescales. Cell. 175:1430–1442.e17. 10.1016/j.cell.2018.09.057 [DOI] [PubMed] [Google Scholar]
- Gutnick A., Banghart M.R., West E.R., and Schwarz T.L.. 2019. The light-sensitive dimerizer zapalog reveals distinct modes of immobilization for axonal mitochondria. Nat. Cell Biol. 21:768–777. 10.1038/s41556-019-0317-2 [DOI] [PMC free article] [PubMed] [Google Scholar]
- Hammond J.W., Cai D., Blasius T.L., Li Z., Jiang Y., Jih G.T., Meyhofer E., and Verhey K.J.. 2009. Mammalian Kinesin-3 motors are dimeric in vivo and move by processive motility upon release of autoinhibition. PLoS Biol. 7:e72 10.1371/journal.pbio.1000072 [DOI] [PMC free article] [PubMed] [Google Scholar]
- Harterink M., van Bergeijk P., Allier C., de Haan B., van den Heuvel S., Hoogenraad C.C., and Kapitein L.C.. 2016. Light-controlled intracellular transport in Caenorhabditis elegans. Curr. Biol. 26:R153–R154. 10.1016/j.cub.2015.12.016 [DOI] [PubMed] [Google Scholar]
- Hepperla A.J., Willey P.T., Coombes C.E., Schuster B.M., Gerami-Nejad M., McClellan M., Mukherjee S., Fox J., Winey M., Odde D.J., et al. . 2014. Minus-end-directed Kinesin-14 motors align antiparallel microtubules to control metaphase spindle length. Dev. Cell. 31:61–72. 10.1016/j.devcel.2014.07.023 [DOI] [PMC free article] [PubMed] [Google Scholar]
- Hoogenraad C.C., Akhmanova A., Howell S.A., Dortland B.R., De Zeeuw C.I., Willemsen R., Visser P., Grosveld F., and Galjart N.. 2001. Mammalian Golgi-associated Bicaudal-D2 functions in the dynein-dynactin pathway by interacting with these complexes. EMBO J. 20:4041–4054. 10.1093/emboj/20.15.4041 [DOI] [PMC free article] [PubMed] [Google Scholar]
- Hoogenraad C.C., Wulf P., Schiefermeier N., Stepanova T., Galjart N., Small J.V., Grosveld F., de Zeeuw C.I., and Akhmanova A.. 2003. Bicaudal D induces selective dynein-mediated microtubule minus end-directed transport. EMBO J. 22:6004–6015. 10.1093/emboj/cdg592 [DOI] [PMC free article] [PubMed] [Google Scholar]
- Huo L., Yue Y., Ren J., Yu J., Liu J., Yu Y., Ye F., Xu T., Zhang M., and Feng W.. 2012. The CC1-FHA tandem as a central hub for controlling the dimerization and activation of kinesin-3 KIF1A. Structure. 20:1550–1561. 10.1016/j.str.2012.07.002 [DOI] [PubMed] [Google Scholar]
- Janssen A.F.J., Tas R.P., van Bergeijk P., Oost R., Hoogenraad C.C., and Kapitein L.C.. 2017. Myosin-V Induces Cargo Immobilization and Clustering at the Axon Initial Segment. Front. Cell. Neurosci. 11:260 10.3389/fncel.2017.00260 [DOI] [PMC free article] [PubMed] [Google Scholar]
- Jongsma M.L., Berlin I., Wijdeven R.H., Janssen L., Janssen G.M., Garstka M.A., Janssen H., Mensink M., van Veelen P.A., Spaapen R.M., and Neefjes J.. 2016. An ER-Associated Pathway Defines Endosomal Architecture for Controlled Cargo Transport. Cell. 166:152–166. 10.1016/j.cell.2016.05.078 [DOI] [PMC free article] [PubMed] [Google Scholar]
- Jonsson E., Yamada M., Vale R.D., and Goshima G.. 2015. Clustering of a kinesin-14 motor enables processive retrograde microtubule-based transport in plants. Nat. Plants. 1:15087 10.1038/nplants.2015.87 [DOI] [PMC free article] [PubMed] [Google Scholar]
- Kaberniuk A.A., Shemetov A.A., and Verkhusha V.V.. 2016. A bacterial phytochrome-based optogenetic system controllable with near-infrared light. Nat. Methods. 13:591–597. 10.1038/nmeth.3864 [DOI] [PMC free article] [PubMed] [Google Scholar]
- Kaech S., Ludin B., and Matus A.. 1996. Cytoskeletal plasticity in cells expressing neuronal microtubule-associated proteins. Neuron. 17:1189–1199. 10.1016/S0896-6273(00)80249-4 [DOI] [PubMed] [Google Scholar]
- Kapitein L.C., Schlager M.A., Kuijpers M., Wulf P.S., van Spronsen M., MacKintosh F.C., and Hoogenraad C.C.. 2010a Mixed microtubules steer dynein-driven cargo transport into dendrites. Curr. Biol. 20:290–299. 10.1016/j.cub.2009.12.052 [DOI] [PubMed] [Google Scholar]
- Kapitein L.C., Schlager M.A., van der Zwan W.A., Wulf P.S., Keijzer N., and Hoogenraad C.C.. 2010b Probing intracellular motor protein activity using an inducible cargo trafficking assay. Biophys. J. 99:2143–2152. 10.1016/j.bpj.2010.07.055 [DOI] [PMC free article] [PubMed] [Google Scholar]
- Kawano F., Suzuki H., Furuya A., and Sato M.. 2015. Engineered pairs of distinct photoswitches for optogenetic control of cellular proteins. Nat. Commun. 6:6256 10.1038/ncomms7256 [DOI] [PubMed] [Google Scholar]
- Kennedy M.J., Hughes R.M., Peteya L.A., Schwartz J.W., Ehlers M.D., and Tucker C.L.. 2010. Rapid blue-light-mediated induction of protein interactions in living cells. Nat. Methods. 7:973–975. 10.1038/nmeth.1524 [DOI] [PMC free article] [PubMed] [Google Scholar]
- Lawrence C.J., Morris N.R., Meagher R.B., and Dawe R.K.. 2001. Dyneins have run their course in plant lineage. Traffic. 2:362–363. 10.1034/j.1600-0854.2001.25020508.x [DOI] [PubMed] [Google Scholar]
- Lee J.R., Shin H., Choi J., Ko J., Kim S., Lee H.W., Kim K., Rho S.H., Lee J.H., Song H.E., et al. . 2004. An intramolecular interaction between the FHA domain and a coiled coil negatively regulates the kinesin motor KIF1A. EMBO J. 23:1506–1515. 10.1038/sj.emboj.7600164 [DOI] [PMC free article] [PubMed] [Google Scholar]
- Lee S., Park H., Kyung T., Kim N.Y., Kim S., Kim J., and Heo W.D.. 2014. Reversible protein inactivation by optogenetic trapping in cells. Nat. Methods. 11:633–636. 10.1038/nmeth.2940 [DOI] [PubMed] [Google Scholar]
- Levskaya A., Weiner O.D., Lim W.A., and Voigt C.A.. 2009. Spatiotemporal control of cell signalling using a light-switchable protein interaction. Nature. 461:997–1001. 10.1038/nature08446 [DOI] [PMC free article] [PubMed] [Google Scholar]
- Lipka J., Kapitein L.C., Jaworski J., and Hoogenraad C.C.. 2016. Microtubule-binding protein doublecortin-like kinase 1 (DCLK1) guides kinesin-3-mediated cargo transport to dendrites. EMBO J. 35:302–318. 10.15252/embj.201592929 [DOI] [PMC free article] [PubMed] [Google Scholar]
- Mieck C., Molodtsov M.I., Drzewicka K., van der Vaart B., Litos G., Schmauss G., Vaziri A., and Westermann S.. 2015. Non-catalytic motor domains enable processive movement and functional diversification of the kinesin-14 Kar3. eLife. 4:e04489 10.7554/eLife.04489 [DOI] [PMC free article] [PubMed] [Google Scholar]
- Nihongaki Y., Suzuki H., Kawano F., and Sato M.. 2014. Genetically engineered photoinducible homodimerization system with improved dimer-forming efficiency. ACS Chem. Biol. 9:617–621. 10.1021/cb400836k [DOI] [PubMed] [Google Scholar]
- Norris S.R., Jung S., Singh P., Strothman C.E., Erwin A.L., Ohi M.D., Zanic M., and Ohi R.. 2018. Microtubule minus-end aster organization is driven by processive HSET-tubulin clusters. Nat. Commun. 9:2659 10.1038/s41467-018-04991-2 [DOI] [PMC free article] [PubMed] [Google Scholar]
- Okada Y., Higuchi H., and Hirokawa N.. 2003. Processivity of the single-headed kinesin KIF1A through biased binding to tubulin. Nature. 424:574–577. 10.1038/nature01804 [DOI] [PubMed] [Google Scholar]
- Raiborg C., Wenzel E.M., Pedersen N.M., Olsvik H., Schink K.O., Schultz S.W., Vietri M., Nisi V., Bucci C., Brech A., et al. . 2015. Repeated ER-endosome contacts promote endosome translocation and neurite outgrowth. Nature. 520:234–238. 10.1038/nature14359 [DOI] [PubMed] [Google Scholar]
- Ran F.A., Hsu P.D., Wright J., Agarwala V., Scott D.A., and Zhang F.. 2013. Genome engineering using the CRISPR-Cas9 system. Nat. Protoc. 8:2281–2308. 10.1038/nprot.2013.143 [DOI] [PMC free article] [PubMed] [Google Scholar]
- Redchuk T.A., Omelina E.S., Chernov K.G., and Verkhusha V.V.. 2017. Near-infrared optogenetic pair for protein regulation and spectral multiplexing. Nat. Chem. Biol. 13:633–639. 10.1038/nchembio.2343 [DOI] [PMC free article] [PubMed] [Google Scholar]
- Schimert K.I., Budaitis B.G., Reinemann D.N., Lang M.J., and Verhey K.J.. 2019. Intracellular cargo transport by single-headed kinesin motors. Proc. Natl. Acad. Sci. USA. 116:6152–6161. 10.1073/pnas.1817924116 [DOI] [PMC free article] [PubMed] [Google Scholar]
- Soppina V., Norris S.R., Dizaji A.S., Kortus M., Veatch S., Peckham M., and Verhey K.J.. 2014. Dimerization of mammalian kinesin-3 motors results in superprocessive motion. Proc. Natl. Acad. Sci. USA. 111:5562–5567. 10.1073/pnas.1400759111 [DOI] [PMC free article] [PubMed] [Google Scholar]
- Strickland D., Lin Y., Wagner E., Hope C.M., Zayner J., Antoniou C., Sosnick T.R., Weiss E.L., and Glotzer M.. 2012. TULIPs: tunable, light-controlled interacting protein tags for cell biology. Nat. Methods. 9:379–384. 10.1038/nmeth.1904 [DOI] [PMC free article] [PubMed] [Google Scholar]
- Tomishige M., Klopfenstein D.R., and Vale R.D.. 2002. Conversion of Unc104/KIF1A kinesin into a processive motor after dimerization. Science. 297:2263–2267. 10.1126/science.1073386 [DOI] [PubMed] [Google Scholar]
- Urnavicius L., Lau C.K., Elshenawy M.M., Morales-Rios E., Motz C., Yildiz A., and Carter A.P.. 2018. Cryo-EM shows how dynactin recruits two dyneins for faster movement. Nature. 554:202–206. 10.1038/nature25462 [DOI] [PMC free article] [PubMed] [Google Scholar]
- Vale R.D. 2003. The molecular motor toolbox for intracellular transport. Cell. 112:467–480. 10.1016/S0092-8674(03)00111-9 [DOI] [PubMed] [Google Scholar]
- Valm A.M., Cohen S., Legant W.R., Melunis J., Hershberg U., Wait E., Cohen A.R., Davidson M.W., Betzig E., and Lippincott-Schwartz J.. 2017. Applying systems-level spectral imaging and analysis to reveal the organelle interactome. Nature. 546:162–167. 10.1038/nature22369 [DOI] [PMC free article] [PubMed] [Google Scholar]
- van Bergeijk P., Adrian M., Hoogenraad C.C., and Kapitein L.C.. 2015. Optogenetic control of organelle transport and positioning. Nature. 518:111–114. 10.1038/nature14128 [DOI] [PMC free article] [PubMed] [Google Scholar]
- Yamada M., Tanaka-Takiguchi Y., Hayashi M., Nishina M., and Goshima G.. 2017. Multiple kinesin-14 family members drive microtubule minus end-directed transport in plant cells. J. Cell Biol. 216:1705–1714. 10.1083/jcb.201610065 [DOI] [PMC free article] [PubMed] [Google Scholar]
- Zajac A.L., Goldman Y.E., Holzbaur E.L., and Ostap E.M.. 2013. Local cytoskeletal and organelle interactions impact molecular-motor- driven early endosomal trafficking. Curr. Biol. 23:1173–1180. 10.1016/j.cub.2013.05.015 [DOI] [PMC free article] [PubMed] [Google Scholar]
- Zimmerman S.P., Hallett R.A., Bourke A.M., Bear J.E., Kennedy M.J., and Kuhlman B.. 2016. Tuning the Binding Affinities and Reversion Kinetics of a Light Inducible Dimer Allows Control of Transmembrane Protein Localization. Biochemistry. 55:5264–5271. 10.1021/acs.biochem.6b00529 [DOI] [PMC free article] [PubMed] [Google Scholar]
- Zoltowski B.D., and Crane B.R.. 2008. Light activation of the LOV protein vivid generates a rapidly exchanging dimer. Biochemistry. 47:7012–7019. 10.1021/bi8007017 [DOI] [PMC free article] [PubMed] [Google Scholar]
- Zoltowski B.D., Vaccaro B., and Crane B.R.. 2009. Mechanism-based tuning of a LOV domain photoreceptor. Nat. Chem. Biol. 5:827–834. 10.1038/nchembio.210 [DOI] [PMC free article] [PubMed] [Google Scholar]
Associated Data
This section collects any data citations, data availability statements, or supplementary materials included in this article.
Supplementary Materials
lists sequences and details of constructs.


