

Abstract
Objective
The aim of this study was to investigate the clinical and computed tomography (CT) features associated with severe and critical coronavirus disease 2019 (COVID-19) pneumonia.
Materials and Methods
Eighty-three patients with COVID-19 pneumonia including 25 severe/critical cases and 58 ordinary cases were enrolled. The chest CT images and clinical data of them were reviewed and compared. The risk factors associated with disease severity were analyzed.
Results
Compared with the ordinary patients, the severe/critical patients had older ages, higher incidence of comorbidities, cough, expectoration, chest pain, and dyspnea. The incidences of consolidation, linear opacities, crazy-paving pattern, and bronchial wall thickening in severe/critical patients were significantly higher than those of the ordinary patients. Besides, severe/critical patients showed higher incidences of lymph node enlargement, pericardial effusion, and pleural effusion than the ordinary patients. The CT scores of severe/critical patients were significantly higher than those of the ordinary patients (P < 0.001). Receiver operating characteristic curve showed that the sensitivity and specificity of CT score were 80.0% and 82.8%, respectively, for the discrimination of the 2 types. The clinical factors of age older than 50 years, comorbidities, dyspnea, chest pain, cough, expectoration, decreased lymphocytes, and increased inflammation indicators were risk factors for severe/critical COVID-19 pneumonia. Computed tomography findings of consolidation, linear opacities, crazy-paving pattern, bronchial wall thickening, high CT scores, and extrapulmonary lesions were features of severe/critical COVID-19 pneumonia.
Conclusions
There are significant differences in clinical symptoms, laboratory examinations, and CT manifestations between the ordinary patients and the severe/critical patients. Many factors are related to the severity of the disease, which can help clinicians to judge the severity of the patient and evaluate the prognosis.
Key Words: COVID-19, SARS-CoV-2, acute respiratory disease, pneumonia, severity, risk factor
Since the middle of December 2019, many cases of pneumonia with unknown cause have been found in some hospitals in Wuhan City, Hubei Province, China.1 At present, it has been confirmed as a new type of acute respiratory infectious disease caused by coronavirus infection.2 On February 12, 2020, the International Committee on Taxonomy of Viruses announced that the official classification of the new coronavirus is severe acute respiratory syndrome coronavirus 2 (SARS-CoV-2).3 The World Health Organization (WHO) announced the same day that the official name of the disease caused by the virus is coronavirus disease 2019 (COVID-19).4 At 12:00 am on February 22, 2020, 77,041 confirmed cases (including 10,968 severe cases), 4148 suspected cases, and 2445 dead cases have been officially reported in China.5 Many cases spread all over the world, including the United States, Japan, Singapore, Thailand, South Korea, and so on, which suggested that the COVID-19 poses significant threats to international health.
Although most patients have mild symptoms and good prognosis, COVID-19 can develop to severe illnesses including pneumonia, pulmonary edema, acute respiratory distress syndrome, multiple organ failure, or even death.6,7 The successful treatment of severe and critical cases is the key to reduce the complication and mortality. Basic disease treatment, secondary infection prevention, and timely organ function support are needed for them. Therefore, it is very important to find the related factors of disease severity in clinical practice. However, as far as we know, there is no study on the characteristics and risk factors associated with severe and critical COVID-19 pneumonia. Therefore, in this study, we compared the clinical and computed tomography (CT) features of 58 ordinary COVID-19 cases and 25 severe/critical cases to explore the related factors of severe/critical patients.
MATERIALS AND METHODS
Our institutional review board approved this retrospective study, and the requirement for informed consent was waived.
Study Population
Ninety patients were diagnosed as COVID-19 according to the Diagnosis and Treatment of Novel Coronavirus Pneumonia (Fifth Trial Version) of China8 in our hospitals from January 2020 to February 2020 in this study. The inclusion criteria were as follows: (1) having an epidemiological history; (2) having one of the following etiological evidences—(a) real-time reverse-transcriptase polymerase-chain-reaction detection of SARS-CoV-2 nucleic acid positive in throat swabs or lower respiratory tract, and (b) the virus gene sequencing of respiratory or blood samples was highly homologous with SARS-CoV-2; and (3) having underwent thin-section CT at least one time. The ordinary patients all had fever or other respiratory symptoms with CT manifestations of pneumonia. The severe/critical patients met any of the following condition: (1) respiratory rate of 30 breaths per minute or greater; (2) finger of oxygen saturation of 93% or less in a resting state; (3) arterial oxygen tension (Pao2)/inspiratory oxygen fraction (Fio2) of 300 mm Hg or less (1 mm Hg = 0.133 kPa); (4) respiratory failure occurred and mechanical ventilation required; (5) shock occurred; and (6) patients with other organ failure needed intensive care unit monitoring and treatment.8 The exclusion criteria were COVID-19 patients without abnormal manifestations on CT. Finally, 7 patients were excluded because of no abnormal manifestations on CT and 83 patients were included. The clinical parameters included age, sex, time from illness onset to hospital admission, comorbidities (systemic hypertension, diabetes mellitus, heart disease, and chronic obstructive pulmonary disease), symptoms, clinical signs, and laboratory findings were collected and evaluated.
CT Examinations and Imaging Evaluation
All scans were obtained using a 16-row multidetector scanner (Siemens Sensation 16, Erlangen, Germany) with the following parameters: 120 kVp, 150 mA, 1.5 mm collimation, 1.35:1 pitch, sharp kernel (B80f), reconstruction matrix of 512 × 512, slice thickness of 1.0 mm, and high spatial resolution algorithm. Two chest radiologists with 10 and 8 years of experience who were blinded to the clinical data evaluated the CT findings in consensus. For each of the 83 patients, the initial chest CT images were evaluated for the following characteristics based on the Fleischner Society Nomenclature recommendations and similar studies9,10: ground glass opacity (GGO), consolidation, nodule, reticulation, interlobular septal thickening, crazy-paving pattern, linear opacities, subpleural curvilinear line, bronchial wall thickening, lymph node enlargement, pleural effusion, and pericardial effusion. The “spider web sign” was defined as a triangular or angular GGO in the subpleural lung with the internal interlobular septa thickened like a net; the adjacent pleura was pulled and formed a spider web–like shape in the corner. To quantify the extent of lesions, a thin-section CT score was assigned on the basis of all abnormal areas involved.11 Each lobe was assigned a score that was based on the following: score 0, 0% involvement; score 1, less than 5% involvement; score 2, 5% to 25% involvement; score 3, 26% to 49% involvement; score 4, 50% to 75% involvement; and score 5, greater than 75% involvement. There was a score of 0 to 5 for each lobe, with a total possible score of 0 to 25. The software of the Pulmonary Infection Assistant Diagnosis (V1.7.0.1, Dexin Medical Imaging Technology Co, Ltd, Xian City, Shaanxi Province, China) was applied to acquire the 3D visualization of CT-VRT by automatically segmenting the whole lung and pulmonary lesions, then further precise manual correction was made.
Statistical Analysis
All statistical analyses were performed by using SPSS statistical software (version 20.0, IBM) and MedCalc software (version 15.2.2, MedCalc Software). Categorical variables were described as frequency rates and percentages, and quantitative variables were described using mean (SD) or median (interquartile range) values. The χ2 test and Fisher exact test were used for categorical variables. Quantitative variables were tested for normality using Shapiro-Wilk tests. Normally distributed data were analyzed by independent sample t test; otherwise, the Mann-Whitney U test was used. Receiver operating characteristic (ROC) analysis was used to determine the clinical value of CT scores in distinguishing the ordinary and severe/critical types, and find the corresponding cutoff value. For logistic regression analysis, quantitative variables were transformed into categorical variables according to their reference ranges or the cutoff values provided by ROC analysis. Then a univariate logistic regression analysis was performed to identify the clinical and CT features associated with severe/critical COVID-19 pneumonia cases. P values less than 0.05 were considered as statistically significant.
RESULTS
Characteristics and Clinical Manifestations
The most common symptoms in 83 patients with COVID-19 pneumonia were fever, cough, expectoration, and myalgia. Less common symptoms were headache, dyspnea, abdominal pain/diarrhea, pharyngeal discomfort, and chest pain (Table 1).
TABLE 1.
Baseline Characteristics Between Severe/Critical Group and Ordinary Group
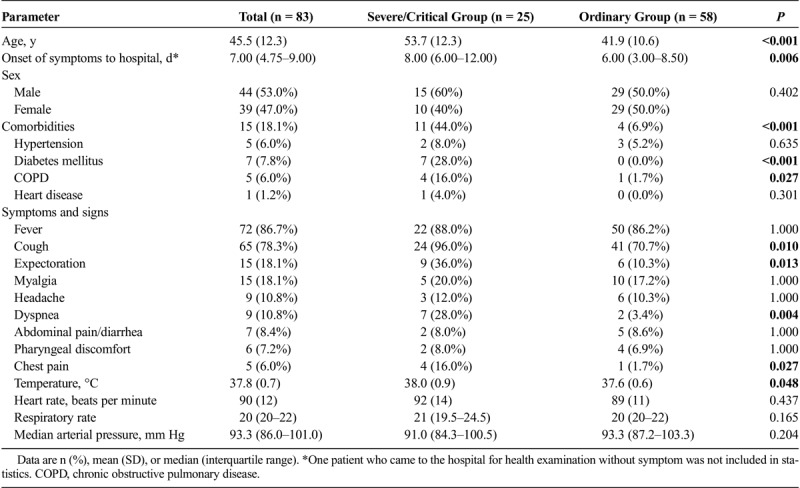
Twenty-five (30.1%) of them were severe/critical cases, and 58 (69.9%) of them were ordinary cases. Compared with the ordinary group, the severe/critical patients were significantly older (mean age, 53.7 years [SD, 12.3] vs 41.9 years [SD, 10.6]; P < 0.001) and had more comorbidities of diabetes mellitus and chronic obstructive pulmonary disease. No difference was observed in the proportion of men and women between the 2 groups. The median time from illness onset to hospital admission in severe/critical patients (8 days [6–12]) was significantly longer than those of the ordinary patients (6 days [3–8.5]) (P = 0.006). Compared with the ordinary patients, severe/critical patients had higher body temperature and higher incidences of cough, expectoration, dyspnea, and chest pain (Table 1). No significant differences of heart rate, respiratory rate, and arterial pressure were found between the 2 groups.
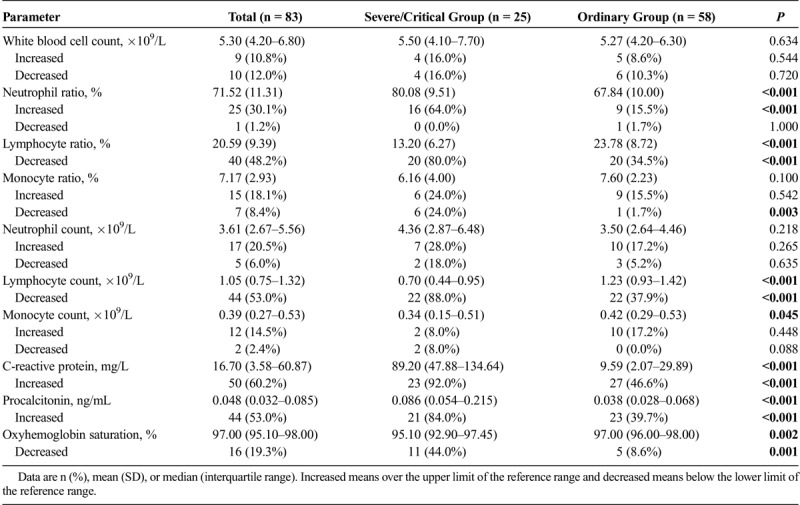
Laboratory Parameters
Compared with the ordinary patients, the severe/critical patients had increased neutrophil ratio, C-reactive protein, and procalcitonin, whereas decreased lymphocyte ratio and lymphocyte count (Table 2). White blood cell count and neutrophil count were numerically increased in severe/critical group, but the difference did not reach statistical significance. The oxyhemoglobin saturation of the severe/critical patients was significantly lower than that of the ordinary patients.
TABLE 2.
Laboratory Findings Between Severe/Critical Group and Ordinary Group
Chest CT Findings
The common chest CT features of both groups included GGO (81/83, 97.6%), linear opacities (54/83, 65.1%), consolidation (53/83, 63.9%), interlobular septal thickening (52/83, 62.7%), and crazy-paving pattern (30/83, 36.1%) (Table 3). The occurrence rates of consolidation, linear opacities, crazy-paving pattern, and bronchial wall thickening in severe/critical patients were significantly higher than those of the ordinary patients (Figs. 1, 2). Besides, severe/critical patients showed higher incidences of lymph node enlargement, pericardial effusion, and pleural effusion than ordinary patients. The CT scores of the severe/critical patients were significantly higher than those of the ordinary patients (P < 0.001). The number of lung lobes involvement for severe/critical group was significantly higher than that of the ordinary group. For ROC analysis, the area under the ROC curve (AUC) of CT score was 0.87 (95% confidence interval, 0.78–0.94; P < 0.001) for the ordinary and severe/critical patients discrimination. When the cutoff value of CT score was 7, the sensitivity and specificity were 80.0% and 82.8%, respectively.
TABLE 3.
CT Features Between Severe/Critical Group and Ordinary Group
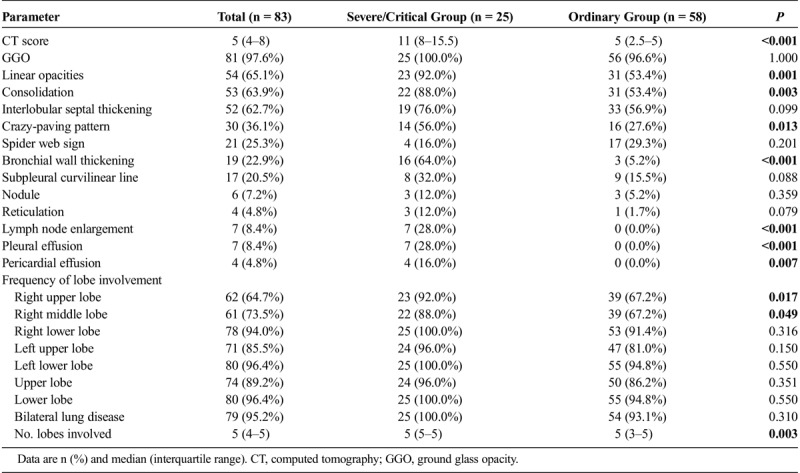
FIGURE 1.
Chest CT of a 44-year-old man with ordinary COVID-19 pneumonia (CT score = 5). A, An axial CT image showed multiple small regions of subpleural GGO with superimposed interlobular and intralobular septal thickening. B, 3D visualization of CT-VRT showed the extent of GGO with scattered pattern.
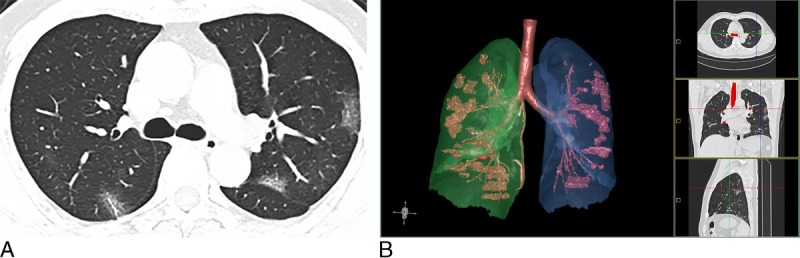
FIGURE 2.
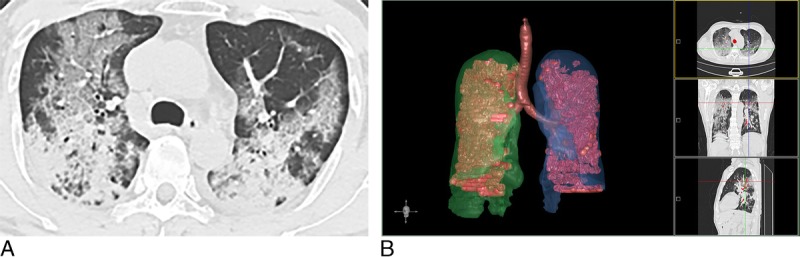
Chest CT findings of severe/critical COVID-19 pneumonia (CT score = 18), a 60-year-old man with dyspnea and pleural effusion. A, An axial CT image showed diffuse large regions of crazy-paving pattern (GGO with superimposed interlobular and intralobular septal thickening) with partial consolidation and bronchial wall thickening. B, 3D visualization of CT-VRT showed the diffuse extent of GGO and consolidation.
Factors Associated With Severe/Critical COVID-19 Pneumonia
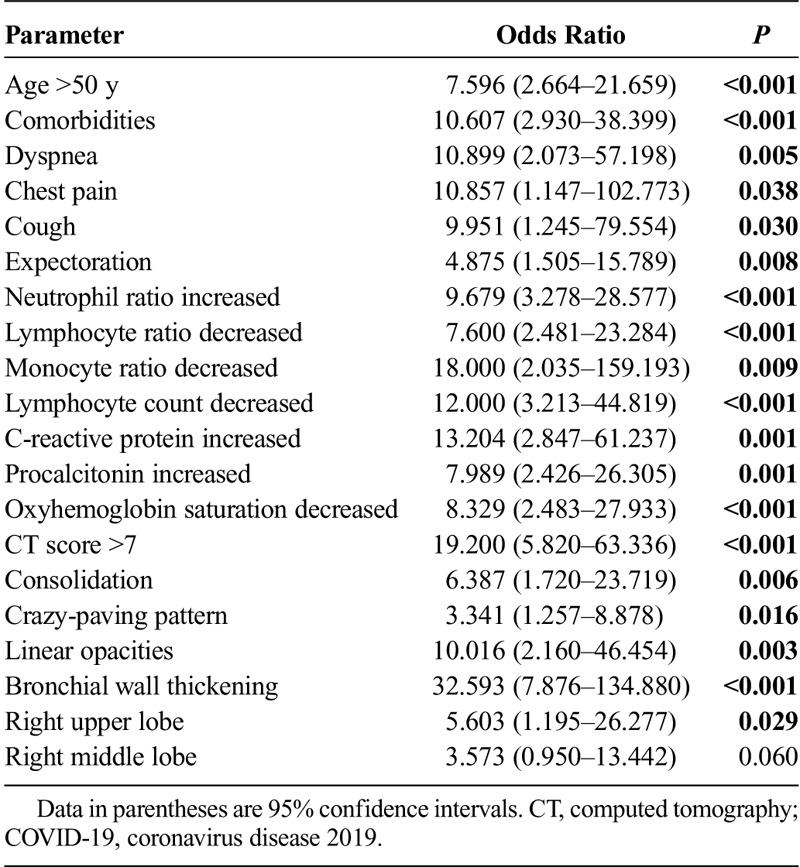
Table 4 showed the results of univariate logistic regression analyses in relationship to severe/critical COVID-19 pneumonia. The clinical factors of age older than 50 years, comorbidities, dyspnea, chest pain, cough, expectoration, decreased lymphocytes, and increased inflammation indicators were risk factors for severe/critical COVID-19 pneumonia. Computed tomography findings of consolidation, linear opacities, crazy-paving pattern, bronchial wall thickening, high CT scores (>7), and extrapulmonary lesions were imaging features of severe/critical COVID-19 pneumonia.
TABLE 4.
Univariate Logistic Analysis of Clinical and CT Features for Severe/Critical COVID-19 Pneumonia
DISCUSSION
Compared with the ordinary patients, the severe/critical patients have poor prognosis and high mortality.12,13 Studying the clinical and imaging characteristics of them is helpful to deepen our understanding of the mechanism of severe/critical conditions and promote its clinical diagnosis and treatment. The objective of this study was to identify clinical and CT features associated with severe/critical COVID-19 pneumonia by comparing severe/critical patients with ordinary patients.
In this study, we found that the severe/critical patients were older and had more underlying diseases than the ordinary cases. The people with higher age or poor state of health suffer from serious diseases, which may be the result of their weakened immune function.6 There was no difference in the ratio of men and women between the 2 groups, indicating that sex was not a risk factor for disease severity.14 Compared with the ordinary group, the severe/critical group had higher incidences of chest pain and dyspnea. Chest pain may result from the inflammatory affection of the pleura. Dyspnea is related to the severe damage to alveoli in the severe/critical group. The high body temperature may indicate that the immune system of severe/critical patients was highly activated. The occurrence of these symptoms could help clinicians identify the disease severity in clinical practice.
In our study, there were multiple laboratory indicator differences between the ordinary and severe/critical group. The decrease of lymphocytes in the severe/critical patients indicates that a large number of immune cells are consumed and the immune function is inhibited. Damage to lymphocytes may be critical in the exacerbations of patients, and the decreased lymphocytes could be used as an important index in the evaluation of disease severity.15 The increased values of neutrophil ratio, C-reactive protein, and procalcitonin in severe/critical group may be related to cytokine storm induced by virus invasion and comorbid with other kinds of infections, which was supported by the recent studies.6 Timely prevention of infection may help reduce complication and mortality.
Chest CT can accurately evaluate the type and extent of lung lesions. In this study, we found that the most common CT findings were GGO, consolidation, crazy-paving pattern, and “spider web sign” for both groups of COVID-19 pneumonia. Compared with ordinary groups, consolidation was significantly more frequent in severe/critical patients, which indicates that the alveoli are completely filled by inflammatory exudation. This usually means that the virus diffuses into the respiratory epithelium, leading to necrotizing bronchitis and diffuse alveolar damage.16,17 Severe/critical patients showed more lymph node enlargement, pericardial effusion, and pleural effusion. These extrapulmonary lesions may indicate the occurrence of severe inflammation. Although GGO is the most common CT feature of COVID-19 pneumonia, no statistical incidence difference was observed between our 2 groups. The CT scores of the severe/critical group were significantly higher than those of the ordinary group. It can accurately distinguish the severe/critical patients from the ordinary patients (AUC = 0.87), which is helpful for the judgment of clinical condition and has important clinical value. To sum up, CT can evaluate the severity of the disease, which is of great significance for the diagnosis and follow-up of COVID-19 pneumonia.
This study has several limitations. First, the data of the 2 groups were not balanced, and the sample size of the severe/critical group was relatively small. Further studies with more patients, especially severe/critical patients, are warranted. Second, because most patients remain in the hospital at the time of submission, it is difficult to assess the risk factors for poor outcomes. Finally, none of the patients had a lung biopsy or autopsy to reflect the histopathological changes.
In conclusion, in this study, we found that the clinical factors of age older than 50 years, comorbidities, dyspnea, chest pain, cough, expectoration, decreased lymphocytes, and increased inflammation indicators may be risk factors for severe/critical COVID-19 pneumonia. Computed tomography findings of consolidation, linear opacities, crazy-paving pattern, bronchial wall thickening, high CT scores, and extrapulmonary lesions may be features of severe/critical COVID-19 pneumonia. Computed tomography plays an important role in the diagnosis and disease severity evaluation of this disease.
Supplementary Material
Footnotes
Kunhua Li and Jiong Wu contributed equally to this work.
Conflicts of interest and sources of funding: none declared.
REFERENCES
- 1.Huang C, Wang Y, Li X, et al. Clinical features of patients infected with 2019 novel coronavirus in Wuhan, China. Lancet. 2020;395:497–506. [DOI] [PMC free article] [PubMed] [Google Scholar]
- 2.Zhu N, Zhang D, Wang W, et al. A novel coronavirus from patients with pneumonia in China, 2019. N Engl J Med. 2020;382:727–733. [DOI] [PMC free article] [PubMed] [Google Scholar]
- 3.Gorbalenya AE, Baker SC, Baric RS, et al. Severe acute respiratory syndrome-related coronavirus: the species and its viruses - a statement of the coronavirus study group. BioRxiv. 2020. [Google Scholar]
- 4.World Health Organization World experts and funders set priorities for COVID-19 research. Available at: https://www.who.int/news-room/detail/12-02-2020-world-experts-and-funders-set-priorities-for-covid-19-research.
- 5.National Health Commission of the People's Republic of China Novel coronavirus in China. Available at: http://www.nhc.gov.cn/xcs/yqtb/202002/07e5b22758364f2482d83537ef3975d2. Updated February 23, 2020.
- 6.Chen N, Zhou M, Dong X, et al. Epidemiological and clinical characteristics of 99 cases of 2019 novel coronavirus pneumonia in Wuhan, China: a descriptive study. Lancet. 2020;395:507–513. [DOI] [PMC free article] [PubMed] [Google Scholar]
- 7.Chung M, Bernheim A, Mei X, et al. CT imaging features of 2019 novel coronavirus (2019-nCoV). Radiology. 2020;295:202–207. [DOI] [PMC free article] [PubMed] [Google Scholar]
- 8.National Health Commission of the People's Republic of China Diagnosis and treatment protocols of pneumonia caused by a novel coronavirus (trial version 5). Available at: http://www.nhc.gov.cn/yzygj/s7653p/202002/3b09b894ac9b4204a79db5b8912d4440.shtml.
- 9.Hansell DM, Bankier AA, MacMahon H, et al. Fleischner Society: glossary of terms for thoracic imaging. Radiology. 2008;246:697–722. [DOI] [PubMed] [Google Scholar]
- 10.Schoen K, Horvat N, Guerreiro NFC, et al. Spectrum of clinical and radiographic findings in patients with diagnosis of H1N1 and correlation with clinical severity. BMC Infect Dis. 2019;19:964. [DOI] [PMC free article] [PubMed] [Google Scholar]
- 11.Chang YC, Yu CJ, Chang SC, et al. Pulmonary sequelae in convalescent patients after severe acute respiratory syndrome: evaluation with thin-section CT. Radiology. 2005;236:1067–1075. [DOI] [PubMed] [Google Scholar]
- 12.Wang C, Horby PW, Hayden FG, et al. A novel coronavirus outbreak of global health concern. Lancet. 2020;395:470–473. [DOI] [PMC free article] [PubMed] [Google Scholar]
- 13.Bernheim A, Mei X, Huang M, et al. Chest CT findings in coronavirus disease-19 (COVID-19): relationship to duration of infection. Radiology. 2020;200463. [DOI] [PMC free article] [PubMed] [Google Scholar]
- 14.Wang D, Hu B, Hu C, et al. Clinical characteristics of 138 hospitalized patients with 2019 novel coronavirus-infected pneumonia in Wuhan, China. JAMA. 2020. [DOI] [PMC free article] [PubMed] [Google Scholar]
- 15.Xu Z, Shi L, Wang Y, et al. Pathological findings of COVID-19 associated with acute respiratory distress syndrome. Lancet Respir Med. 2020. [DOI] [PMC free article] [PubMed] [Google Scholar]
- 16.Koo HJ, Lim S, Choe J, et al. Radiographic and CT features of viral pneumonia. Radiographics. 2018;38:719–739. [DOI] [PubMed] [Google Scholar]
- 17.Franquet T. Imaging of pulmonary viral pneumonia. Radiology. 2011;260:18–39. [DOI] [PubMed] [Google Scholar]
Associated Data
This section collects any data citations, data availability statements, or supplementary materials included in this article.