

Supplemental Digital Content is available in the text.
Abstract
Background.
The number of patients waiting to receive a kidney transplant outstrips the supply of donor organs. We sought to quantify trade-offs associated with different approaches to deceased donor kidney allocation in terms of quality-adjusted life years (QALYs), costs, and access to transplantation.
Methods.
An individual patient simulation model was developed to compare 5 different approaches to kidney allocation, including the 2006 UK National Kidney Allocation Scheme (NKAS) and a QALY maximization approach designed to maximize health gains from a limited supply of donor organs. We used various sources of patient-level data to develop multivariable regression models to predict survival, health state utilities, and costs. We simulated the allocation of kidneys from 2200 deceased donors to a waiting list of 5500 patients and produced estimates of total lifetime costs and QALYs for each allocation scheme.
Results.
Among patients who received a transplant, the QALY maximization approach generated 48 045 QALYs and cost £681 million, while the 2006 NKAS generated 44 040 QALYs and cost £625 million. When also taking into consideration outcomes for patients who were not prioritized to receive a transplant, the 2006 NKAS produced higher total QALYs and costs and an incremental cost-effectiveness ratio of £110 741/QALY compared with the QALY maximization approach.
Conclusions.
Compared with the 2006 NKAS, a QALY maximization approach makes more efficient use of deceased donor kidneys but reduces access to transplantation for older patients and results in greater inequity in the distribution of health gains between patients who receive a transplant and patients who remain on the waiting list.
INTRODUCTION
In 2017, there were approximately 5200 patients waiting to receive a kidney transplant in the United Kingdom.1 Because the number of patients waiting to receive a transplant far outstrips the supply of organs from deceased donors, many countries have put in place allocation systems that make the criteria for prioritizing potential recipients transparent and explicit. In the United Kingdom, a matching system between recipients and deceased donors has been in place since 1972.2 The approach to kidney allocation in the United Kingdom is subject to continuous audit and review, and over the decades, the national scheme has undergone a number of revisions to address and balance considerations of both improving transplant outcomes and promoting equity in access to transplantation.3,4
Simulation modeling is a practical tool that can be used to evaluate or prospectively test the impact of potential changes to kidney allocation schemes.5–7 As part of the Access to Transplantation and Transplant Outcomes Measure (ATTOM) study, we conducted a simulation exercise to explore and compare alternative approaches to allocating kidneys from deceased donors in the UK context. We approached the development of the simulation model with 3 key objectives in mind:
to simulate different approaches to kidney allocation that reflect varying degrees of emphasis on the competing objectives of efficiency and equity;
to report outcomes for each kidney allocation scheme in terms of both quality-adjusted life years (QALYs) and costs; and
to maximize use of information on individual patient and donor characteristics to inform the allocation process and account for between-patient variability in the estimation of outcomes.
Kidney Allocation Concepts of Interest
The last major revision to the UK kidney allocation scheme took place in 2006.4 In this simulation exercise, we compared the 2006 National Kidney Allocation Scheme (NKAS) to several alternative approaches, with a particular interest in exploring the feasibility of designing an allocation scheme that maximizes health gains, expressed in terms of QALYs, among transplant recipients from a fixed supply of donor kidneys. The design of a QALY maximization allocation scheme was predicated on the following assumptions:
For patients awaiting a transplant, there is a treatment alternative, namely dialysis.
Not all donor kidneys will result in equally good survival outcomes.
Not all potential recipients will derive the same survival benefit from a given donor kidney.
In the QALY maximization scheme, for each donor kidney that becomes available, the simulation model estimates expected QALYs following transplant for each patient on the waiting list given the characteristics of both the patient and the donor kidney to be allocated. Next, the simulation model estimates expected QALYs for each patient on the waiting list if the patient were to remain on dialysis. After calculating the difference between expected QALYs following transplant and expected QALYs on dialysis, each kidney is allocated to the patient who is expected to gain the most as a result of receiving the transplant. Over the population of transplant recipients, this approach to allocation should yield the maximum total QALY gains for a fixed number of donor kidneys. This QALY maximization scheme is conceptually similar to the Life Years from Transplant calculation previously described by Wolfe et al,8 but in the current simulation exercise, we used UK data sources and adopted a different method to extrapolate survival using flexible parametric survival analysis to calculate QALYs.
A new kidney allocation scheme based on the concept of longevity matching was introduced in the United States in 2014. Under this concept, donor kidneys are risk stratified using a scoring system to identify which kidneys are associated with better posttransplant survival. Similarly, potential recipients on the waiting list are risk stratified based on estimates of their expected posttransplant survival (EPTS) score. The allocation policy then prioritizes candidates in the top 20th percentile of EPTS scores to receive kidneys from the top 20% of donor kidneys.9 The cost implications of this new allocation policy in the United States have been estimated.10 To test the concept of longevity matching in the UK context, we used a UK-specific kidney donor risk index11 and developed a multivariable parametric model to estimate mean posttransplant survival for potential recipients based on an analysis of historical UK Transplant Registry data.12 A key difference between our approach to estimating recipient posttransplant survival and the EPTS score used in the US kidney allocation scheme is that our survival predictions also take into account 2 donor characteristics: age and history of hypertension. Thus, in our simulation exercise, recipient posttransplant survival estimates for both the QALY maximization and longevity matching allocation schemes are recalculated for each potential donor–recipient combination.
In addition to exploring the concepts of QALY maximization and longevity matching, we included 2 other allocation concepts in our simulation exercise that were intended to reflect greater emphasis on the principle of equity in access to transplant: random allocation and allocation based on waiting time. Table 1 provides an overview of all 5 allocation concepts explored in our simulation exercise.
TABLE 1.
Description of the 5 kidney allocation schemes included in the simulation exercise

MATERIALS AND METHODS
Characteristics of Waiting List Patients and Donor Kidneys
To simulate the composition of the transplant waiting list, we obtained data on 1948 prevalent listed patients who were recruited into the ATTOM study between November 2011 and September 2013.13 Of these patients, 513 had received a previous transplant. In the absence of predictive survival models that would allow us to account for prior transplants, we excluded these patients from the simulation exercise leaving a sample of 1435 patients, whose characteristics were replicated to make up a total waiting list of 5500 patients, which reflected the size of the waiting list at the time the simulation model was designed (Table 2). During the simulation exercise, each time a patient received a transplant, a replacement was added to the waiting list to keep it constant at 5500 patients. For the donor data set, we obtained characteristics of 2200 donors (4400 kidneys) from NHS Blood and Transplant based on a representative historical cohort reflecting the time period between January 2010 and December 2011 (Table 3).
TABLE 2.
Characteristics of the recipient cohort (n = 5500) used in the simulation model

TABLE 3.
Characteristics of the donor cohort (n = 2200) used in the simulation model

Characteristics of individual patients and donors were assigned at the point of entry into the model so that these characteristics could be used throughout the simulation to inform the allocation process as well as to estimate survival, costs, and health state utilities. Most patient characteristics, including comorbidities, were kept constant throughout the simulation, but 3 characteristics were updated as simulation time progressed; waiting time and time on dialysis were incremented on a daily basis, while patient age was incremented annually.
Model Structure and Assumptions
The simulation model was constructed using the software package SIMUL8 2015 Professional version (SIMUL8 Corporation, Boston, MA). At the start of the simulation, prevalent waiting list patients are loaded and held in a queue, while donor kidneys are assumed to arrive at a fixed rate equivalent to 1200 deceased donors per year (Figure 1). The allocation process is triggered by the arrival of each donor kidney. Using Visual Logic, SIMUL8’s internal programming language, we are able to loop through patients on the waiting list to evaluate blood group and tissue compatibility for each potential donor–recipient combination and perform the necessary calculations and scoring algorithms relevant to each allocation scheme of interest. In the model, we allowed for the possibility that no appropriate match is identified for a kidney from a donor with a rare blood or tissue type. This is unlikely to happen in practice but could occur in a small proportion of cases in our simulation because the composition of the waiting list was based on a limited sample of patients who were recruited into the ATTOM study. In the current UK allocation scheme, tissue matching between the donor and recipient is determined on the basis of HLA; patients are separated into 1 of 4 possible HLA mismatch levels from level 1 (000-mismatched) to level 4 (poorly matched). In current practice, patients with a level 4 HLA mismatch are not eligible to receive the donor kidney through the national allocation scheme.4 In order to maintain comparability between allocation schemes, we applied the same minimum criteria for blood group and HLA matching to all allocation schemes in the simulation exercise.
FIGURE 1.
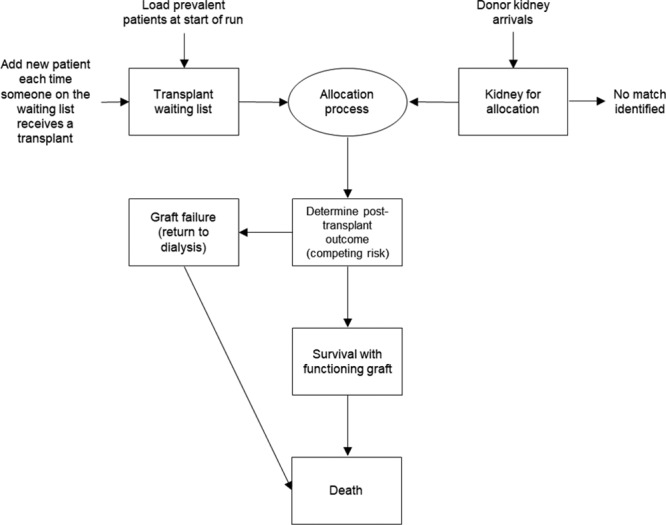
Structure of the simulation model.
Once a match has been identified, the recipient and donor kidneys are assembled into a single entity to simulate the transplantation event and moved to the next step in the simulation process to determine posttransplant survival and to estimate lifetime QALYs and costs. The model assumes that only 2 events are possible following transplantation: graft failure, in which the transplanted kidney stops working, or patient death. These events are modeled as competing risks in which we randomly sample from the survival curve for each event and move the patient to the event with the earliest sampled time.14 If a patient experiences graft failure, we have assumed that the patient returns to dialysis and faces the same mortality risk as a patient who has been on the waiting list and receiving dialysis for >3 years. However, if the sampled value for time to death following graft failure is longer than the time the patient would have survived based on the previously sampled value to determine initial posttransplant outcomes, we replaced it with the lower value. We did not attempt to model repeat transplants in the simulation.
The model was built by developing separate sections of Visual Logic code for each step in the allocation process so that, for example, the same procedure to evaluate blood group compatibility could be called at any point in the simulation for any of the 5 allocation schemes. Internal spreadsheets were used extensively to perform interim calculations at the patient level, which also facilitated model checks and step-by-step verification of the simulation process.
Estimating Life Years, QALYs, and Costs
Survival Models
There are 3 survival models underpinning time-to-event calculations to estimate posttransplant patient survival, posttransplant graft failure, and waiting list survival at various points in the simulation. Each of these models was developed based on analysis of historical UK Transplant Registry data. Data on dialysis start dates were additionally obtained through linkage to the UK Renal Registry to inform the waiting list survival model. Models were fitted using flexible parametric survival analysis to facilitate:15
extrapolation of survival curves to allow calculation of mean survival in years; and
inclusion of relevant patient and donor characteristics as covariates to capture variability in our predictions of survival and by extension in our estimates of costs and QALYs.
A more detailed description of the method used to fit the posttransplant patient survival model is described elsewhere.12 A summary of the patient and donor characteristics that were included as covariates in each of the final models is provided in Table S1 (SDC, http://links.lww.com/TP/B788). When the survival models were used as part of the allocation process to match recipients and donor kidneys (longevity matching and QALY maximization), they were applied deterministically to produce mean survival estimates. When the survival models were used to inform competing risks following transplantation to estimate lifetime QALYs and costs, we allowed for stochastic variation.
Health State Utility Estimates
Health state utility estimates for transplant recipient and patients on the waiting list were captured in the ATTOM study using the EQ-5D-5L questionnaire. We developed multivariable regression models to identify patient characteristics that led to variations in utility scores to inform quality adjustment of survival estimates in the simulation model (see Table S2 (SDC, http://links.lww.com/TP/B788) for a list of characteristics included in the final models).16
Costs
The costs of maintenance dialysis and transplant surgery were estimated in the simulation by applying fixed national tariffs.17 We estimated annual hospital costs using 2-part regression models that were developed by analyzing patient-level data from linkage of the Hospital Episode Statistics data set to UK Renal Registry data.18 Hospital costs were captured by treatment modality (dialysis versus transplantation) and by hospital setting (inpatient versus outpatient) and regression models included a number of patient characteristics as covariates (Table S3A and B, SDC, http://links.lww.com/TP/B788). For transplant recipients, the annual cost of maintenance immunosuppression assumed that patients received a combination of corticosteroids, a calcineurin inhibitor (cyclosporine or tacrolimus), and an antiproliferative agent (mycophenolate mofetil or azathioprine).19
Running the Simulation
For each allocation scheme, we performed 3 runs using a separate random number stream for each run. A single run ends when all 4400 donor kidneys have been allocated or removed from further consideration if no match has been identified. The proportion of donor kidneys for which no match was identified was approximately 1% across all simulation runs, and therefore, the number of patients who received a transplant was similar across allocation schemes.
Although we are primarily interested in comparing total costs and QALYs across all transplant recipients resulting from the different allocation schemes, it is also important to consider the outcomes of those patients who did not receive a transplant within the time frame of the simulation. For these patients, we made a simplifying assumption that they face a mortality risk equivalent to remaining on the waiting list until death and used this as the basis for projecting their lifetime costs and QALYs at the end of the simulation. QALYs and costs were both discounted at an annual rate of 3.5%.20
For each allocation scheme, we report the characteristics of patients who received a transplant, the distribution of life years and QALYs for transplant recipients by age group, and the total discounted costs and QALYs for patients who received a transplant, for patients who remained on the waiting list and for the overall cohort.
RESULTS
Access to Transplantation
To understand the impact of the different allocation schemes on access to transplantation, Table 4 reports the age, sex, and diabetes status of patients who received a transplant. Moving along the equity–efficiency spectrum from random allocation toward allocation based on QALY maximization, there is a notable decrease in the average age of transplant recipients. Under random allocation, which preserves the composition of the original waiting list at the start of the simulation, 31% of transplant recipients were aged ≥60 years; under the QALY maximization approach, this proportion fell to just 4%. Allocation schemes that emphasized greater efficiency also resulted in a higher proportion of female transplant recipients and a lower proportion of transplant recipients with diabetes.
TABLE 4.
Summary of characteristics of patients who received a transplant under each allocation scheme

Distribution of Life Years and QALYs
Table 5 shows mean survival (life y) and mean QALYs for each allocation scheme. The QALY maximization scheme resulted in the highest mean life years and QALYs for each transplant recipient (23.6 life y, 19.3 QALYs) but correspondingly the lowest mean life years and QALYs for patients who were not prioritized to receive a transplant (6.5 life y, 5.1 QALYs). The waiting time allocation scheme resulted in the lowest mean life years and QALYs for each transplant recipient (17.1 life y, 13.9 QALYs) and also resulted in the smallest difference in survival for those who received a transplant compared with those who did not.
TABLE 5.
Average undiscounted life y and QALYs per patient for each allocation scheme

Although the QALY maximization scheme resulted in the lowest proportion of patients aged ≥60 years receiving a transplant (4%), those who did receive a transplant survived longer on average than patients aged ≥60 years under any of the other allocation schemes. This is because the QALY maximization scheme is selecting patients who are expected to live long enough to derive the biggest survival benefit from each donor kidney compared with remaining on dialysis.
Cost-effectiveness Results
The motivation behind the QALY maximization approach is to make the most efficient use of a scarce supply of kidneys. Table 6 shows total QALYs and costs for the entire cohort of patients in the simulation. For patients who received a transplant, the QALY maximization approach generated the highest total QALYs (48 045) and also led to the highest costs (£681 million). However, Table 6 also shows that patients who were not prioritized to receive a transplant and who remained on the waiting list had worse health outcomes and generated fewer total QALYs (20 504) compared with other allocation schemes.
TABLE 6.
Cost-effectiveness results for transplant recipients, patients who did not receive a transplant and all patients combined

Taking into account total costs and QALYs for both transplant recipients and patients who remained on the waiting list, longevity matching produced the fewest QALYs (65 665) and the lowest costs (£1473 million), while the 2006 NKAS produced the most QALYs (70 569) and the highest costs (£1722 million). While the longevity matching and QALY maximization schemes both generated more QALYs for transplant recipients than the 2006 NKAS, they generated far fewer QALYs for those patients who were assumed to remain on the waiting list. In incremental cost-effectiveness analysis, random allocation and waiting time allocation were both dominated; that is to say, they were both less effective and more costly than at least one of the other allocation approaches. The comparison of the QALY maximization approach to longevity matching generated an incremental cost-effectiveness ratio (ICER) of £8751/QALY, while the comparison of the 2006 NKAS to the QALY maximization approach generated an ICER of £110 741/QALY (Figure 2).
FIGURE 2.

Cost-effectiveness plane showing the relative positions of the 5 allocation schemes in terms of both total costs (vertical axis) and total QALYs (horizontal axis) for all patients. NKAS, National Kidney Allocation Scheme; QALY, quality-adjusted life y.
DISCUSSION
The allocation of deceased donor kidneys to patients who are awaiting a transplant is constrained not only by a limited supply of kidneys but also, like all resource allocation decisions in health care, by a limited budget. The emphasis of the literature and the debate about kidney allocation has historically focused on donor organs as the only constraint and in particular on the trade-off between maximizing survival and ensuring equity in access to transplantation. In this research, we have explored a wider range of potential objectives in the design of a kidney allocation scheme and used simulation modeling to quantify the magnitude of trade-offs associated with moving from one allocation approach to another. In particular, this is the first patient-level simulation exercise to consider the costs associated with different approaches to kidney allocation in the United Kingdom and to report outcomes in terms of QALYs.
The motivation for the simulation exercise described in this article was not only to explore different allocation concepts from across the equity–efficiency spectrum but also to improve our ability to estimate variability in outcomes resulting from different approaches to allocation using patient-level data. If alternative approaches to kidney allocation result in different patients receiving transplants, then an accurate comparison of the consequences of alternative allocation schemes depends on our ability to predict variability in outcomes dependent on individual patient characteristics. This simulation exercise relied on a number of rich sources of patient-level data including the ATTOM study, the UK Transplant Registry (held by NHS Blood and Transplant), Hospital Episode Statistics, and the UK Renal Registry to develop predictive regression models to estimate survival, health state utilities, and costs. These predictive models were used not only to estimate QALYs and costs for transplant recipients in all 5 allocation schemes but also as part of the criteria to inform the kidney allocation process for the longevity matching and QALY maximization schemes.
Our research demonstrates the richness of information that can be generated from a patient-level simulation, but we are cognizant that there are limitations to any modeling exercise. In particular, we made a number of assumptions with respect to the model structure, such as only considering first-time transplants and excluding pediatric patients as the latter group fell outside of the scope of the ATTOM study. The characteristics of the donors were based on a contemporaneous cohort with the waiting list patients in the ATTOM study, but we have not attempted to model the consequences of the different allocation schemes if the composition of either the donor pool or the waiting list were to change significantly over time. Another important simplifying assumption was that patients who were on the waiting list at the end of the simulation would not receive a transplant in the future. This assumption is unlikely to be met in practice. Survival on the waiting list is on average poorer than survival following transplant, so the likely effect of this assumption is that we have underestimated total QALYs for all allocation schemes. It is difficult to anticipate the net impact of this assumption on the cost-effectiveness results. Different allocation criteria will result in different types of patients receiving transplants, and by corollary, the composition of patients who remain on the waiting list will also differ between schemes. Under the waiting time allocation scheme, patients who remain on the waiting list at the end of the simulation would in practice still have a reasonable prospect of receiving a future transplant as their likelihood of being prioritized for transplant increases with time. In contrast, under the QALY maximization scheme, patients who remain on the waiting list at the end of the simulation may be less likely to receive a future transplant if their expected QALY gains from transplant decrease over time relative to new patients joining the waiting list. Rather than attempt to apply different assumptions to each allocation scheme to project what proportion or which types of patients on the waiting list are likely to receive a future transplant at the end of the simulation, we chose to implement a standardized assumption so as not to confound our ability to observe and compare the effect of the different allocation schemes themselves. Given the importance of this assumption on estimates of QALYs and costs for the total patient population, future research should focus on testing alternative assumptions, for example, by exploring if a nonterminating model could achieve a steady-state outcome that can be compared across allocation schemes over a long enough period of time. As with all simulation exercises, the need to make simplifying assumptions may limit the generalizability of the results to the real-world context. With these caveats in mind, simulation modeling is still an important tool that can help increase our understanding of the potential consequences of different approaches to kidney allocation under the same set of conditions in comparison to each other.
Although we chose to report lifetime QALYs and costs as the main outcomes of interest, this simulation exercise was not specifically designed with standard methods for cost-effectiveness modeling at the forefront of our approach.21 There were both technical and philosophical reasons that contributed to this decision. During development of the simulation model, primary emphasis was placed on the design, feasibility, and coding of the different allocation schemes. Each scheme requires the simulation model to loop through all patients on the waiting list to evaluate donor–recipient compatibility. In the case of the QALY maximization and longevity matching schemes, survival predictions take into account both recipient and donor characteristics and therefore need to be recalculated for all 5500 patients on the waiting list each time a donor kidney enters the simulation. The computational burden of the allocation process itself led to long model running times even in the absence of introducing parameter uncertainty, and therefore, we were unable to perform full probabilistic sensitivity analysis. On a more philosophical note, kidney allocation represents a particular resource allocation problem constrained not only by a finite healthcare budget but also by a limited supply of donor organs. Conventional cost-effectiveness methods focus on maximizing health gains,22 but in the case of kidney allocation, it is clear from current policy that maximizing health gains is not the only objective. For this reason, we presented incremental cost-effectiveness results for the 5 allocation schemes but refrained from evaluating ICERs with respect to a specific threshold value. The results of this simulation exercise cannot answer the question about what the objectives of a national kidney allocation scheme should be, but nonetheless provide insight into the magnitude of QALY and cost differences to inform the discussion about trade-offs associated with alternative allocation concepts from across the equity–efficiency spectrum.
The QALY maximization approach to kidney allocation was designed to maximize health gains from a limited supply of donor kidneys. This approach yielded the most QALYs for transplant recipients but also resulted in a notable decrease in access to transplantation for older patients. Although the QALY maximization approach made more efficient use of a limited number of kidneys, it resulted in greater inequity in terms of both access to transplantation and the distribution of QALYs between transplant recipients and patients who remained on the waiting list.
A different kind of trade-off was evident when we considered the costs associated with each of the approaches to kidney allocation. The 2006 NKAS resulted in a modest increase in total QALYs across all patients compared with the QALY maximization approach but also incurred much higher total costs. If the 2006 NKAS is viewed as a compromise between equity and efficiency, then the results of this simulation provide an estimate of the additional cost to the National Health Service of maintaining greater equity in the allocation of deceased donor kidneys.
ACKNOWLEDGMENTS
This article presents independent research commissioned by the National Institute for Health Research (NIHR) under the Programme Grant for Applied Research (RP-PG-0109-10116) entitled Access to Transplantation and Transplant Outcome Measures (ATTOM). The views expressed in this publication are those of the authors and not necessarily those of the NHS, the NIHR, NHS Blood and Transplant, the UK Renal Registry, or the Department of Health. The authors thank all transplant centers who contributed data to the UK Transplant Registry and all renal centers for providing data to the UK Renal Registry upon which parts of this simulation model are based. We would like to acknowledge Lisa Mumford at NHS Blood and Transplant for facilitating access to data on donor characteristics. We are grateful to SIMUL8 Corporation (www.SIMUL8.com) for providing access to use the software under the PhD Research Scheme and to Tom Stephenson for his support during model development. We would also like to thank Matt Stevenson for providing comments on a draft version of this manuscript.
Supplementary Material
Footnotes
B.L. and J.A.C. participated in the development of the simulation model and analyses of data inputs. R.J.J. facilitated acquisition and interpretation of data from the UK Transplant Registry. All authors participated in the research design, performance of the research, and writing of the article.
Supplemental digital content (SDC) is available for this article. Direct URL citations appear in the printed text, and links to the digital files are provided in the HTML text of this article on the journal’s Web site (www.transplantjournal.com).
The authors declare no conflicts of interest.
This work was funded by a National Institute for Health Research (NIHR) Programme Grant for Applied Research (RP-PG-0109-10116).
REFERENCES
- 1.NHS Blood and Transplant. NHS Blood and Transplant Organ Donation and Transplantation Activity Report 2016/2017. 2017. Available at https://nhsbtdbe.blob.core.windows.net/umbraco-assets-corp/4607/kidney-annual-report-2016–17.pdf. Accessed March 16, 2018.
- 2.Nelson SD, Tovey GH. National organ matching and distribution service. Br Med J 19741622–624 [DOI] [PMC free article] [PubMed] [Google Scholar]
- 3.Fuggle SV, Johnson RJ, Rudge CJ, et al. Human leukocyte antigen and the allocation of kidneys from cadaver donors in the United Kingdom. Transplantation 200477618–620 [DOI] [PubMed] [Google Scholar]
- 4.Johnson RJ, Fuggle SV, Mumford L, et al. ; Kidney Advisory Group of NHS Blood and Transplant A new UK 2006 National Kidney Allocation Scheme for deceased heart-beating donor kidneys. Transplantation 201089387–394 [DOI] [PubMed] [Google Scholar]
- 5.Yuan Y, Gafni A, Russell JD, et al. Development of a central matching system for the allocation of cadaveric kidneys: a simulation of clinical effectiveness versus equity. Med Decis Making 199414124–136 [DOI] [PubMed] [Google Scholar]
- 6.Jacquelinet C, Audry B, Golbreich C, et al. Changing kidney allocation policy in France: the value of simulation. AMIA Annu Symp Proc 20062006374–378 [PMC free article] [PubMed] [Google Scholar]
- 7.Bertsimas D, Farias VF, Trichakis N. Fairness, efficiency, and flexibility in organ allocation for kidney transplantation. Oper Res 20136173–87 [Google Scholar]
- 8.Wolfe RA, McCullough KP, Schaubel DE, et al. Calculating life years from transplant (LYFT): methods for kidney and kidney-pancreas candidates. Am J Transplant 200884 Pt 2997–1011 [DOI] [PubMed] [Google Scholar]
- 9.Israni AK, Salkowski N, Gustafson S, et al. New national allocation policy for deceased donor kidneys in the United States and possible effect on patient outcomes. J Am Soc Nephrol 2014251842–1848 [DOI] [PMC free article] [PubMed] [Google Scholar]
- 10.Smith JM, Schnitzler MA, Gustafson SK, et al. Cost implications of new national allocation policy for deceased donor kidneys in the United States. Transplantation 2016100879–885 [DOI] [PubMed] [Google Scholar]
- 11.Watson CJ, Johnson RJ, Birch R, et al. A simplified donor risk index for predicting outcome after deceased donor kidney transplantation. Transplantation 201293314–318 [DOI] [PubMed] [Google Scholar]
- 12.Li B, Cairns JA, Robb ML, et al. Predicting patient survival after deceased donor kidney transplantation using flexible parametric modelling. BMC Nephrol. 2016;17:51. doi: 10.1186/s12882-016-0264-0. [DOI] [PMC free article] [PubMed] [Google Scholar]
- 13.Oniscu GC, Ravanan R, Wu D, et al. ; ATTOM Investigators Access to Transplantation and Transplant Outcome Measures (ATTOM): study protocol of a UK wide, in-depth, prospective cohort analysis. BMJ Open 20166e010377. [DOI] [PMC free article] [PubMed] [Google Scholar]
- 14.Karnon J, Stahl J, Brennan A, et al. Modeling using discrete event simulation: a report of the ISPOR-SMDM modeling good research practices task force-4. Med Decis Making 20123701–711 [DOI] [PubMed] [Google Scholar]
- 15.Royston P, Lambert PC. Flexible Parametric Survival Analysis Using Stata: Beyond the Cox Model. College Station, TX: Stata Press; 2011. [Google Scholar]
- 16.Li B, Cairns JA, Draper H, et al. Estimating health-state utility values in kidney transplant recipients and waiting-list patients using the EQ-5D-5L. Value Health 201720976–984 [DOI] [PMC free article] [PubMed] [Google Scholar]
- 17.Li B, Cairns JA, Fotheringham J, et al. Understanding cost of care for patients on renal replacement therapy: looking beyond fixed tariffs. Nephrol Dial Transplant 2015301726–1734 [DOI] [PubMed] [Google Scholar]
- 18.Li B, Cairns J, Fotheringham J, et al. ; ATTOM Study Group Predicting hospital costs for patients receiving renal replacement therapy to inform an economic evaluation. Eur J Health Econ 201617659–668 [DOI] [PubMed] [Google Scholar]
- 19.Jones-Hughes T, Snowsill T, Haasova M, et al. Immunosuppressive therapy for kidney transplantation in adults: a systematic review and economic model. Health Technol Assess 2016201–594 [DOI] [PMC free article] [PubMed] [Google Scholar]
- 20.National Institute for Health and Care Excellence. Guide to the methods of technology appraisal. London: 2013. Available at https://www.nice.org.uk/process/pmg9/chapter/the-reference-case. Accessed July 22, 2016. [PubMed] [Google Scholar]
- 21.Davis S, Stevenson M, Tappenden P, et al. NICE DSU Technical Support Document 15: cost-effectiveness modelling using patient-level simulation. 2014. Available at http://nicedsu.org.uk/wp-content/uploads/2016/03/TSD15_Patient-level_simulation.pdf. Accessed July 22, 2016. [PubMed]
- 22.Cookson R, Drummond M, Weatherly H. Explicit incorporation of equity considerations into economic evaluation of public health interventions. Health Econ Policy Law 20094Pt 2231–245 [DOI] [PubMed] [Google Scholar]
Associated Data
This section collects any data citations, data availability statements, or supplementary materials included in this article.