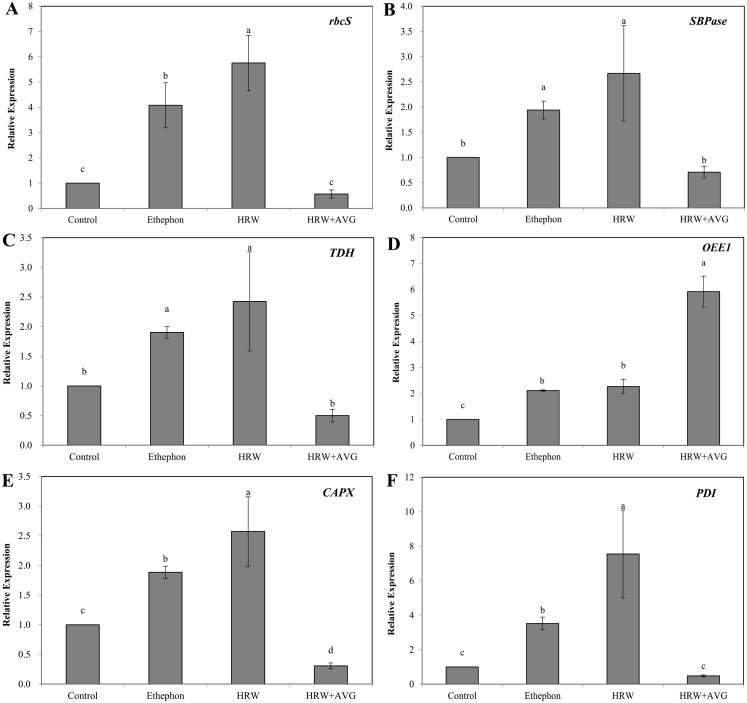
Figure 8. The effect of ETH and HRW on the expression levels of rbcS (A), SBPase (B), TDH (C), OEE1 (D), CAPX (E) and PDI (F).
The values (means ± SE) are the average of three independent experiments. Bars with different lowercase letters were significantly different by Duncan’s multiple range test (P < 0.05).

