Abstract
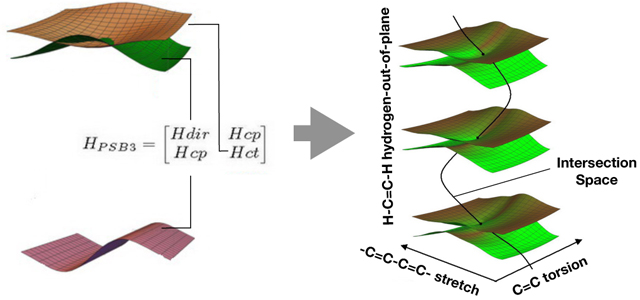
In recent years the potential energy surfaces of the penta-2,4-dieniminium cation have been investigated using several electronic structure methods. The resulting pool of geometrical, electronic and energy data, provides a suitable basis for the construction of a topographically correct analytical model of the molecule force field and, therefore, for a better understanding of this class of molecules, which includes the chromophore of visual pigments. In the present contribution, we report the construction of such a model for regions of the force field that drive the photochemical and thermal isomerization of the central double bound of the cation. While previous models included only two modes, it is here shown that the proposed three-mode model, and corresponding set of parameters, are able to reproduced the complex topographical and electronic structure features seen in electronic correlated data obtain at the XMCQDPT2//CASSCF/6–31G* level of theory.
Keywords: Retinal Chromophore, Photoisomerization, Parameterized Hamiltonian, Analytical Potential Energy Surface
Graphical Abstract
1. Introduction
The penta-2,4-dieniminium cation (PSB3) is a minimal homologue1–6 of the chromophore of visual pigments: the 11-cis protonated retinal Schiff base (PSB11). Indeed, 2-cis-PSB3 (see Scheme 1) reproduces several features of more realistic PSB11 models such as the 4-cis-nona-2,4,6,8-tetraeniminium cation, which incorporates five of the six PSB11 double bonds.9, 10 Furthermore, PSB3 features two barrier-less singlet excited state (S1) paths that drive the 2-cis to all-trans and the all-trans to 2-cis photochemical isomerizations, respectively and thus mimics the biologically important PSB11 and PSBAT (i.e. the all-trans protonated retinal Schiff base) photoisomerizations.
Scheme 1.
Photochemical and thermal double-bond isomerizations of PSB3.
Recent systematic studies,11, 12 have shed light on the topography of the ground state (S0) and the lowest singlet excited state (S1) potential energy surfaces (PESs) of PSB3. More specifically, the regions describing the isomerization of the central C2=C3 double-bond of PSB3 (see Scheme 1) have been mapped at the CASSCF level and, partially, at the CASPT2 level along six paths.12 The corresponding energy profiles have then been computed using a variety of electronic structure methods11–16 to assess their ability to reproduce the energy profiles computed at the MRCISD+Q17, 18 level of theory, which is assumed to be accurate.
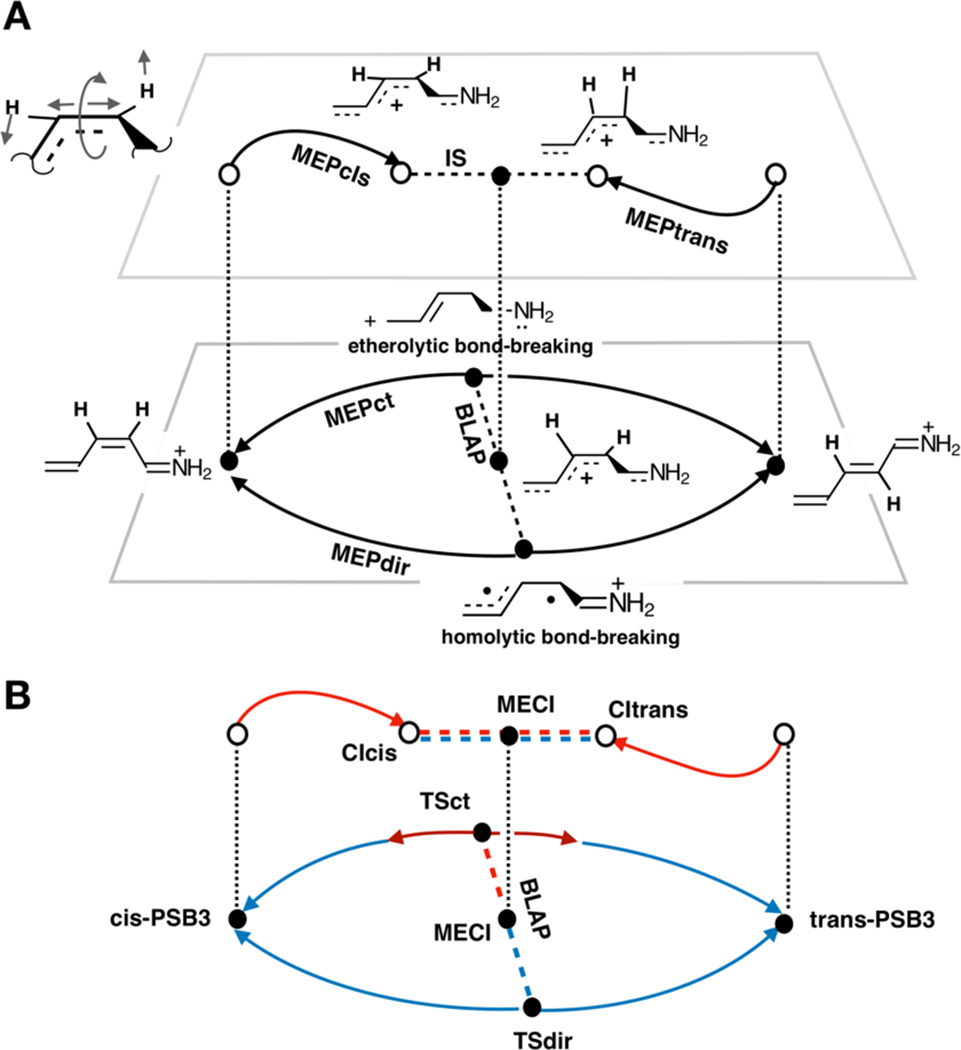
As shown in Fig. 1, the six paths include two intrinsic reaction coordinates (MEPcis and MEPtrans) describing the cis→trans and trans→cis isomerization on the S1 PES, two intrinsic reaction coordinates (MEPct and MEPdir) documenting the cis→trans and trans→cis isomerizations on the S0 PES and two interpolated paths (IS and BLAP) connecting the S1 and S0 pairs of intrinsic reaction coordinates of PSB3. These interpolated paths are chemically significant: the first path (IS) is part of the PSB3 S1/S0 intersection space (a 3N-8 dimensional space formed by conical intersection points with N being the number of nuclei) that drives the photochemical isomerization. The second path (BLAP) connects the covalent/diradical (TSdir) and charge-transfer (TSct) S0 transition states that controls the thermal isomerization, and passes through the geometry of the minimum energy conical intersection19 (MECI), i.e., the local minimum of the afore mentioned intersection space.
Figure 1.
Schematic illustration of the relationship between the six interconnected PSB3 paths considered in the present work. A. Geometrical changes. Full circles indicate the stationary points located along the S1 (upper deck) or S0 (lower deck) PESs or along the S1/S0 intersection space where, by definition the S1 and S0 energies are identical. Open circles indicate non-equilibrium structures. Dashed lines represent interpolated paths. The vertical dotted lines indicate points with identical geometry. The top-left structure represents the dominating geometrical changes of the reacting fragment. B. Electronic structure changes along the same paths. Blue lines represent paths dominated by a COV/DIR character. Red lines mark paths or path segments dominated by a CT character. The double red/blue dashed segment represents the S1 and S0 energy degeneracy along the intersection space, which have mixed CT and COV/DIR characters. CIcis and CItrans are the conical intersections located at the end of MEPcis and MEPtrans paths and mediate the 2-cis to all-trans and all-trans to 2-cis photoisomerizations, respectively.
The major geometrical changes along the different paths12 are schematically illustrated in Fig. 1A. These are characterized by (i) a stretching motion corresponding to a change in bond length alternation along the PSB3 backbone (BLA), (ii) an out-of-phase wag of the hydrogen atoms bounded to the reactive C2=C3 bond (HOOP) and (iii) the torsion about C2=C3 (Torsion). Such geometrical changes are accompanied by variations in the electronic character along the S1 and S0 PESs (see Fig. 1B). For instance, along the MEPcis and MEPtrans paths there is a change in the charge-transfer (CT) character with respect to the S0 equilibrium structures. This is apparent in Fig. 1A by comparing the upper deck CT resonance structures with the corresponding lower deck 2-cis reactant and all-trans product resonance structures. Conversely, MEPdir, which incorporates TSdir, features a covalent/diradical (COV/DIR) character, where the π-electrons are distributed as in the S0 equilibrium structures. Finally, and most remarkably, MEPct, which incorporates TSct, features the same CT character of the S1 paths in the transition state region, but switches to a COV/DIR character in the vicinity of 2-cis-PSB3 or all-trans-PSB3. As indicated in Fig. 1A, these results are consistent with TSdir and TSct mediating a homolytic and heterolytic bond breaking, respectively.
The above revised results suggest that the photochemical and thermal reactivity of PSB3 can be captured by a model force field based on three modes (i.e. geometrical coordinates) and two electronic states with varying electronic characters. The availability of an analytical expression for such simplified model force field, would permit to carry out, otherwise time-costly studies of time-dependent dynamical processes of PSB11 and PSBAT.
Below we show that the above described paths give access to the parameterization of an analytical model of the S1 and S0 PESs of PSB3. While not aiming to a quantitative model, we here pursue a model that can be realistically used for the systematic investigation of the effects of the PESs three-dimensional topography on the isomerization mechanism/dynamics of the central C2=C3 bond. The model must thus provide a qualitatively correct representation of the cenergy, geometry and electronic structure changes occurring during the photochemical and thermal double-bond isomerizations.
The parameterization of our two-state three-mode models is based on the pool of points provided by the six paths introduced above. In the following, such pool of data will be called dataset. The consequently obtained force field model should make possible to reproducte the dataset’s topographic (e.g. excitation energies and barrier) and electronic (e.g. charge distribution) features. This should remove some limitations of the two-state two-mode model originally proposed by Stock and coworkers20 that, due to its mathematical convenience, has never the less been used in several quantum dynamics studies of the retinal chromophore.21–25 In fact, as later discussed, the Stock model only accounts for a torsional (isomerization) mode and a stretching mode. Finally, we note that analytical two-state three-mode models of the retinal chromophore have been previously proposed.26, 27 However, such models were not based on extensive quantum chemical calculations but incorporated experimentally determined parameters.
2. Methods
Our parameterization is defined by: (i) the electronic structure method employed to compute the necessary S0 and S1 adiabatic energies, (ii) the expression of the three independent geometrical variables (BLA, HOOP and Torsion), (iii) the expression of a factor representing the character of the adiabatic electronic state at each point and iv is discussed in subsection 2.2. Finally, in subsection 2.3, we give the expression of the diabatic states and the diabatic states and the coupling between them, in term of geometrical coordinates.
Before presenting the technical subsections listed above, we quickly review the Stock model. Such model is defined by a Hamiltonian, where the diagonal elements represent the energies of diabatic states and the off-diagonal elements represent their electronic coupling.19 The diagonal elements are functions depending on the isomerization mode and a quadratic term depending on the stretching mode. One of the two diagonal elements also contains a third term corresponding to a linear function of the stretching mode. In total, the diagonal elements contain five different fitting parameters. The identical off-diagonal elements are, instead, expressed in terms of a linear function of the stretching mode and contain just one fitting parameter. Notice that in the Stock model, the S0 reactant and product lie in different diabatic states that cross along the torsional mode. Due to this property, such states cannot be associated to the CT and COV/DIR electronic structures discussed above (i.e. by definition the reactant and product have the same COV/DIR electronic structure). In contrast, in our model we associate the diabatic states to electronic configurations featuring different charge distributions. Such states represent the starting points for the discussion of the electrostatic effects imposed by the protein cavity on the retinal chromophore: a basic point when discussing the impact of mutations leading to red- or blue-shifted absorbance.
2.1. Geometrical variables and electronic character.
Among the various electronic structure methods employed to compute the PSB3 S1 and S0 PESs (we assume that S2 and higher states have no effect on the isomerization dynamics as reported for visual pigments. See also the final paragraph of section 4),12 XMCQDPT228 energy profiles showed a close agreement with MRCISD+Q, considered as the most accurate method. Also, in contrast with other methods providing electron correlation corrections such as CASPT2 and MRCISD+Q, it yields a correct conical intersection topology.28, 29 Thus, the primary target of this work is to construct a model Hamiltonian (HPSB3) capable of simulating the XMCQDPT2 energy trends provided by the dataset (e.g., the adiabatic energy profiles along the six paths introduced above). When necessary (see below) new XMCQDPT2 calculations have been carried out with the quantum chemical package Firefly,30 which is partially based on the Gamess US source code.31
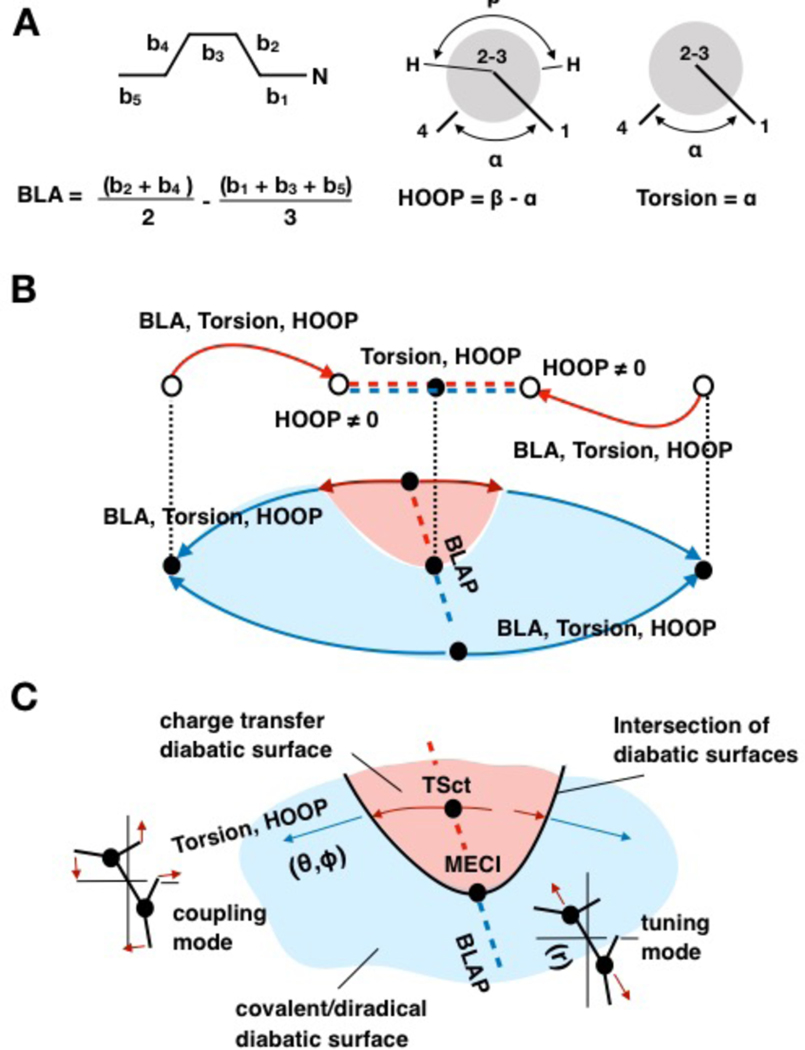
The analysis of the geometrical changes along the six paths discussed in the introduction, points to three leading geometrical variables: the BLA, HOOP and Torsion already mentioned above. As shown by the definitions given in Fig. 2A, the values of these variables can be obtained from the internal coordinates of the dataset.
Figure 2.
Geometrical variables and diabatic states. A. Geometrical coordinates used in the parameterization of the model Hamiltonian. B. Coordinates contributing to each path in the dataset (see legend of Fig. 1 for the symbols). The relationship between paths and ΨCOV/DIR and ΨCT diabatic states (electronic characters) is illustrated for the S0 PES. The red regions are dominated by ΨCT while the blue regions are dominated by ΨCOV/DIR. C. Details of the ΨCT dominated region of the S0 PES. At MECI, a pseudo totally symmetric tuning mode is associated with BLA while the coupling mode is associated to a non-totally symmetric mode featuring HOOP and Torsion contributions. In the following BLA, HOOP and Torsion are renamed r, Ф and θ respectively.
As we will detail below, the matrix elements of HPSB3 are functions of BLA, HOOP and Torsion which, starting with subsection 2.2, have been renamed, for simplicity, r, Ф and θ respectively. In Fig. 2B, we indicate the leading variables characterizing the changes along each path.11, 12 For instance, MEPcis and MEPtrans are initially led by BLA, which decreases in value due to a double-bond/single-bond inversion motion. After such process, a combination of HOOP and Torsion dominates until CIcis and CItrans (see Figure 1) are reached. These conical intersections are connected through combined HOOP and Torsion changes along IS, while BLA remains substantially constant. The BLAP path connecting TSdir and TSct on the S0 PES has the opposite behavior. In this case, HOOP and Torsion remain constant at 0° and −90°, respectively, while the geometrical change is mainly characterized by a BLA variation.
In Fig. 2B we also provide a schematic representation of the change in electronic character12 (or diabatic state) along the paths. The weight of a diabatic state is determined by computing the fraction of positive charge residing on the PSB3 moiety containing the nitrogen atom (C2H-C1H-NH2 in Scheme 1). Along the IS and at TSdir and TSct (i.e. for all structures with θ featuring a 90° value) such moiety is either charged +1 (corresponding to a pure COV/DIR character) or 0 (indicating a full CT character). In valence-bond terms, such charges correspond to resonance structures describing TSdir (homolytic bond breaking) and TSct (heterolytic bond breaking) in Fig. 1A.
Along MEPcis and MEPtrans as well as MEPdir and MEPct, the value of the charge of C2H-C1H-NH2 changes. For instance, when starting from TSct and following MEPct path, its value goes from a dominating CT character (red region) to a dominating COV/DIR character (blue region). The S0 CT region has a vertex at MECI and expands towards TSct delimiting a charge-transfer region (see Fig. 2B). In contrast, when moving along MEPdir the COV/DIR character remains dominating.
Notice that previous results on QM/MM models of the full visual pigment and/or full chromophore showed that the PES topography described above is general for polyeniminium cations (N-protonated or N-alkylated polyene Schiff bases) and it is not limited to PSB3.
2.2. Structure of the model Hamiltonian
The proposed parameterization is based on a two-state electronic Hamiltonian HPSB3 whose diagonal matrix elements Hdir and Hct correspond to the energies of the diabatic electronic states,32 while the off-diagonal matrix element Hcp represents their coupling. As anticipated above we write these matrix elements as functions of r ≡ BLA, Ф ≡ HOOP and θ ≡ Torsion (see Fig. 2A) which contain parameters whose values are determined via a fitting protocol. It follows that the eigenvalues of the corresponding secular equation provide the simulated S0 and S1 adiabatic PESs, while the eigenvectors provide information on the corresponding electronic characters.
As anticipated above, a key point in the construction of HPSB3 is the definition of the diabatic electronic states. Since diabatic states are only a mathematical construct, they can be formulated without a specific meaning. Instead, we adopt a property-based definition32 based on the magnitude of the total charge residing on the C2H-C1H-NH2 moiety of PSB3. More specifically, the diabatic states ΨCOV/DIR and ΨCT are associated with a fragment (i.e. C2H-C1H-NH2) charge equal to 0 and +1, respectively. Accordingly, the regions of the adiabatic PESs featuring a mixed electronic character (0 < charge < +1) must be described by linear combinations of ΨCOV/DIR and ΨCT with weights provided by the eigenvectors of the model Hamiltonian. Josef Michl and Vlasta Bonacǐć Koutecky have originally described the electronic states driving the photoisomerization of model retinal chromophores.33
In order to propose an expression for Hdir and Hct, i.e., for the diabatic PESs associated with ΨCOV/DIR and ΨCT, we have chosen r as the (pseudo) totally symmetric tuning mode34, 35 (see BLAP direction in Fig. 2C). This appears to be a convenient choice as the charge distribution extracted from the dataset shows that along BLAP the adiabatic states are substantially pure diabatic states. Furthermore, when starting from TSdir on the S0 PES and move towards TSct, the electronic character switches from pure ΨCOV/DIR to pure ΨCT at MECI. Accordingly, the off-diagonal matrix element Hcp must be zero along BLAP and whenever the value of Ф and θ are simultaneously 0° and 90°, respectively.
As illustrated in Fig. 2C, the two diabatic PESs must cross in a direction orthogonal to BLAP forming an intersection. In the vicinity of MECI, such direction corresponds to a combination of Ф and θ defined as the coupling mode (i.e. in a direction orthogonal to BLAP in Fig. 2C).34, 35 The computed adiabatic energies show that when moving along such mode the S1 and S0 adiabatic energies split. Hcp must therefore increase from zero to non-zero values along such mode.
In order to account for the above dataset features during the parameterization, we impose the following constraints on the expressions of Hdir, Hct and Hcp: (i) Hcp=0 when Ф = 0° and θ = ±90° (i.e. along the tuning mode), (ii) Hcp increases when moving along the coupling mode, and (iii) Hcp is independent from r. As we will discuss below, we also impose an extra constrain which is not fully consistent with the information found in the dataset: (iv) at the S0 equilibrium structures of 2-cis-PSB3 and all-trans-PSB3, the S0 and S1 states correspond to pure ΨCOV/DIR and ΨCT diabatic states, respectively.
As illustrated in Fig. 2C, the diabatic PESs cross along a line spanning a range of θ and Ф values. This is reasonable when considering that one follows the diabatic states over a large region of the configuration space on both the S1 and S0 PESs. We stress that the diabatic crossing produced by the proposed Hamiltonian is ultimately determined by the fitting protocol and not imposed by the model.
2.3. Expressions of the Diabatic functions and Coupling Term
As previously mentioned, the diagonal matrix elements Hdir and Hct are functions of r, θ and Ф. However, since the dataset indicates that r and Ф are weakly coupled, the expression of Hdir and Hct have been written as:
| (1) |
| (2) |
| (3) |
Where Hdir2D and Hct2D are functions of r and θ exclusively. Since the Ф coordinate contributes to determine the π-overlap across the reactive double bond, it must affect the diabatic energies when its value is different from zero (i.e. when the π-orbitals interacting across the reactive double bound are orthogonal). Accordingly, the dependence of Hdir and Hct on Ф is introduced via the terms Hdircorr and Hctcorr. Hdir2D and Hct2D can be then seen as the analogue of the diagonal elements of the Sotck’s model, while the correction functions are employed to account for the Ф dependence seen in the dataset.
The four terms Hdir2D, Hct2D, Hdircorr and Hctcorr were defined using the following functional forms:
| (4) |
| (5) |
| (6) |
| (7) |
Finally, the expression of the electronic coupling is:
| (8) |
These expressions contain a total of 15 parameters (c, d, hc, hd and k parameters) whose values are found by fitting the dataset (see next subsection). The significance of the most relevant parameters will be discussed in section 3.
2.4. Fitting protocol
Each dataset point contains one set of nuclear coordinates, the associated S0 and S1 adiabatic energies and the corresponding atomic charges. All quantities were computed at the XMCQDPT2//CASSCF/6–31G* level (i.e. the nuclear coordinates were computed at the CASSCF level and the energies through single point XMCQDPT2 calculations). The reason for using the modest 6–31G* basis set has been explained in ref. 11 (see Table 2 in ref. 11) and it is justified by the fact that, mainly due to a cancellation of errors, the 6–31G* basis set is rather accurate (with respect to MR-CISD+Q energies) in regions not too far for the FC point and provide a qualitatively correct description also in regions that are far from it.
For each point, the corresponding values of r, θ and Ф were determined using the definitions in Fig. 2A. Similarly, the electronic character of the S0 and S1 adiabatic states were determined by calculating the total Mulliken atomic charge of the C2H-C1H-NH2 moiety. The fitting of the entire dataset required four steps:
Selection from the dataset of a subset of “diabatic points” where the adiabatic states are assumed to correspond to the ΨCOV/DIR or ΨCT states. The set comprises the first 11 points of MEPcis and MEPtrans and all 14 BLAP points for a total of 36 points. All diabatic points have Ф = 0°. Moreover, the MEPcis, BLAP and MEPtrans diabatic points have approximately θ = 0°, θ = −90° and θ = −180°, respectively.
Parametrization of Hct2D and Hdir2D. Hct2D and Hdir2D feature a total of 9 parameters (c1-c5 and d1-d4) whose values are determined by fitting the 36 “diabatic points” defined in I.
Expression of Hdir and Hct. The parameterized functions, Hdir2D and Hct2D, are then added to Hdircorr and Hctcorr respectively, to obtain the final expression of the diagonal matrix elements of HPSB3. These two expressions contain other four parameters hc1-hc2 and hd1-hd2 not yet fitted (they will be fitted together with the two parameters k1-k2 belonging to Hcp, see step IV) while c1-c5 and d1-d4 are kept fixed, as their values are established in point II.
After incorporating the off-diagonal Hcp term, the model Hamiltonian is diagonalized to obtain simulated S0 and S1 adiabatic energies whose values depend on the 9 parameters (hc1-hc2, hd1-hd2, k1-k2) of Hdircorr, Hctcorr and Hcp. These parameter values are obtained by fitting the full dataset plus additional 144 dataset points obtained via 24 scans along the Ф coordinate whose details are given in section S1 of the Supporting Information (SI).
The fitting is performed using two utilities of the software Mathematica: FindFit and NonlinearModelFit. In both cases, the function minimizes a least‐squares fit between the S0 and S1 adiabatic energies of the dataset and the adiabatic energies from the model Hamiltonian. Since the converged parameter values may depend on the input values, we have achieved a steady and consistent result by trying several initial energy values (see section S2 in the SI). The final fitted parameters for PSB3 are given in Table 1.
Table 1.
Optimum parameters for HPSB3
| PSB3 | |
|---|---|
| Hdir2D | |
| d1 | 2571 |
| d2 | 50.56 |
| d3 | 3.730 |
| d4 | 595.0 |
| Hct2D | |
| c1 | 437.1 |
| c2 | 16.73 |
| c3 | 7.355 |
| c4 | 88.52 |
| c5 | 5.952 |
| Hdircorr | |
| hd1 | 37.58 |
| hd2 | 38.03 |
| Hctcorr | |
| hc1 | 20.82 |
| hc2 | 21.21 |
| Hcp | |
| k1 | 14.07 |
| k2 | 1.082 |
3. Results and discussion.
In the present section, we start by looking at the accuracy (subsection 3.1) of the model Hamiltonian obtained after the fitting described in section 2. Next, in subsections 3.2 and 3.3, we discuss the topography of Hdir, Hct, Hcp and the topography of the resulting simulated PSB3 force field. To do so, we look at the variations of the two-dimensional PES cross-section along r and θ as a function of Ф.
3.1. Model accuracy.
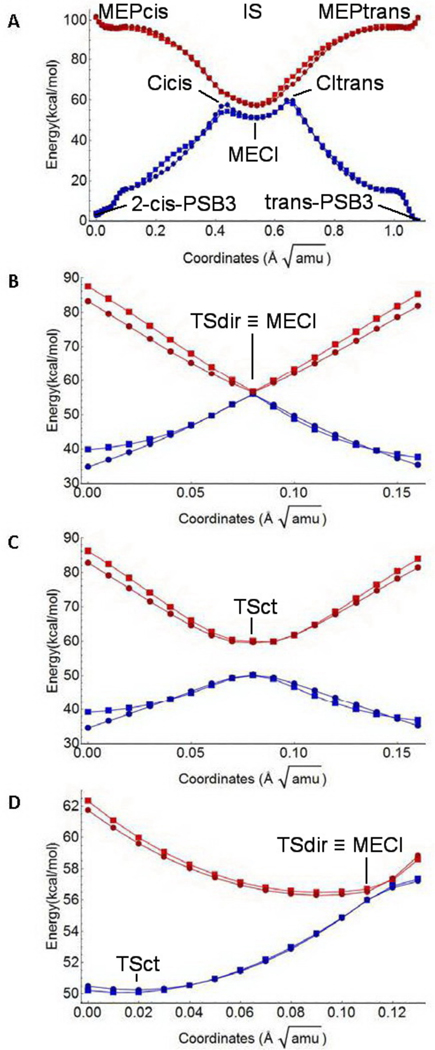
Below, we use the term “simulated” to indicate the dataset values recomputed using the proposed model Hamiltonian with the parameters of Table 1. Fig. 3A shows the S0 (blue) and S1 (red) energy profiles along the MEPcis (left), MEPtrans (right) and IS (center) paths. The figure shows that the parameterized HPSB3 function is capable to simulate the three sets of data with good accuracy. The same positive results is documented in Fig. 3B and 3C for the MEPct and MEPdir profiles, respectively. Finally, the energy profile along BLAP is displayed in Fig. 3D. Again, HPSB3 satisfactorily simulates the dataset values.
Figure 3.
Comparison of dataset (circles) and simulated (squares) adiabatic energy profiles along the six paths considered in this work. S0 and S1 profiles are in blue and red, respectively. A. MEPcis, MEPtrans and connecting IS profiles. The points include the 2-cis-PSB3 and all-trans-PSB3 equilibrium structures and the CIcis, CItrans and MECI conical intersections, B. MEPdir including the transition state TSdir. C. MEPct including the transition state TSct. D. BLAP energy including TSdir, TSct and MECI.
The HPSB3 accuracy has been evaluated quantitatively starting with Hdir2D and Hct2D. For these functions, the difference between dataset and simulated values is ca. 1 kcal/mol (see section S3 in the SI). When Hdircorr, Hctcorr and Hcp are also considered, such differences increase, but the Standard Deviation remains lower than 2.5 kcal/mol, with only few values larger than 6 kcal/mol (see section S3 in the SI). However, we have found that the less accurate points belong to the Ф scans, which are not part of the six dataset paths. However, path regions, that are not well fitted, are found also in the last points of MEPdir and MEPct (see Fig. 3C and 3D). However, the model fit these paths satisfactorily in the regions close the TSdir and TSct, that is the chemically relevant parts.
An independent test, providing information on the quality of the parameterization of HPSB3, is the comparison between dataset and simulated electronic characters. As explained above, the simulated values come from the HPSB3 eigenvectors that provide the weights of ΨCOV/DIR and ΨCT in each adiabatic state (ΨS0 and ΨS1). The corresponding information can be extracted from the dataset and compared with the simulated trend. For instance, when the charge on C2H-C1H-NH2 is close to +1 or 0, we assign these points to pure ΨCOV/DIR or ΨCT states, respectively.
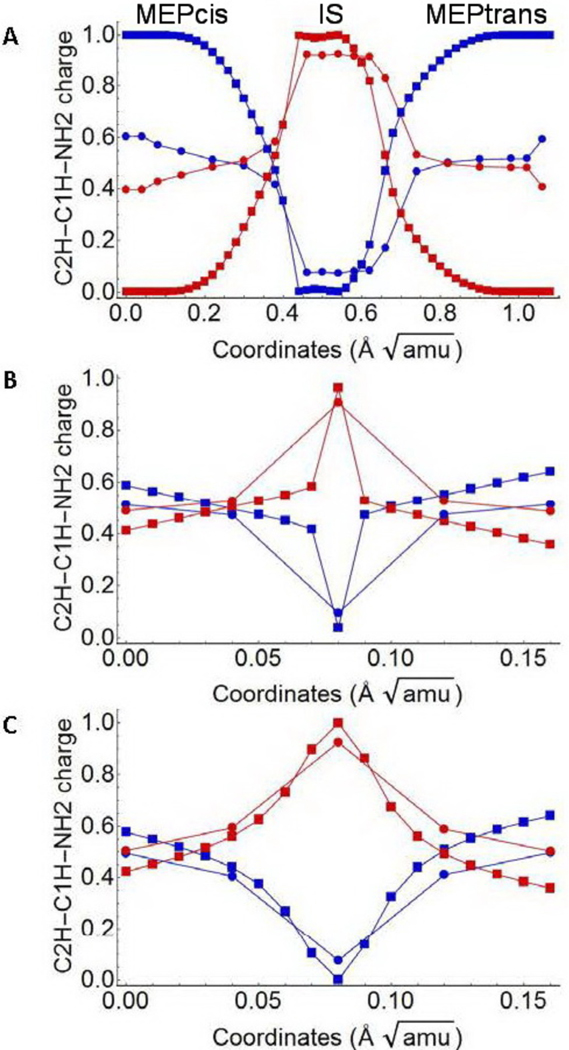
In Fig. 4, we compare the dataset (circles) and simulated (square) charge of the C2H-C1H-NH2 moiety (i.e. the weight of the ΨDIR diabatic state). Although the parameterization is only based on adiabatic energies (i.e. no information is provided on the electronic character), the figure displays a qualitative agreement between dataset and simulation, with the only exception of the initial parts of MEPcis and MEPtrans (see panel A in Fig. 4). This disagreement is related to a model constrain (see point IV in subsection 2.2 discussing the parameterization constraints). In fact, as reported above, the initial 11 points along both paths were assumed to correspond to pure diabatic states. This assumption forces the simulated electronic character to be very different from the one displayed in the dataset where the charge on the reference fragment is +0.6 (instead of +1) in S0 and +0.4 (instead of 0) in S1 in both 2-cis and all-trans-PSB3. However, the discrepancy between dataset and simulated values decreases rapidly as one proceed along the two paths.
Figure 4.
Comparison of dataset (circles) and simulated (squares) ΨCOV/DIR weights (electronic characters). A. MEPcis, MEPtrans and connecting IS. B. MEPdir. C. MEPct. Notice (see also text) that not all simulated points (squares) compare well with the dataset points (circles).
3.2. Parameter sensitivity and topography of the diabatic PESs.
Certain Hdir2D and Hct2D parameters are associated with specific features of the corresponding two-dimensional PESs. For instance, the value 0.091 in Equation 4 defines the S0 equilibrium r values of 2-cis-PSB3 and all-trans-PSB3 (this is treated as a constant specific to the system under investigation and it is, thus, not fitted), while d3 determines the energy difference between the same two energy minima. In contrast, c4 controls the vertical excitation energies of the same reactant and product minima. d4 is the force constant of r mode of the two points of minima in the ground state, while c1 is the same force constant evaluated at the two Franck-Condon (FC) points.
The S1 and S0 energy profiles along BLAP determine the sloped or peaked MECI topography that, in turn, reflects the relative stability of ΨCOV/DIR or ΨCT along the path. Such topography is controlled by d2. More specifically, the ΨDIR energies are shifted at lower or higher values if d2 increase or decrease, respectively. In this way, it is possible to define the energy of the BLAP minimum corresponding, in two- or three-dimensions, to TSdir. In a similar way c3 determines the position of TSct.
In the Hctcorr and Hdircorr functions, Ф changes the energy in a periodic fashion (Equations 6 and 7). When θ = 0°, ±90° and −180°, a Ф change produces a quadratic-like energy profile, with a vertex at Ф=0° in both Hctcorr and Hdircorr. As soon as the value of θ, starting from a value of 0°, approaches that of CIcis, such vertex moves to negative or positive Ф values in Hdircorr and Hctcorr, respectively. In case we start from a value of θ = −180° and then approaching the θ value of CItras, such vertex moves to positive or negative Ф values in Hdircorr and Hctcorr, respectively. These changes increase in magnitude until CIcis and CItrans are reached. Then, along IS, Ф goes back towards a 0° value while θ proceeds towards a −90° value (i.e., towards the values of these variables at MECI).
The hd1 and hc1 parameters determine the concavity of the quadratic-like energy profile discussed above and can be interpreted as the “force constant” of the “Ф mode”. In contrast, the parameters hd2 and hc2 describe the shifting of its vertex as a function of θ. When one increases such parameters, the magnitude of Ф at the CIcis and CItrans vertex is increased.
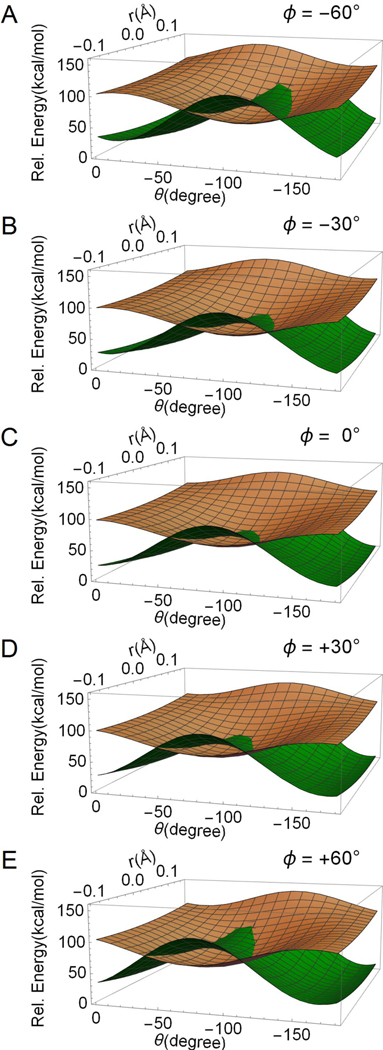
In Fig. 5, we document the change in topography of the parameterized diabatic PESs (Hdir and Hct) along r, θ and Ф. Each panel shows their values as a function of r and θ. The different panels correspond to a different value of Ф with the middle panel (i.e. panel C) corresponding to Ф=0°. The panels show how the seam between the two diabatic PESs moves. Indeed, the seam moves from θ < −90° when Ф > 0° to θ > −90° when Ф < 0°. This feature is consistent with the IS dataset that shows Ф variations at each point. In fact, CIcis is characterized by a positive Фwhile CItrans by a negative value of Ф. Thus, the seam characterized by different values of Ф forms a surface (i.e. a two-dimensional set) of degenerate diabatic energies. As we discuss below, the coupling term Hcp transforms such surface into a curve (i.e. a one-dimensional set) of degenerate S1 and S0 adiabatic energies (i.e., of conical intersections) containing the IS path of the dataset.
Figure 5.
Two-dimensional cross-sections of the diabatic PESs resulting from the parametrization of Hct and Hdir along r and θ. The different cross-sections (i.e. from panel A to panel E) document the effect of Ф on the PES topography and intersection. The ΨCT PES is displayed in brown, while the ΨCOV/DIR PES is displayed in green.
3.3. Parameters and topography of the off-diagonal matrix element
The dataset indicates that Hcp must vanish when the π-orbital overlap across the reacting C2=C3 double bond is either zero (i.e., when the C2H-C1H-NH2 and H2C5-C4H-C3H π-orbitals are orthogonal) or maximized (i.e., the same π-orbitals are parallel). The first condition is satisfied at points such as MECI, TSct, TSdir and at all points along the IS path. In contrast, the second condition is assumed to be true at the reactant and product S0 equilibrium geometries (i.e. 2-cis-PSB3 and all-trans-PSB3 respectively) as in any other geometry which display maximum π-bonding (i.e. where Ф = 0° and θ = 0° or θ = 180°). In all other structures Hcp ≠ 0, the two diabatic states mix and the diabatic and adiabatic PESs become different.
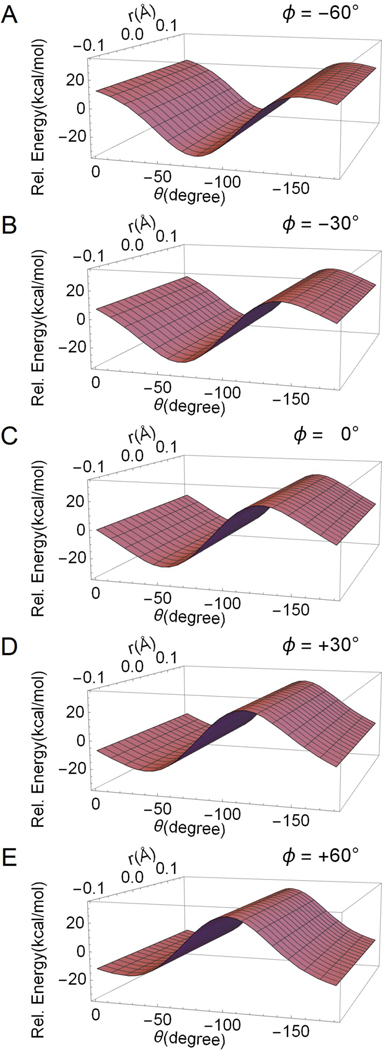
Consistently with the above listed constraints, Hcp is written as a periodic function modulated by k1, multiplied by a second scaling term that reaches a maximum value when θ = ±90° and that contains the k2 parameter. As illustrated in Fig. 6, as one moves off the MECI (i.e., off θ = −90° and Ф = 0), the coupling becomes large in module. k1 represents the amplitude of the sinusoidal function controlling such splitting (see eq. 8). The sinusoid is maximized when θ – Ф / 2 = −45° ± k π/2, that is around the middle of the reaction paths. Finally, k2 controls the effect of a periodic scaling that makes Hcp larger near θ = ±90°. A better result can be obtained adding additional terms, for instance a sinusoid with maximum at θ – Ф / 2 = −45° ± kπ/4. k1 is an important parameter for the final accuracy of the model (see p-value in Table S2 of the SI); however, in order to simplify the reshaping to other force fields, it can be removed.
Figure 6.
Two-dimensional cross-section of the coupling term Hcp as a function of r and θ. The different cross-sections (i.e. from panel A to panel E) document the effect of Ф on the Hcp surface topography. Notice that Hcp is independent from the r coordinate.
Each panel in Fig. 6 is associated to a different value of Ф and displays the Hcp as a function of r and Θ. Inspection of the panels from top to bottom shows a strong dependency on the Ф value. In contrast, and consistently with our assumption, the coupling is independent from r. Notice that, consistently with the IS path dataset, the points where the coupling vanish (i.e. Hcp = 0) are shifted along θ when changing Ф. For instance, CIcis has a θ ~ −70° and Ф ~ 36°. The diagonalization of HPSB3 yields the adiabatic states expressed in terms of the square of Hcp and its sign has, thus, no significance.
3.4. Topography of the simulated S1 and S0 adiabatic PESs.
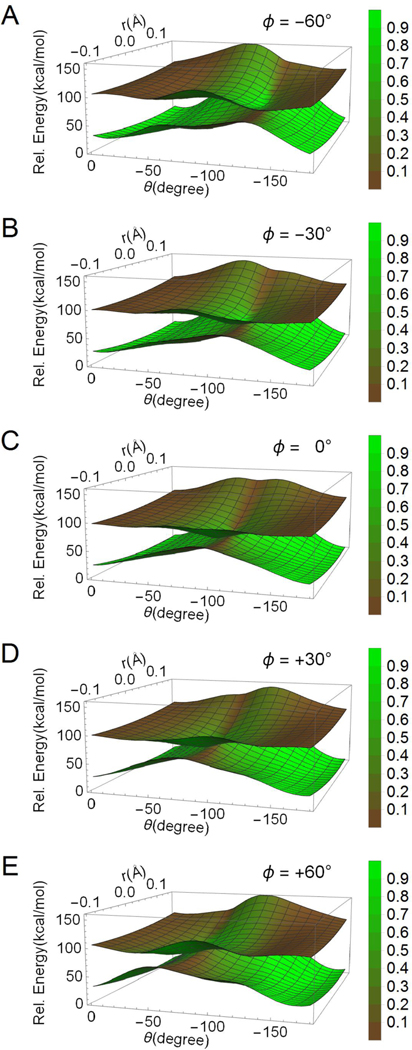
The simulated adiabatic PESs obtained by solving the secular equation associated to HPSB3 are shows in Fig. 7. As for Fig. 5 and 6, each panel displays two-dimensional PES cross-sections corresponding to different Ф values. The secular equation also provides the simulated S1 and S0 adiabatic states (eigenvectors) expressed in terms of linear combinations of the ΨCOV/DIR and ΨCT diabatic states. The weights of ΨCOV/DIR and ΨCT are qualitatively represented with a color scale that highlights the percentage of covalent/diradical (green) and charge-transfer (brown) characters. Notice that, as stressed above and in order to decrease the mathematical complexity, we have imposed that the S0 and S1 states are characterized by pure ΨCOV/DIR and ΨCT states at the reactant and product structures, respectively.
Figure 7.
Two-dimensional cross-sections of the simulated adiabatic PESs resulting from the parameterization of Hct, Hdir and Hcp along r and θ. The different cross-sections (i.e. from panel A to panel E) document the effect of Ф on the PES topography and conical intersection. The weight of the ΨCT character is displayed in brown, while the weight of the ΨCOV/DIR character is displayed in green. The legend on the right shows the eigenvector coefficients regarding the charge displaced in the C2H-C1H-NH2 moiety proportional to the ΨCOV/DIR weight.
The simulated electronic character is qualitatively consistent with those obtained from the dataset (see also Fig. 4). In other words, it is consistent with our understanding of the changes in electronic character along the S1 isomerization paths and in the vicinity of conical intersection points. This can be seen in Fig. 7, where on the S1 PES one goes from a region dominated by ΨCT (i.e. in correspondence of the reactant and product geometries) to mixed ΨCOV/DIR and ΨCT regions when moving towards the transition states. Furthermore, it is evident that along any S1 walk forming a loop encircling a conical intersection point, the S1 or S0 character moves from regions with charge-transfer character to regions with a pure covalent/diradical character and again to regions with charge transfer character or vice versa. This behavior is consistent with the theory of conical intersections (e.g. the existence of a geometric phase) and must occur in opposite directions in S1 and S0.
4. Conclusions
We have provided a mathematical expression for the first two adiabatic PESs of PSB3: a minimal model of the chromophore of the retina visual pigment of vertebrate and invertebrates. The employed Hamiltonian, which is based on a diabatic representation where each diabatic state corresponds to a specific electronic character (i.e., either covalent/diradical or charge-transfer), is a function of three different geometrical modes. After the parameterization, the simulated S0 and S1 adiabatic energies show a good correlation with the corresponding dataset points computed at the XMCQDPT2/6–31G* level of theory. This is especially true in regions close to reaction paths (with differences close to 2 kcal/mol), while less precise results are found far from the paths and along Ф deformations.
Relative to the model of Stock, we have improved the model physics by: (i) fitting accurate dataset points, (ii) including an extra degree of freedom which is known to play a fundamental role in the isomerization processes and (iii) incorporating information on the change in electronic distribution along the adiabatic PESs. Future developments of the model could include the increase in the number of states to achieve a three-state three-mode model, which appears to be necessary for studying rhodopsins different from visual pigments. Moreover, we wish to make the model adjustable. In other words, we wish to introduce parameters that can introduce predictable variations in the topology and topography of the adiabatic PESs. In this way researchers may use the model as a basis for simulating the PESs of chromophore models with a conjugated π-system longer than PSB3, the effect of certain substituents or the effect of the presence of a complex environment. It may also be possible to generate models for different biological chromophores.36 Finally, and most importantly, the model developed here, or any suitably adjusted model derived from it, could be used to perform quantum dynamics calculation with traditional or novel methods requiring analytical PESs.22, 37
Finally, we have to warn the reader that, according to recent reports38, 39 and in contrast with the rhodopsins of superior animals where only two electronic states (the S0 and S1 states) are mainly driving the isomerization process, the photoinduced microbial rhodopsin dynamics often display the involvement of a third state (S2). Thus PSB3, which has an S2 state higher11, 40 and not interacting with the S1 state along the six reaction paths parametrized above (see the extensive 3-root state-average XMCQDPT2 mapping in section S4 of the Supporting Information) provides a model of rhodopsins where S1 never interact with S2. A future parametrization project in our lab will address the issue of generalizing the presented two-state three-mode model to a three-state three-mode model also applicable to microbial rhodopsins.
Supplementary Material
ACKNOWLEDGMENT
The authors are indebted to Dr. Samer Gozem of Georgia State University for a critical reading of the manuscript. E.M., L.D.V. and M.O. acknowledge MIUR (Ministero dell’Istruzione, dell’Università e della Ricerca) grant “Dipartimento di Eccellenza 2018 – 2022”. The research has been partially supported by the following grants MIUR (PRIN 2015) NSF CHE-CLP-1710191, NIH 1R15GM126627 01. M.O. is also grateful for an USIAS 2015 fellowship.
Funding Sources
USIAS (University of Strasbourg), MIUR, NSF and NIH.
Footnotes
ASSOCIATED CONTENT
Supporting Information. A single text file containing the details of (i) the rigid Ф scan, (ii) the starting values for the fitting procedures and (iii) the deviation between model and dataset. The Supporting Information is available free of charge on the ACS Publications website.
The authors declare not competing financial interest.
References
- (1).Vreven T; Bernardi F; Garavelli M; Olivucci M; Robb MA; Schlegel HB Ab Initio Photoisomerization Dynamics of a Simple Retinal Chromophore Model. J. Am. Chem. Soc 1997, 119, 12687–12688. [Google Scholar]
- (2).Garavelli M; Bernardi F; Robb MA; Olivucci M. The short-chain acroleiniminium and pentadieniminium cations: towards a model for retinal photoisomerization. A CASSCF/PT2 study. J. Mol. Struct 1999, 463, 59–64. [Google Scholar]
- (3).Page CS; Olivucci M. Ground and excited state CASPT2 geometry optimizations of small organic molecules. J. Comput. Chem 2003, 24, 298–309. [DOI] [PubMed] [Google Scholar]
- (4).Sinicropi A; Migani A; Vico LD; Olivucci M. Photoisomerization Acceleration in Retinal Protonated Schiff-base Models. Photochem. Photobiol. Sci 2003, 2, 1250–1255. [DOI] [PubMed] [Google Scholar]
- (5).Fantacci S; Migani A; Olivucci M. CASPT2//CASSCF and TDDFT//CASSCF Mapping of the Excited State Isomerization Path of a Minimal Model of the Retinal Chromophore. J. Phys. Chem. A 2004, 108, 1208–1213. [Google Scholar]
- (6).Barbatti M; Ruckenbauer M; Szymczak JJ; Aquino AJA; Lischka H. Nonadiabatic excited-state dynamics of polar pi-systems and related model compounds of biological relevance. Phys. Chem. Chem. Phys 2008, 10, 482–494. [DOI] [PubMed] [Google Scholar]
- (7).Mori T; Nakano K; Kato S. Conical intersections of free energy surfaces in solution: effect of electron correlation on a protonated Schiff base in methanol solution. J. Chem. Phys 2010, 133, 064107. [DOI] [PubMed] [Google Scholar]
- (8).Valsson O; Filippi C. Photoisomerization of Model Retinal Chromophores: Insight from Quantum Monte Carlo and Multiconfigurational Perturbation Theory. J. Chem. Theory Comput 2010, 6, 1275–1292. [Google Scholar]
- (9).De Vico L; Page CS; Garavelli M; Bernardi F; Basosi R; Olivucci M. Reaction Path Analysis of the “Tunable” Photoisomerization Selectivity of Free and Locked Retinal Chromophores. J. Am. Chem. Soc 2002, 124, 4124–4134. [DOI] [PubMed] [Google Scholar]
- (10).De Vico L; Garavelli M; Bernardi F; Olivucci M. Photoisomerization mechanism of 11-cis-locked artificial retinal chromophores: acceleration and primary photoproduct assignment. J. Am. Chem. Soc 2005, 127, 2433–2442. [DOI] [PubMed] [Google Scholar]
- (11).Gozem S; Huntress M; Schapiro I; Lindh R; Granovsky A; Angeli C; Olivucci M. Dynamic Electron Correlation Effects on the Ground State Potential Energy Surface of a Retinal Chromophore Model. J. Chem. Theory Comput 2012, 8, 4069–4080. [DOI] [PubMed] [Google Scholar]
- (12).Gozem S; Melaccio F; Lindh R; Krylov AI; Granovsky AA; Angeli C; Olivucci M. Mapping the excited state potential energy surface of a retinal chromophore model with multireference and equation-of-motion coupled-cluster methods. J. Chem. Theory Comput 2013, 9, 4495–4506. [DOI] [PubMed] [Google Scholar]
- (13).Huix-Rotllant M; Filatov M; Gozem S; Schapiro I; Olivucci M; Ferré N. Assessment of Density Functional Theory for Describing the Correlation Effects on the Ground and Excited State Potential Energy Surfaces of a Retinal Chromophore Model. J. Chem. Theory Comput 2013, 9, 3917–3932. [DOI] [PubMed] [Google Scholar]
- (14).Gozem S; Melaccio F; Valentini A; Filatov M; Huix-Rotllant M; Ferré N; Frutos LM; Angeli C; Krylov AI; Granovsky AA; Lindh R; Olivucci M. Shape of Multireference, EOM-CC, and DFT Potential Energy Surfaces at a Conical Intersection. J. Chem. Theory Comput 2014, 10, 3074–3084. [DOI] [PubMed] [Google Scholar]
- (15).Tuna D; Lefrancois D; Wolanski L; Gozem S; Schapiro I; Andruniów T; Dreuw A; Olivucci M. Assessment of Approximate Coupled-Cluster and Algebraic-Diagrammatic-Construction Methods for Ground-and Excited-State Reaction Paths and the Conical-Intersection Seam of a Retinal-Chromophore Model. J. Chem. Theory Comput 2015, [DOI] [PubMed] [Google Scholar]
- (16).Zen A; Coccia E; Gozem S; Olivucci M; Guidoni L. Quantum Monte Carlo Treatment of the Charge Transfer and Diradical Electronic Character in a Retinal Chromophore Minimal Model. J. Chem. Theory Comput 2015, 11, 992–1005. [DOI] [PMC free article] [PubMed] [Google Scholar]
- (17).Werner H; Knowles PJ An efficient internally contracted multiconfiguration–reference configuration interaction method. J. Chem. Phys 1988, 89, 5803–5814. [Google Scholar]
- (18).Werner H-J; Kállay M; Gauss J. The barrier height of the F+H2 reaction revisited: Coupled-cluster and multireference configuration-interaction benchmark calculations. J. Chem. Phys 2008, 128, 34305. [DOI] [PubMed] [Google Scholar]
- (19).Atchity GJ; Xantheas SS; Ruedenberg K. Potential energy surfaces near intersections. J. Chem. Phys 1991, 95, 1862–1876. [Google Scholar]
- (20).Hahn S; Stock G. Quantum-mechanical modeling of the femtosecond isomerization in rhodopsin. J. Phys. Chem. B 2000, 104, 1146–1149. [Google Scholar]
- (21).Tscherbul TV; Brumer P. Excitation of Biomolecules with Incoherent Light : Quantum Yield for the Photoisomerization of Model Retinal. J. Chem. Phys 2014, 118, 3100–3111. [DOI] [PubMed] [Google Scholar]
- (22).Curchod BFE; Agostini F. On the Dynamics through a Conical Intersection. J. Phys. Chem. Lett 2017, 8, 831–837. [DOI] [PubMed] [Google Scholar]
- (23).Johnson PJM; Farag MH; Halpin A; Morizumi T; Prokhorenko VI; Knoester J; Jansen TLC; Ernst OP; Miller RJD The primary photochemistry of vision occurs at the molecular speed limit. J. Phys. Chem. B 2017, 121, 4040–4047. [DOI] [PubMed] [Google Scholar]
- (24).Abe M; Ohtsuki Y; Fujimura Y; Domcke W. Optimal control of ultrafast cis-trans photoisomerization of retinal in rhodopsin via a conical intersection. J. Chem. Phys 2005, 123, 144508. [DOI] [PubMed] [Google Scholar]
- (25).Farag MH; Jansen TLC; Knoester J. Probing the Interstate Coupling near a Conical Intersection by Optical Spectroscopy. J. Phys. Chem. Lett 2016, 7, 3328–3334. [DOI] [PubMed] [Google Scholar]
- (26).Farag MH; Jansen TLC; Knoester J. The origin of absorptive features in the two-dimensional electronic spectra of rhodopsin. Phys. Chem. Chem. Phys 2018, 20, 12746–12754. [DOI] [PubMed] [Google Scholar]
- (27).Seidner L; Domcke W. Microscopic modelling of photoisomerization and internal-conversion dynamics. Chem. Phys 1994, 186, 27–40. [Google Scholar]
- (28).Granovsky AA Extended multi-configuration quasi-degenerate perturbation theory: The new approach to multi-state multi-reference perturbation theory. J. Chem. Phys 2011, 134, 214113–214127. [DOI] [PubMed] [Google Scholar]
- (29).Shiozaki T; Werner H-J Explicitly correlated multireference configuration interaction with multiple reference functions: Avoided crossings and conical intersections. J. Chem. Phys 2011, 134, 184104. [DOI] [PubMed] [Google Scholar]
- (30).Granovsky AA Firefly, version 8.2.0 http://classic.chem.msu.su/gran/firefly/index.html (accessed 1st September 2017) 2012.
- (31).Schmidt MW; Baldridge KK; Boatz JA; Elbert ST; Gordon MS; Jensen JH; Koseki S; Matsunaga N; Nguyen KA; Su S. General atomic and molecular electronic structure system. J. Comput. Chem 1993, 14, 1347–1363. [Google Scholar]
- (32).Vlaisavljevich B; Shiozaki T. Nuclear Energy Gradients for Internally Contracted Complete Active Space Second-Order Perturbation Theory: Multistate Extensions. Journal of Chemical Theory Computation 2016, 12, 3781–3787. [DOI] [PubMed] [Google Scholar]
- (33).Michl J; Bonačić-Koutecký V. Electronic aspects of organic photochemistry; Wiley: New York, 1990. [Google Scholar]
- (34).Köppel H. In Conical Intersections: Electronic Structure, Dynamics and Spectroscopy; Domcke W, Yarkony DR, Köppel H, Ed.; World Scientific: Singapore, 2004; pp 175–204. [Google Scholar]
- (35).Woywod C; Domcke W; Sobolewski AL; Werner H. Characterization of the S1–S2 conical intersection in pyrazine using ab initio multiconfiguration self-consistent-field and multireference configuration-interaction methods. J. Chem. Phys 1994, 100, 1400–1413. [Google Scholar]
- (36).Gozem S; Luk HL; Schapiro I; Olivucci M. Theory and Simulation of the Ultrafast Double-Bond Isomerization of Biological Chromophores. Chem. Rev 2017, 117, 13502–13565. [DOI] [PubMed] [Google Scholar]
- (37).Sala M; Egorova D. Quantum dynamics of multi-dimensional rhodopsin photoisomerization models: Approximate versus accurate treatment of the secondary modes. Chem. Phys 2018, 515, 164–176. [Google Scholar]
- (38).Luk HL; Melaccio F; Rinaldi S; Gozem S; Olivucci M. Molecular bases for the selection of the chromophore of animal rhodopsins. Proc. Natl. Acad. Sci. U. S. A 2015, 112, 15297–15302. [DOI] [PMC free article] [PubMed] [Google Scholar]
- (39).Marín M; Carmen D; Agathangelou D; Orozco-Gonzalez Y; Valentini A; Kato Y; Abe-Yoshizumi R; Kandori H; Choi A; Jung K-H; Haacke S; Olivucci M. Fluorescence Enhancement of a Microbial Rhodopsin via Electronic Reprogramming. J. Am. Chem. Soc 2019, 141, 262–271. [DOI] [PMC free article] [PubMed] [Google Scholar]
- (40).Garavelli M; Celani P; Bernardi F; Robb MA; Olivucci M. The C5H6NH2+ Protonated Shiff Base: An ab Initio Minimal Model for Retinal Photoisomerization. J. Am. Chem. Soc 1997, 119, 6891–6901. [Google Scholar]
Associated Data
This section collects any data citations, data availability statements, or supplementary materials included in this article.


