Abstract
In several areas of the central nervous system (CNS) neurons are regionally organized into groups or layers that carry out specific activities. In this form of patterning, neurons of distinct types localize their cell bodies to just one or a few of the layers within a structure. However, little is known about whether diverse neuron types within a lamina share molecular features that coordinate their organization. To begin to identify such candidates, we used the laminated murine retina to screen 92 lacZ reporter lines available through the Knockout Mouse Project. Thirty-two of these displayed reporter expression in restricted subsets of inner retina neurons. We then identified the spatiotemporal expression patterns of these genes at key developmental stages. This uncovered several that were heavily enriched in development but reduced in adulthood, including the transcriptional regulator Hmga1. An additional set of genes displayed maturation associated laminar enrichment. Among these, we identified Bbox1 as a novel gene that specifically labels all neurons in the ganglion cell layer but is largely excluded from otherwise molecularly similar neurons in the inner retina. Finally, we established Dbn1 as a new marker enriched in amacrines and Fmnl3 as a marker for subsets of αRGCs. Together, these data provide a spatiotemporal map for laminae-specific molecules and suggest that diverse neuron types within a lamina share coordinating molecular features that may inform their fate or function.
Keywords: retina, lamination, development, neuron, ganglion cells, AB_941660, AB_673441, AB_10000340, AB_207975, AB_2314191, AB_2126324, AB_2194992, AB_477483, AB_2564642, AB_90755, AB_2619825, AB_11139631, AB_10675963, AB_11153790, AB_11032833
1: INTRODUCTION
Central nervous system (CNS) patterning is derived from developmental and functional coordination. One organizational pattern that arises is lamination. In this type of arrangement, neurons and synapses form layers that are comprised of distinct numbers and types of cells whose molecular profiles and connectivity patterns establish functional circuits. Within these arrays, both cellular and subtype-specific patterning occurs where one general neuron type may be restricted to a layer or layers. In addition, a given subtype may be further confined to a specific stratum within a layer. Laminar specificity is common, occurring in diverse areas of the brain that range from the olfactory bulb to the cerebellum (Nagayama, Homma, & Imamura, 2014). Yet, the molecular causes and attributes of lamina-specific development remain largely unknown. One possibility is that cellular laminae are a by-product of developmental processes that establish wiring specificity. Alternately, laminae may represent fundamental units of molecular organization that result from clustering of cells with similar molecular profiles.
To discover candidate molecular components that correspond with these processes, we sought to identify differentially expressed genes among distinct neural laminae over time. To accomplish this goal, we used the highly laminated murine retina. The retina is comprised of three cellular and two synaptic layers, each of which contains cell bodies or synapses arising from mapped neural and glial subsets. The neuron subsets consist of six major classes: rods, cones, bipolar, horizontal, amacrine, and retinal ganglion cells (Masland, 2012). In turn, these neuron groups contain extensive subtype variability (~100, Sanes & Zipursky, 2010), and each subtype resides in neatly organized laminae (Masland, 2001b). The outer nuclear layer (ONL) is comprised of rods and a single layer of cones, the inner nuclear layer (INL) is comprised of horizontal cells, bipolar cells, Müller glia, and amacrine cells. The ganglion cell layer (GCL) is thus named for the retinal ganglion cells that reside there. Because nearly all major classes of neurons in the retina are restricted to one of these three cellular layers, major cell types can be identified simply based on their location within each lamina (Masland, 2012; Reese, 2011). However, there is one exception to this rule: while the majority of amacrine neurons reside in the INL, a puzzling subset (~10%, Kao & Sterling, 2006, Perez De Sevilla Muller, Shelley, & Weiler, 2007) migrate to the GCL where they persist into adulthood but are otherwise molecularly similar to their INL counterparts (Gustincich, Feigenspan, Wu, Koopman, & Raviola, 1997; Jeon, Strettoi, & Masland, 1998; Lin & Masland, 2006; Perez De Sevilla Muller et al., 2007). These cells, termed displaced amacrines, provide the opportunity to test whether distinct patterns of molecules map to layers rather than neuron types even when layers share neurons of different identities.
To explore this possibility, we set out to find genes whose expression is restricted to a specific lamina or sublamina in the inner retina where most retina neuron subtype diversity resides (~95%, MacNeil & Masland, 1998; Masland, 2001a; Sanes & Masland, 2015). We leveraged the resources of the Knockout Mouse Project (KOMP) to identify 32 candidates that show inner retina specific spatial distribution. We then mapped the gene expression dynamics for each candidate using fluorescent in situ hybridization and qRT-PCR over the course of development. This approach uncovered several candidates that show location-selective gene expression at different stages of maturation. Among these, we focused on four genes: Hmga1, Dbn1, Bbox1, and Fmnl3. Further analysis of these candidates suggests molecular conservation among different developmental stages, cell classes, and layers of inner retina neurons. In particular, Bbox1 was conserved in all GCL neurons and distinguished displaced amacrines from their siblings in the INL. In addition, we discovered Dbn1 as a unique amacrine enriched gene and showed that Fmnl3 is specific for subsets of αRGCs. Together, our data inform the spatiotemporal dynamics of gene expression within the developing and mature retina and provide a blueprint for developmentally segregated molecular signatures in distinct inner retina neuron populations.
2: MATERIALS AND METHODS
2.1: Animals
Mouse strains used in the selection of candidate genes were generated by the Baylor College of Medicine KOMP2 center using embryonic stem cells from the International Knockout Mouse Consortium on a C57BL/6N background. These mice were used at 16 weeks for staining of lacZ activity. C57BL/6N wildtype mice obtained from the Jackson Laboratory (Bar Harbor, Maine) were used for in situ hybridization, qRT-PCR, and histological analysis at multiple ages (E16, P2, P14, and 14 weeks). Both sexes were equally represented in all experiments, and no animals were excluded. Experiments were carried out in accordance with the recommendations in the Guide for the Care and Use of Laboratory Animals of the NIH under protocols approved by the BCM Institutional Animal Care and Use Committee (IACUC).
2.2: LacZ staining
Retina cryosections (20 μm thick) were fixed with 4% paraformaldehyde/PBS (5 min), washed in PBS, and incubated in lacZ reaction buffer consisting of 2 mM MgCl2*6H2O, 0.01% deoxycholic acid, 0.02% IGEPAL CA-630, 5mM K4Fe(CN)6*3H2O, 5mM K3Fe(CN)6, 0.1% (1 mg/mL) X-Gal in dimethylformamide(DMF), and cold PBS (pH 8) at 37°C for 48 h. Samples were then washed in PBS, post-fixed in 4% PFA (10 min), washed again, and then counterstained with Nuclear Fast Red. Samples were dehydrated in a graded ethanol series, cleared in xylene three times, and mounted in Cytoseal XYL.
2.3: Tissue preparation and immunohistochemistry
After fixation for 45 min with 4% paraformaldehyde/PBS and cryoprotection in 30% sucrose, eyes were embedded in tissue freezing medium and sectioned at 20 μm with a cryostat. Samples were then incubated in blocking solution (3% normal donkey serum and 0.3% Triton X-100 in PBS) at room temperature for 1 h. Blocking was followed by incubation in primary antibodies overnight at 4°C and secondary antibodies for 1 h at room temperature. For whole-mount staining, the fixed retina was removed and then incubated in blocking solution (10% normal donkey serum and 0.5% Triton X-100 in PBS), followed by incubation in primary antibodies for three days and secondary antibodies for two days at 4°C. Washes with PBS followed each antibody incubation. All samples were mounted in Vectashield.
2.4: Antibody characterization
The primary antibodies used in the present study are well characterized markers in mouse retina (see Table 1).
Table 1.
List of primary antibodies
| Antigen | Labeling specificity | Dilution |
|---|---|---|
| Brn3a | Brn3a ganglion cells | 1:500 |
| Brn3bc | Brn3bc ganglion cells | 1:500 |
| Calbindin | Horizontal cells, subsets of amacrine cells, and retinal ganglion cells | 1:5000 |
| Choline acetyltransferase (ChAT) | ChAT amacrine cells | 1:400 |
| Chx10 | Retinal progenitor cell (E9.5 – P4); bipolar cells in late development and adults | 1:300 |
| Islet1 | ON bipolar cells; starburst amacrine cells; subset of ganglion cells | 1:8000 |
| Osteopontin (OPN) | Subset of retinal ganglion cells | 1:1000 |
| RBPMS | All retinal ganglion cells | 1:250 |
| Syntaxin-1 | All amacrine cells; horizontal cells | 1:500 |
| SMI-32 | Subset of retinal ganglion cells | 1:1000 |
| Tyrosine Hydroxylase (TH) | Dopaminergic amacrine cell subset | 1:2000 |
| Vglut3 | VGlut3 amacrine cells | 1:2000 |
| Hmga1 | Inner retina neurons | 1:250 |
| Drebrin (DBN1) | Amacrine cells | 1:500 |
| Bbox1 | Ganglion cells and displaced amacrine cells | 1:500 |
| Fmnl3 | Subset of ganglion cells | 1:250 |
Brn3a antibody.
A mouse monoclonal antibody (EMD Millipore, Cat# MAB1585, RRID: AB_94166) was raised against amino acids 186–224 of Brn3a fused to the T7 gene 10 protein (Xiang et al., 1995). This antibody specifically recognizes Brn3a and shows no reactivity in Brn3a knockout mice (manufacturer’s data sheet). The Brn3a antibody immunostains Brn3a ganglion cells in the mouse and rat retina (Liu et al., 2009).
Brn3bc antibody.
This goat polyclonal antibody (Santa Cruz Biotechnology, Cat# sc-6026, RRID: AB_673441) was raised against the C-terminus of human Brn3b/c and specifically recognizes three bands on immunoblot corresponding to Brn3 family members (manufacturer’s data sheet). This antibody is typically used as a Brn3b/c retinal ganglion cell-specific marker (Elshatory, Deng, Xie, & Gan, 2007a; Wagner et al., 2002).
Calbindin antibody.
This rabbit polyclonal anti-Calbindin D-28K antibody (Swant, Cat# CB38a, RRID: AB_10000340) recognizes a 27–28 kDa band in immunoblot on brain homogenate of various species including zebrafish, chicken, mouse, rat, guinea pig, and rabbit (manufacturer’s data sheet). This antibody labels horizontal cells across species and subsets of other retinal cell types (amacrine, bipolar, and ganglion cells) in mouse (Haverkamp & Wassle, 2000).
Choline acetyltransferase (ChAT) antibody.
This goat polyclonal antibody (EMD Millipore, Cat# AB144P, RRID: AB_207975) was raised against human placental ChAT. This antibody immunostains somata and the processes of cholinergic or starburst amacrine cells in strata two and four of the IPL in mouse and rat retina (Voigt, 1986; Haverkamp, Inta, Monyer, & Wassle, 2009; Jeon et al., 1998; Whitney, Keeley, Raven, & Reese, 2008).
Chx10 antibody.
This sheep polyclonal antibody (Exalpha, Cat# X1180P, RRID: AB_2314191) was raised against the N-terminus of the human Chx10 protein conjugated to KLH. This antibody labels retinal progenitor cells during early retinogenesis but immunostains only bipolar cells in mice, rats, and chicken in late development and adulthood (Chen & Cepko, 2000; Kay, Voinescu, Chu, & Sanes, 2011; Liu et al., 1994).
Islet1 antibody.
This goat polyclonal antibody (R&D system, Cat# AF1837, RRID: AB_2126324) was raised against E. coli-derived recombinant human Islet1. It has been previously used to reveal a variety of neuronal populations in the mouse brain and in rat and mouse retina (Elshatory et al., 2007b).
Osteopontin (OPN) antibody.
A goat polyclonal antibody (R&D system, Cat# AF808, RRID: AB_2194992) was raised against mouse myeloma cell line NS0-derived osteopontin. This antibody immunostains a subset of retinal ganglion cells and is typically used as an endogenous marker of α-RGCs (Krieger, Qiao, Rousso, Sanes, & Meister, 2017; Duan et al., 2015).
RNA binding protein with multiple splicing (RBPMS) antibody.
This guinea pig polyclonal antibody (PhosphoSolutions, Cat# 1832‐RBPMS, RRID: AB 2395389) to RNA binding protein with multiple splicing (RBPMS) was generated against the N‐terminal region of rat RBPMS. This antibody was shown to exclusively stain ganglion cells in mouse and rat retina (Rodriguez, de Sevilla Muller, & Brecha, 2014).
Syntaxin1 antibody.
This mouse monoclonal antibody (Sigma‐Aldrich, Cat# S0664, RRID: AB_477483) was raised against a synaptosomal plasma membrane fraction from adult rat hippocampus (Barnstable, Hofstein, & Akagawa, 1985). Syntaxin-1 antibody immunostains amacrine and horizontal cell bodies and processes (Hirano, Brandstatter, & Brecha, 2005).
SMI-32 antibody.
This mouse monoclonal antibody (Biolegend, Cat# 801701, RRID: AB_2564642) is directed to a non-phosphorylated site on neurofilament H. This antibody has been shown to label the cell body and dendrites of a subset of pyramidal neurons and stains αRGCs in mouse retina (Campbell & Morrison, 1989; Bleckert, Schwartz, Turner, Rieke, & Wong, 2014).
Tyrosine Hydroxylase (TH) antibody.
This sheep polyclonal antibody (EMD Millipore, Cat# AB1542, RRID: AB_90755) against tyrosine hydroxylase (TH) was raised against purified tyrosine hydroxylase from rat pheochromocytomas. TH antibody immunostains dopaminergic amacrine cells in the mouse retina (Haycock & Waymire, 1982; Keeley et al., 2014; Masland, Rizzo, & Sandell, 1993; Versaux-Botteri, Nguyen-Legros, Vigny, & Raoux, 1984; Whitney, Raven, Ciobanu, Williams, & Reese, 2009).
Vglut3 antibody.
This rabbit polyclonal antibody (Synaptic Systems, Cat# 135204, RRID: AB_2619825) was raised against a mouse recombinant peptide and was validated in Vglut3 knockout mutants (Fasano et al., 2017).
Hmga1 antibody.
This rabbit monoclonal (Abcam, Cat# ab129153, RRID: AB_11139631) was raised against a synthetic peptide within the N terminal of Human HMGA1.
Drebrin (Dbn1) antibody.
This rabbit polyclonal (Abcam, Cat# ab60933, RRID: AB_10675963) was raised against a synthetic peptide derived from the C-terminus of human Drebrin conjugated to KLH. It was validated in Dbn1 knockout HAP1 cells (manufacturer’s data sheet).
Bbox1 antibody.
This rabbit polyclonal antibody (ThermoFisher, Cat# PA5–21477, RRID: AB_11153790) was raised against a recombinant fragment corresponding to a region within amino acids 1–293 of BBOX1 and shows reactivity with both human and mouse samples.
Fmnl3 antibody.
This rabbit polyclonal antibody (Novus, Cat# NBP1–8409, RRID: AB_11032833) was raised against recombinant protein corresponding to a region of FMNL3. Antibody specificity was verified on a protein array containing the target protein plus 383 other non-specific proteins (manufacturer’s data sheet).
2.5: Image acquisition
Fluorescent images were acquired on an Olympus FluoView FV1200 confocal microscope with Olympus 20X 0.85 NA and 60X 1.35 NA objectives. Whole-mount retinas were mounted and imaged with the ganglion cell layer side up. Images were subsequently processed using Fiji (Fiji, RRID:SCR_002285).
2.6: Fluorescent in situ hybridization
In situ hybridization was performed by the RNA In Situ Hybridization Core at BCM using an automated robotic platform as previously described (Yaylaoglu et al., 2005). In brief, total RNA was isolated from the mouse brains (E15, P7) using a RNeasy Mini Kit (Qiagen, Valencia, CA), and cDNA synthesis was performed using the Superscript IV First-Strand Synthesis System (Invitrogen, Carlsbad, CA). PCR primers shown in Table 2 were used to generate cDNA fragments corresponding to the desired riboprobes. Digoxigenin (DIG)-labeled riboprobes were synthesized using a DIG RNA labeling kit (Roche, Germany). Riboprobes were diluted in hybridization buffer (100 ng/μl) and stored at −20°C until use. For in situ hybridization, retinas were cryoprotected in 30% sucrose, frozen in OCT (VWR, Radnor, PA), and sectioned at 20 μm with a cryostat. Sections were fixed and acetylated before the hybridization procedure, which was performed on a high-throughput platform. The slides were developed for 15 min using tyramide labeled with Cy3 directly (TSA-Plus system; Perkin-Elmer Life Sciences, Waltham, MA) and then stained with DAPI before mounting in Prolong Diamond (Invitrogen, Carlsbad, CA).
Table 2.
Primer sequences for FISH probes
| Gene name | Sequence | Amplified fragment size | Accession number |
|---|---|---|---|
| Abca13 | GCGATTTAGGTGACACTATAGGCTATTTGGCACTATTTCCCAG | 421 bp | XM_48715 1.2 |
| GCGTAATACGACTCACTATAGGGGCATGCTGAAAACATCAGAGTC | |||
| Adsl | GCGATTTAGGTGACACTATAGGCTCAGCTGACCACGGTT | 954 bp | NM_00963 4.3 |
| GCGTAATACGACTCACTATAGGGCTGCTTTCACCGCCATCT | |||
| Anapc13 | GCGATTTAGGTGACACTATAGAAGCTGCAGGAGGATGGA | 269 bp | NM_18139 4.1 |
| GCGTAATACGACTCACTATAGGGTGAAAACTCCGTCCGTGG | |||
| Ap4e1 | GCGATTTAGGTGACACTATAGGAGGAACAGCTCTCTCAGGAAA | 637 bp | XM_48506 4.1 |
| GCGTAATACGACTCACTATAGGGTTCCTCCTGAACTTGTGAGACA | |||
| Aph1a | GCGATTTAGGTGACACTATAGGTGCCCTCCCGATCTCCT | 618 bp | NM_14610 4.1 |
| GCGTAATACGACTCACTATAGGGTTCCACCCTCAGCAGAAAA | |||
| Arhgap23 | GCGATTTAGGTGACACTATAGCTTCAACGAGTGGAAGGAGC | 515 bp | NM_02149 3.1 |
| GCGTAATACGACTCACTATAGGGCTGTATGAAACTTGGGCGGT | |||
| Bbox1 | GCGATTTAGGTGACACTATAGGTGGATGGGGCTCATTTG | 843 bp | NM_13045 2.1 |
| GCGTAATACGACTCACTATAGGGTGAAGTTGACGCGAACCA | |||
| Camk1 | GCGATTTAGGTGACACTATAGGGCGGAAGACATTAGGGATATT | 359 bp | NM_13392 6.1 |
| GCGTAATACGACTCACTATAGGGAGGTACTTGACAGCATCCAGC | |||
| Chpt1 | GCGATTTAGGTGACACTATAGGGGTAAAGGCGCTAGGTGA | 467 bp | NM_13392 6.1 |
| GCGTAATACGACTCACTATAGGGACATCCCAACGAAAGAGCA | |||
| Cspg4 | GCGATTTAGGTGACACTATAGAGTACAGAGGGCACCTCACAAT | 708 bp | NM_13900 1.1 |
| GCGTAATACGACTCACTATAGGGGTTGCTCCTAGATTCTGTTCGG | |||
| Cyp7b1 | GCGATTTAGGTGACACTATAGCCTCGTGAACCACCCTTG | 930 bp | NM_00782 5.1 |
| GCGTAATACGACTCACTATAGGGCCAGGCAGACCAAGCTGT | |||
| Dbn1 | GCGATTTAGGTGACACTATAGTACCCCAAGCCTGGATGA | 851 bp | NM_01981 3.2 |
| GCGTAATACGACTCACTATAGGGGGCAGTCGCCGCTACTAA | |||
| Eml2 | GCGATTTAGGTGACACTATAGCAGGGCCTGTTCGAGAAA | 522 bp | XM_13321 7.5 |
| GCGTAATACGACTCACTATAGGGTGCTCCTGCTCCACACTG | |||
| Erc1 | GCGATTTAGGTGACACTATAGGTCCTTAAATGCTGCCTATGCT | 485 bp | NM_05320 4.1 |
| GCGTAATACGACTCACTATAGGGTTTTCCTCCTGTACAACTCGGT | |||
| Esyt2 | GCGATTTAGGTGACACTATAGGACTATAAACCAGCGGTTCCAG | 677 bp | mCT5922. 2.2 |
| GCGTAATACGACTCACTATAGGGCTCTGATCAAACACAGGGTTCA | |||
| Fgf3 | GCGATTTAGGTGACACTATAGTGCTGCTCAGCTTGCTGGAAC | 681 bp | NM_00800 7 |
| GCGTAATACGACTCACTATAGGGTTGGAGTGGCCCTGGTAGAC | |||
| Fmnl3 | GCGATTTAGGTGACACTATAGCCAATCGTGCCAAGAACC | 425 bp | NM_01171 1.1 |
| GCGTAATACGACTCACTATAGGGCTCGCTTGCTGCTGTTCA | |||
| Hmga1 | GCGATTTAGGTGACACTATAGTGGGACTGAGAAGCGAGG | 807 bp | NM_01666 0.1 |
| GCGTAATACGACTCACTATAGGGAAGTGGGTGGAGCCAACA | |||
| Kars | GCGATTTAGGTGACACTATAGGGCGTCTGAAAGCTGAGAA | 908 bp | BCM in house |
| GCGTAATACGACTCACTATAGGGAATCAATCCCTTCGTTCCG | |||
| Mmp15 | GCGATTTAGGTGACACTATAGCCTTTATTTATGCCCAGGTGCC | 1025 bp | NM_00860 9 |
| GCGTAATACGACTCACTATAGGGTCCGATCTGTCACCTCTAGTGC | |||
| Mogs | GCGATTTAGGTGACACTATAGGATTGGGCGAGAGCAGATT | 1035 bp | NM_02061 9 |
| GCGTAATACGACTCACTATAGGGAGACTGGTCCATCCTTGGAA | |||
| Phf24 | GCGATTTAGGTGACACTATAGTGGTCCCTAGTCTTCAAGTGGT | 872 bp | NM_17269 0.2 |
| GCGTAATACGACTCACTATAGGGATGTATCTCCTGCCTGCTTCAT | |||
| Ndufs7 | GCGATTTAGGTGACACTATAGCTCCTGGCCTGCTCTCTG | 681 bp | NM_02927 2.1 |
| GCGTAATACGACTCACTATAGGGTTATCGTGCTCAGCCTGG | |||
| Rad9a | GCGATTTAGGTGACACTATAGAGCACACCCCACTTAGATGACT | 605 bp | NM_01123 7.1 |
| GCGTAATACGACTCACTATAGGGTTTTAGAGGCAGGAGACTGAGG | |||
| Rnf38 | GCGATTTAGGTGACACTATAGTTTGGGTGTTCCTCATCACA | 699 bp | NM_17520 1.2 |
| GCGTAATACGACTCACTATAGGGGCTGCCTGAAGCAAAGGA | |||
| Rpl7l1 | GCGATTTAGGTGACACTATAGCAATTCTAGGCCCTCTGAGAAA | 283 bp | TC156482 7.1 |
| GCGTAATACGACTCACTATAGGGTGTCTGCCTTCATAGTGACACC | |||
| Rundc3a | GCGATTTAGGTGACACTATAGCTGCCCTCCAAGAAAGCA | 411 bp | NM_01675 9.1 |
| GCGTAATACGACTCACTATAGGGTTCGGTTGTCCCGAAGAG | |||
| S1pr3 | GCGATTTAGGTGACACTATAGGACCCTGTCCAGGACTATTCAG | 898 bp | BCM in house |
| GCGTAATACGACTCACTATAGGGTCATGCTACAAATGTCACCTCC | |||
| Sirpa | GCGATTTAGGTGACACTATAGAGCCCACATCACCTTGGA | 942 bp | NM_00754 7.1 |
| GCGTAATACGACTCACTATAGGGGCCTTCTGGGGACAGGAT | |||
| Taf6 | GCGATTTAGGTGACACTATAGGTCTTGGATGGGCCTGTG | 822 bp | NM_00931 5.1 |
| GCGTAATACGACTCACTATAGGGATCACAGAGCAGGCTGGG | |||
| Tbccd1 | GCGATTTAGGTGACACTATAGTGGAATGACTACAGTCACCAGG | 951 bp | XM_14844 1.4 |
| GCGTAATACGACTCACTATAGGGGTATCTCTGCTGTGTCCCCTTC | |||
| Zfpl1 | GCGATTTAGGTGACACTATAGGTGCCCCAAGAGGAAGGT | 929 bp | NM_02423 1.1 |
| GCGTAATACGACTCACTATAGGGCAAGCAAGGGCTCAGGAA |
2.7: Reverse Transcription qPCR
Retinas were dissected from C57BL/6N mice (E16, P2, P14, and 14 weeks) in nuclease-free water, and each pair of retinas were separately homogenized. Total RNA was purified from each sample using a commercial kit according to the manufacturer’s instructions (RNeasy Plus Mini Kit; Qiagen, Valencia, CA). Reverse transcription was performed using a complementary DNA synthesis kit according to the manufacturer’s protocol (iScript Reverse Transcription Supermix for qRT-PCR; Bio-Rad Laboratories Inc., Temecula, CA). qRT-PCR was conducted with primers to candidate and house-keeping genes (for primers, see Table 3) using iTaq Universal SYBR Green Supermix (Bio-Rad Laboratories Inc.) and a CFX384 Touch Real-Time PCR Detection System (Bio-Rad Laboratories Inc.). Expression differences were calculated using the ΔΔCt method (Livak & Schmittgen, 2001).
Table 3.
Primer sequences for RT-qPCR
| Gene name | Sequence | Amplified fragment size | Accession number |
|---|---|---|---|
| Abca13 | AGAACTGGATTTGCAGACTCCG | 63 bp | NM_178259 |
| TACACGGCCAGAAGAACTCAG | |||
| Adsl | AGCCGCGAGATGTGTTTCTT | 152 bp | NM_009634 |
| TCAATGTTGTTCAGGTTCGACTT | |||
| Anapc13 | TGAGGTACAGCGAGATGGAAG | 102 bp | NM_181394 |
| GGAAGCTCACTCAGTGGAATG | |||
| Ap4e1 | GGAACTGAGTAGTCTGAAGGCA | 118 bp | NM_175550 |
| ACCAAAAGAAGCATCGTATCCAA | |||
| Aph1a | TGCTGTGTTTTTCGGATGCAC | 183 bp | NM_146104 |
| TCTGATCGGTCTGTCACATGG | |||
| Arhgap23 | TGGAGGATGTGACTACCCACC | 113 bp | NM_021493 |
| CCGGCTCAGGTAATCGTCTG | |||
| Bbox1 | ATGGGGCTCATTTGATGCAGA | 126 bp | NM_130452 |
| GAAGTTTCCGAGCTTTTGCAG | |||
| Camk1 | AAGCAGGCGGAAGACATTAGG | 104 bp | NM_133926 |
| AGTTTCTGAGTCCTCTTGTCCT | |||
| Chpt1 | ATGTGCCCTGGGACTCTTTAT | 293 bp | BC031435 |
| CACCAGCCCGGAAGAAAACTT | |||
| Cspg4 | ACCATGCTACTCCGCAACAG | 78 bp | NM_139001 |
| CCGGTGAACATCTATGTGTACG | |||
| Cyp7b1 | AACACCATTCCAGCTATGTTCTG | 190 bp | NM_007825 |
| CCTCAAGAATAGTGCTTTCCAGG | |||
| Dbn1 | TTTCCGGCCACTTCGAGAAC | 66 bp | NM_001177372 |
| CAGCTTGGGAGTCCTTGACG | |||
| Eml2 | ACAACGACACTACCTGGGG | 149 bp | NM_028153 |
| GGGAAACCGAGTCCCACAC | |||
| Erc1 | GTGCTCGATCAGTAGGGAAGG | 89 bp | NM_053204 |
| CCGATGACCTAAGCGAGGG | |||
| Esyt2 | ATGTCAGTCGGTCACAAGGC | 133 bp | NM_028731 |
| GCTCATCTTTAACCTCAACCTCA | |||
| Fgf3 | TGCGCTACCAAGTACCACC | 102 bp | NM_008007 |
| CACTTCCACCGCAGTAATCTC | |||
| Fmnl3 | CAGCAAGGTGACCCTTTTGGA | 135 bp | NM_011711.1 |
| ACGAAGTCTACAGGTAGTGTCTG | |||
| Hmga1 | GGTCGGGAGTCAGAAAGAGC | 76bp | NM_016660 |
| ATTCTTGCTTCCCTTTGGTCG | |||
| Kars | TGGCGAGCAGAAACTAAGCAA | 257bp | NM_053092 |
| GGAACTTGTGTGGGTACGGA | |||
| Mmp15 | GCTGACATCATGGTACTCTTTGC | 241 bp | NM_008609 |
| CGCTGGGGTTACTTGAGTGT | |||
| Mogs | GTGACCGTAGAGCCTCAGG | 92 bp | NM_020619 |
| AGTAGGACCTCTTGCCCATCT | |||
| Phf24 | GACAGGACCAGCCGATTCAC | 196 bp | NM_172690 |
| GGCAACCATCGTGGAAAACC | |||
| Ndufs7 | GTTCATCAGAGTGTAGCCACTG | 213 bp | NM_029272 |
| CAGGCCGAAGGTCATAGGC | |||
| Rad9a | GGCTGTCCATTCGCTATCCC | 122 bp | NM_011237 |
| GTGGGGCAAAAAGGAAGCAG | |||
| Rnf38 | CTACACGGTAACTACGGTGGC | 120 bp | NM_175201 |
| GGGAGGTGTTGTCCACTGAAA | |||
| Rpl7l1 | GCACGGTGGAGCCTTATGT | 115 bp | NM_025433 |
| TTGTCCGTCAGAGGGACTGT | |||
| Rundc3a | CTCACCACATCCCTAGTCAACC | 205 bp | NM_001252347 |
| GTTCTGAGCTTCCGATGGGG | |||
| S1pr3 | ACTCTCCGGGAACATTACGAT | 120 bp | NM_010101 |
| CAAGACGATGAAGCTACAGGTG | |||
| Sirpa | CCACGGGGAAGGAACTGAAG | 175 bp | NM_001177647 |
| ACGTATTCTCCTGCGAAACTGTA | |||
| Taf6 | AAACTCAGCAATACTGTGTTGCC | 173 bp | NM_009315 |
| TTCTGTCGTTTCCCCATGTGC | |||
| Tbccd1 | ACCTCCGTCCAAATTCAGCC | 102 bp | NM_001081368 |
| CAGGTAGGCCAGTACAGGTG | |||
| Zfpl1 | GAGGAAGGTGACGAACCTGTT | 109 bp | NM_024231 |
| TAGCCACTGCAAGTAGGACTG |
2.8: Quantification of ganglion cell soma density
Confocal images were acquired of RBPMS- and Fmnl3-immunopositive somata from the central region of whole-mount retinas. Three fields (172.64 μm × 172.64 μm) were sampled per retina from at least three independent animals. Cell density (cells/mm2) was determined manually using the Fiji cell counter tool.
2.9: Quantification of co-expression
For quantification, images were collected from 3 animals per group with at least 3 image stacks per animal. Images were acquired at equivalent eccentricities from the optic nerve head. To quantify Hmga1 co-labeling with neuron development, we used Chx10, which labels all cycling progenitor cells in early retinogenesis and becomes restricted to bipolar cells in adults, and Islet1, which labels subsets of fate committed neurons in early development. To quantify Hmga1 colocalization in adult neuron subtypes we used antibodies that mark each cell type. Bipolars, amacrines, horizontal cells, and retinal ganglion cells were labeled with antibodies to Chx10, Syntaxin1, Calbindin, and RBPMS, respectively. Photoreceptors were quantified as the total number of DAPI positive cells in the ONL. The total number of positively stained soma for each neuron type was determined in a standardized 211μm x 211μm area. For E16 and P2, somas were quantified in 3 merged images generated from 5–7 optical sections. For P14 and 14 weeks, somas were quantified in 5–10 non-successive optical sections per image stack. To quantify Fmnl3 co-labeling we used antibodies that mark RGC types, including Brn3a, Brn3b/c, SMI-32, and OPN. The total number of positively stained soma for each neuron type was determined in a standardized 211μm x 211μm area from merged images generated from the entire image stack.
2.10: Computational analysis of spatiotemporal expression using heatmaps
In situ and lacZ heatmaps were generated based on the percent area of the signal covered per retinal layer. To achieve this, retinal layers were first manually defined using the corresponding DAPI image and region boundaries were recorded. For P14 and 14-week-old retinas the boundaries of the ONL, OPL, INL, IPL, and GCL were marked. For E16 and P2 the ONBL was divided into equal sublayers to allow for more spatial definition of the expression patterns. To compute the level of in situ and lacZ staining in each of these regions, we developed a Fiji macro that converted the images into to an 8-bit binary image and computed the relative levels of the signal. For lacZ images, a minimum background subtraction (r=2) and Gaussian Blur (sigma=5) were applied to remove background noise before conversion. The percentage of each retinal layer occupied by the signal was then calculated using the measure tool in Fiji. Values were hierarchically clustered by Euclidean distance and the Ward error sum of squares hierarchical clustering method in R (RStudio, RRID:SCR_000432) (Murtagh & Legendre, 2014). The data were graphed using Prism 8 (GraphPad Prism, RRID:SCR_002798).
3. RESULTS
3.1: Identification of layer-selective genes
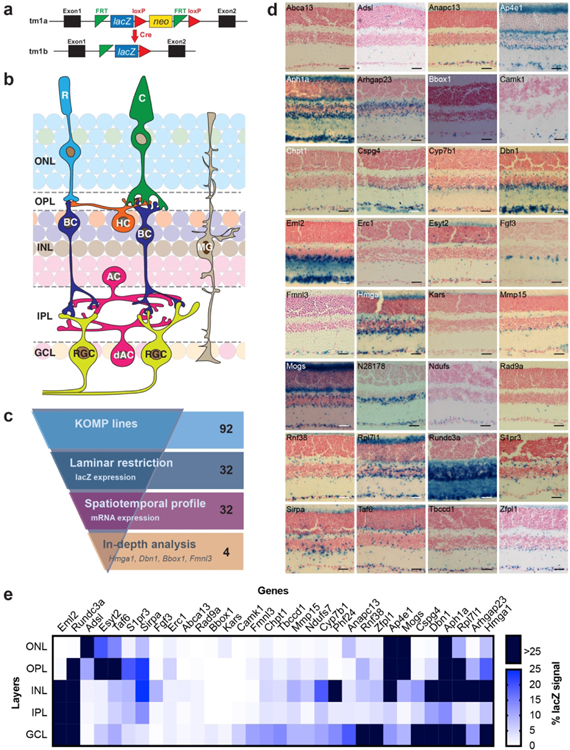
To identify laminar selective genes, we employed the animal resources available through the Baylor College of Medicine Knockout Mouse Phenotyping Project (BCM KOMP2). These lines were generated using a targeted knock-in of a lacZ cassette and thus report on the endogenous location and levels of each gene (Fig. 1a). We combined this resource with the organizational advantages offered by the murine retina. Due to the laminar targeting of distinct neuron types in this system (Fig. 1b), neuron-specific gene expression can be inferred directly from laminar staining. To begin, we obtained adult retinas from 92 BCM KOMP2 center lines (Albrecht et al., 2018) and stained them for lacZ. We then identified those that displayed differential expression between laminae or between neurons within a lamina (Fig. 1c and d). We reasoned that these genes may represent shared molecular pathways among neuron subtypes within these regions. Thirty-two lines displayed lacZ staining that was restricted to one or more retinal laminae (Fig. 1d, e and Table 4). These included lines that displayed expression in at least three layers (10/32; e.g. Hmga1) as well as others whose expression appeared more confined to two or fewer laminae (15/32, e.g. Dbn1). In addition, this set included several genes with staining patterns consistent with neural subset labeling (7/32, e.g. Fmnl3).
Figure 1. Identification of layer-selective genes.
a. KOMP allele structure containing the lacZ reporter gene. b. Schematic of the retina. Rod (cyan) and cone (green) photoreceptors reside in the outer nuclear layer (ONL) and synapse onto interneurons in the outer plexiform layer (OPL). The inner nuclear layer (INL) is comprised of Müller glia (MG, brown), horizontal cells (HCs, orange), amacrines (ACs, pink), and bipolar cells (BCs, blue). The latter two synapse onto retinal ganglion cells (RGCs, yellow) in the inner plexiform layer (IPL) whose soma reside in the ganglion cell layer (GCL) along with displaced amacrine cells (dACs, pink). c. Laminar restricted candidate identification. Ninety-two KOMP lines were assayed for lacZ gene expression patterns that displayed restriction to one or more retinal lamina. Thirty-two lines met these criteria and were examined by in situ based spatiotemporal profiling to identify gene subsets enriched at distinct developmental phases. Among these, 4 genes were selected for in depth analysis based on their unique spatiotemporal profiles. d. Retinal images from 16-week-old animals are shown of the selected 32 candidate genes following staining for lacZ to visualize reporter expression. Scale bar = 50 μm. e. Quantification of lacZ expression patterns in the 32 laminar restricted candidates across distinct sub-regions of the retina in 16-week-old mice. LacZ expression is represented as the percentage of each retinal layer occupied by the signal using a gradient scale where white to blue depicts low to high levels of enrichment (0%–25%, respectively), and dark blue indicates enrichment levels higher than 25%. The genes are ordered using Euclidian distance and squared ward clustering.
Table 4.
Expression summary of the 32 candidates
| Gene name | LacZ expression | FISH expression | ||||
|---|---|---|---|---|---|---|
| Multiple laminas | Sublamina | Cell subset | Early enrichment | Mid enrichment | Late enrichment | |
| Abca13 | × | × | ||||
| Adsl | × | × | ||||
| Anapc13 | × | × | ||||
| Ap4e1 | × | × | ||||
| Aph1a | × | × | ||||
| Arhgap23 | × | × | ||||
| Bbox1 | × | × | ||||
| Camk1 | × | × | ||||
| Chpt1 | × | |||||
| Cspg4 | × | × | ||||
| Cyp7b1 | × | × | ||||
| Dbn1 | × | × | ||||
| Eml2 | × | × | ||||
| Erc1 | × | × | ||||
| Esyt2 | × | × | ||||
| Fgf3 | × | × | ||||
| Fmnl3 | × | × | ||||
| Hmga1 | × | × | ||||
| Kars | × | × | ||||
| Mmp15 | × | × | ||||
| Mogs | × | × | ||||
| Phf24 | × | × | ||||
| Ndufs7 | × | × | ||||
| Rad9a | × | × | ||||
| Rnf38 | × | × | ||||
| Rpl7l1 | × | × | ||||
| Rundc3a | × | × | ||||
| S1pr3 | × | × | ||||
| Sirpa | × | × | ||||
| Taf6 | × | × | ||||
| Tbccd1 | × | × | ||||
| Zfpl1 | × | × | ||||
3.2: Temporal profiling of candidate genes
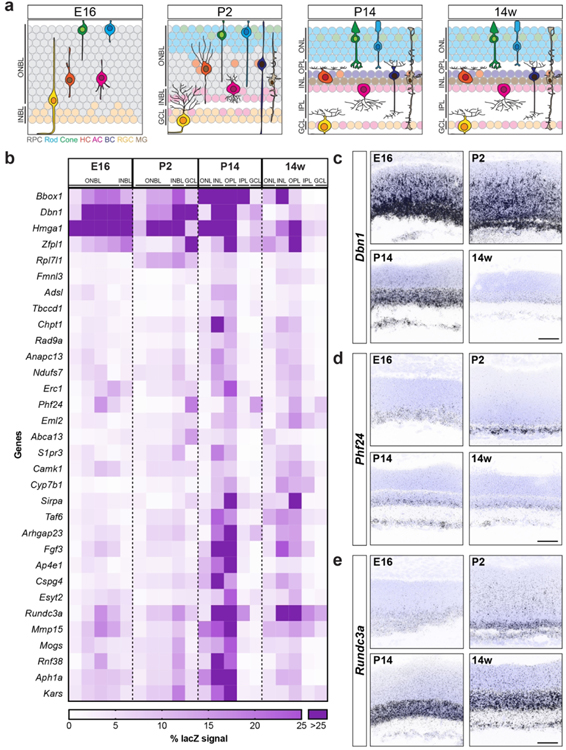
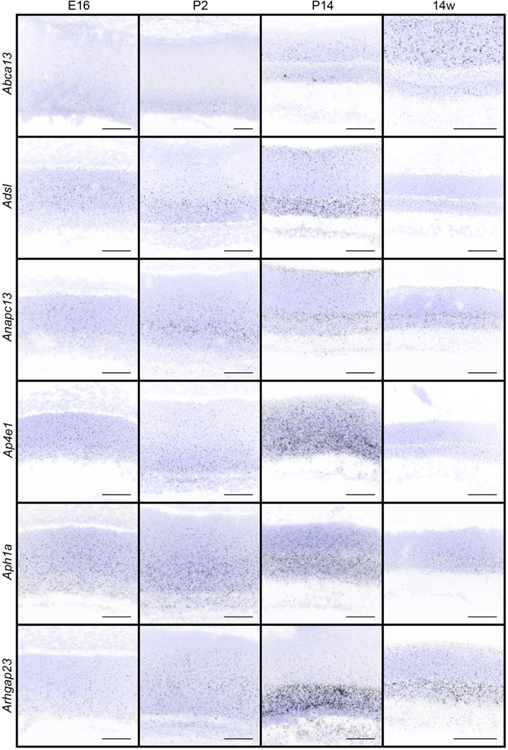
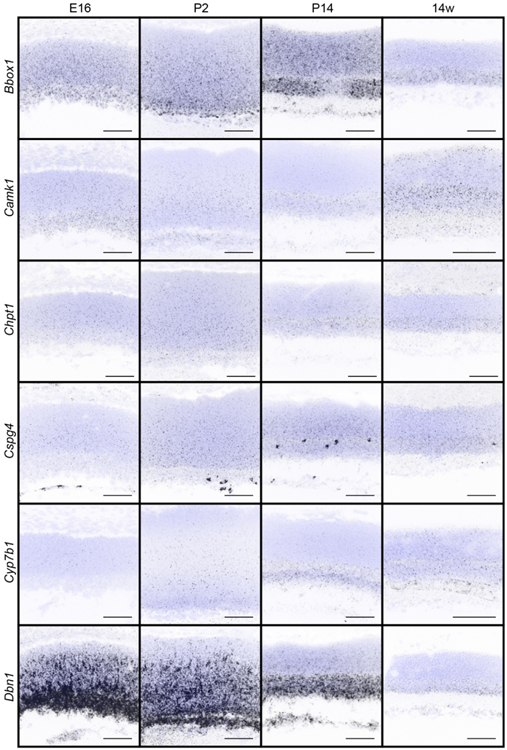
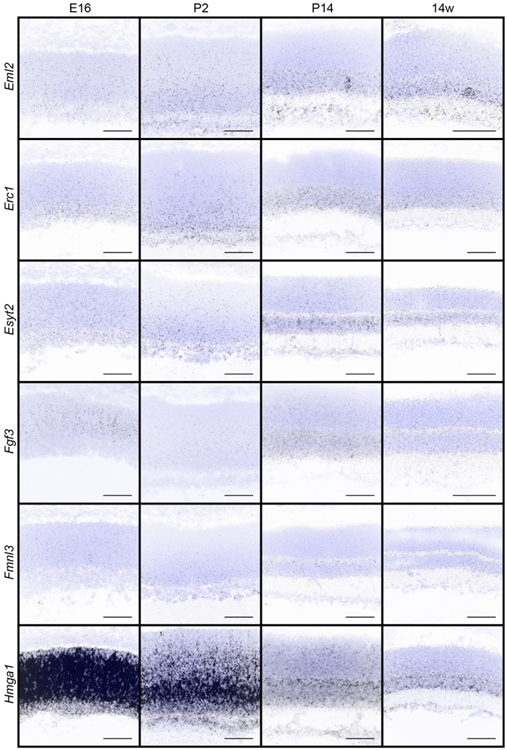
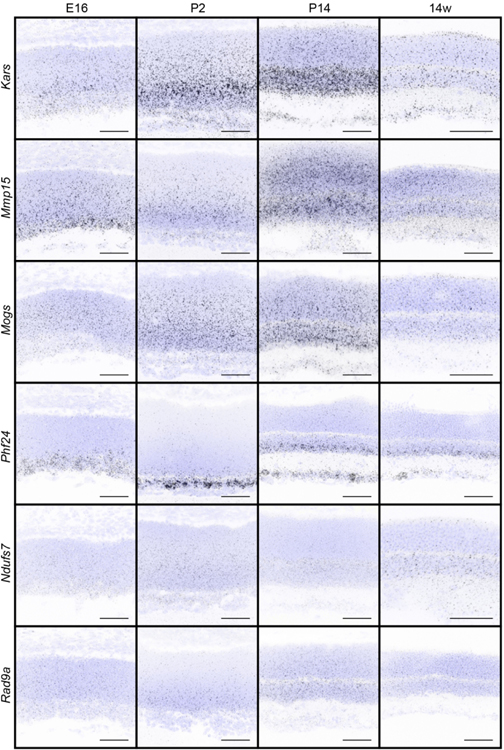
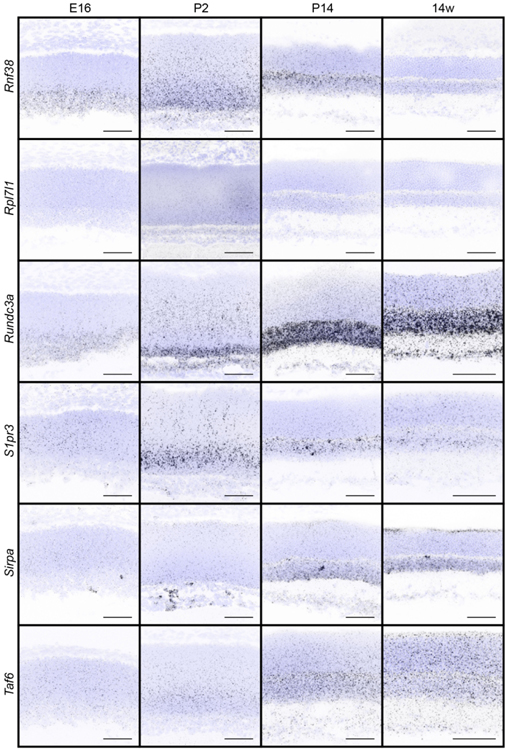
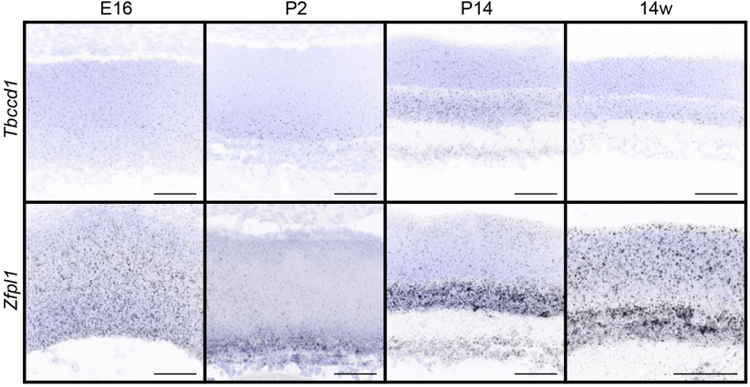
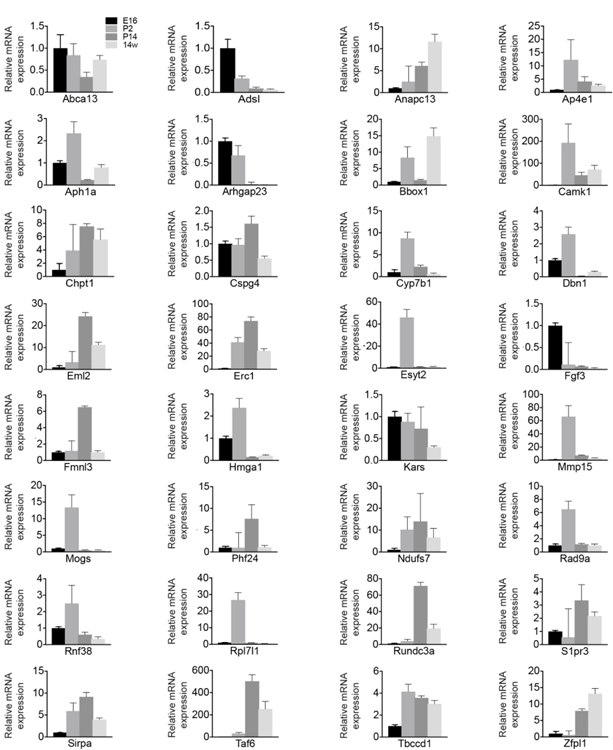
We next sought to examine the timing and specificity with which these gene expression patterns emerged to identify candidates that may show differential temporal and spatial restriction. To achieve this, we performed fluorescent in situ hybridization for all 32 genes in wildtype animals as the retina developed. We focused our analysis on key inner retina neuron maturation time points: embryonic day (E)16 when retinal progenitor cells (RPCs) are giving rise to inner retina neurons, postnatal day (P)2 when early histogenesis is complete, and P14 when inner retina neural circuits are beginning to mature (Fig. 2a). We computationally measured and compared these in situ profiles at embryonic (E16), developmental (P2 and P14), and adult (14 weeks) ages to determine how expression varies across time (Fig. 2b-e). The candidates showed a range of unique spatiotemporal patterns that varied in cell specificity, gene expression level, timing, and localization (Fig. 2b-e, Fig. 3, and Table 4). Several candidates were enriched at early time points (E16-P2, Fig. 2b and c). These included the high mobility group protein A member 1 (Hmga1, Bustin & Reeves, 1996; Gerlitz, Hock, Ueda, & Bustin, 2009; Zhang & Wang, 2010) and the actin binding protein Drebrin 1 (Dbn1, Hanamura, Kamata, Yamazaki, Kojima, & Shirao, 2018; Hayashi & Shirao, 1999; Shirao et al., 2017; Shirao, Kojima, & Obata, 1992). Others were at their highest levels in developing fate committed neurons (P2-P14, Fig. 2b and d). Among these were the sphingosine-1-phosphate receptor 3 (S1pr3, Fang et al., 2018) and a Gαi-interacting protein (GINIP) PHD finger protein 24 (PHF24, Serikawa et al., 2019). Finally, another set became upregulated in mature inner retina neurons (P14–14 weeks, Fig. 2b and e). These included the vesicular transport protein encoding gene Ap4e1 (Abou Jamra et al., 2011; Dell’Angelica, Mullins, & Bonifacino, 1999; Hirst, Bright, Rous, & Robinson, 1999) and the RUN domain-containing protein 3A (Rundc3a, Janoueix-Lerosey, Pasheva, de Tand, Tavitian, & de Gunzburg, 1998). In parallel, we validated these patterns by performing qRT-PCR on all 32 genes across time (Fig. 4). The relative qRT-PCR quantified gene expression levels were comparable to the in situ hybridization patterns and intensity, suggesting that in situ is a reliable measure of gene expression levels and localization (Fig. 3 and Fig. 4). These data indicate that temporal profiling can reveal gene patterns consistent with the timing and localization of sequential neuron maturation. Below, we identified a subset of these lines for which validated antibodies are available in order to showcase representative genes in each category and describe their cell-type specificity.
Figure 2. Spatiotemporal profiling of candidate genes.
a. Schematic of retina development from E16 to 14 weeks. At E16 the outer neuroblast layer (ONBL) contains cycling retinal progenitor cells (RPC, gray) that give rise to newly born inner retina neurons [blue, rods; green, cones; orange, horizontal cells (HC); pink, amacrine cells (AC); yellow, retinal ganglion cells (RGC); brown, Müller glia (MG)]. Early histogenesis is largely complete by P2, and the nascent inner neuroblast layer (INBL) and ganglion cell layer (GCL) begin to emerge. Inner retina neurons and their synapses mature over the next two weeks, leading to the emergence and refinement of retinal lamina (ONL, outer nuclear layer; OPL, outer plexiform layer; INL, inner nuclear layer; IPL, inner plexiform layer, and the GCL). These layers are maintained throughout adulthood. b. Quantification of in situ expression patterns of 32 candidate genes at key retina maturation stages (E16, P2, P14, and 14 weeks). Data are presented as a heatmap indicating the percentage of each retinal layer occupied by the signal using a gradient scale where white to purple depicts low to high levels of enrichment (0%–25%, respectively), and dark purple indicates enrichment levels higher than 25%. The genes are ordered using Euclidian distance and squared ward clustering. c-e. Representative fluorescent in situ hybridization images of exemplar genes that show distinct spatiotemporal expression patterns across retina development (E16, P2, P14, and 14 weeks) in wildtype mice. Dbn1 (c) is highly enriched during early development (E16-P2) and becomes lower as the retina matures, and the expression of Phf24 (d) peaks at P2 but is lower in adulthood. In contrast, Rundc3a (e) is present at low levels during early development but becomes enriched as the retina matures. Blue, DAPI; black, in situ signal. Scale bar = 50 μm.
Figure 3. In situ hybridization patterns of the 32 candidates over retina development.
The presence and localization of the 32 candidate genes were assayed in the retina in wildtype animals at E16, P2, P14, and 14 weeks by fluorescent in situ hybridization. Blue, DAPI; black, in situ signal. Scale bars = 50 μm.
Figure 4. qRT-PCR for the 32 lamina-restricted candidate genes over retina development.
Retinas were collected from wildtype mice at different embryonic and developmental ages (E16, P2, P14, 14 weeks) and analyzed for the levels of mRNA of the 32 candidates by qRT-PCR. Values represent the fold mRNA expression level relative to the levels detected at E16 for each gene following normalization to GAPDH. Data are represented as the mean ± SEM.
3.3: Hmga1 expression correlates with inner retina maturation
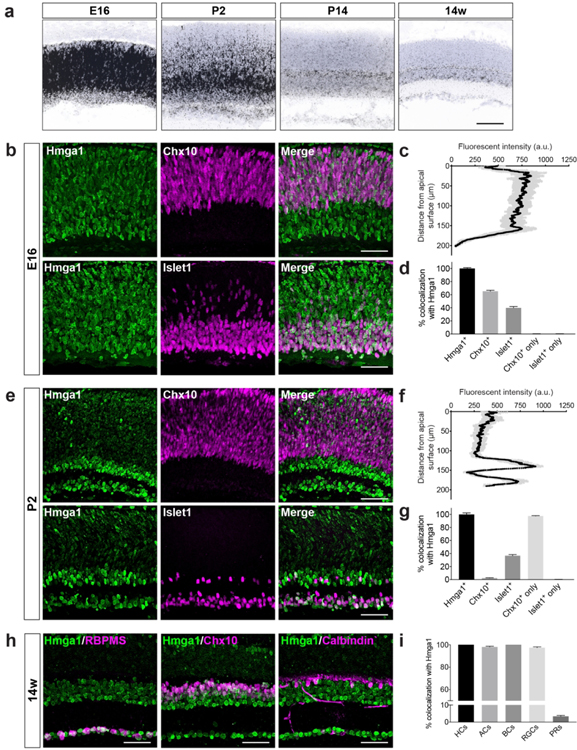
In the developing retina, RPCs divide in the ventricular zone, a region of proliferating cells that occupies the outer half of the retina. As fate committed inner retina neurons emerge, they migrate away from the ventricular zone toward their final destination in the inner retina and begin to differentiate (Marquardt & Gruss, 2002; Reese, 2011). Thus, in development, undifferentiated progenitors can be distinguished from fate specified cells based on their location along the apical-basal axis (Agathocleous & Harris, 2009). To further explore genes that were enriched in progenitor cells and newly born neurons, we focused on Hmga1. It was a good candidate because Hmga1 homozygous knockouts are subviable (www.impc.org), suggesting this is a developmentally vital gene. Hmga1 was most highly expressed at E16. It remained present during early postnatal development and became specific for neurons in the inner retina beginning at P2 (Fig. 5a). To further examine this restriction, we performed co-staining with an Hmga1 antibody and markers of neural development. We used Chx10, which labels all cycling RPCs in early development (E9.5-P4) and becomes restricted to bipolar cells in adults, and Islet1, which labels subsets of fate committed neurons in development and adulthood. We found that at E16 Hmga1 is present in nearly all Chx10-positive RPCs in the outer retina and Islet1-positive neurons in the inner retina (Fig. 5b and c). Among the cells expressing Hmga1, 65%±1% are Chx10-positive and 40%±2% are Islet1-positive (Fig. 5d). At P2 when most neurons are postmitotic (Marquardt & Gruss, 2002; Rapaport, Wong, Wood, Yasumura, & LaVail, 2004), Hmga1 levels appeared highest in fate committed neurons in the inner retina (Fig. 5e-g). To confirm this time dependent laminar restriction, we stained, imaged, and quantified all major neuron types together with Hmga1 at 14 weeks (Fig. 5h). We found that Hmga1 was present in all major neuron types that reside in the inner retina as high levels of labeling were observed in horizontal cells (100%±0%), amacrines (98%±1%), bipolar cells (100%±0%), and retina ganglion cells (97%±2%), while sparse Hmga1 staining was observed in photoreceptors (3%±1%) (Fig. 5i). Together, these data suggest that a developmental program may be shared among classes of inner retina neurons in which Hmga1 could play a role.
Figure 5. Hmga1 expression correlates with inner retina maturation.
a. The presence and localization of Hmga1 were assayed in wildtype animals at E16, P2, P14, and 14 weeks via fluorescent in situ hybridization (blue, DAPI; black, in situ signal). b-d. Hmga1 is present throughout the inner neuroblast layer (INBL) in early retina development (b, quantified in c). It colocalizes with both cycling retinal progenitor cells (Chx10, magenta, upper panel) and fate committed neurons (Islet1, magenta, lower panel). Cellular colocalization of Chx10 and Islet1 with Hmga1 at E16 is quantified in d. e-g. At P2, Hmga1 becomes largely restricted to fate committed neurons in the inner retina (e, quantified in f). At this time, it is mostly excluded from cycling retinal progenitor cells (Chx10, magenta, upper panel) but present in fate committed neurons in the inner retina (Islet1, magenta, lower panel). Cellular colocalization of Chx10 and Islet1 with Hmga1 at P2 is quantified in g. h-i. In adults, Hmga1 is present primarily in inner retina neuron subsets. Cellular colocalization was visualized (h) and quantified (i) by co-staining for antibodies that label the major cell types of the retina (retinal ganglion cells, RBPMS; bipolar cells, Chx10; horizontal cells, Calbindin). n = 3 animals. Data are represented as the mean ± SEM. Scale bars = 50 μm.
3.4: Bbox1 is specifically enriched in the ganglion cell layer
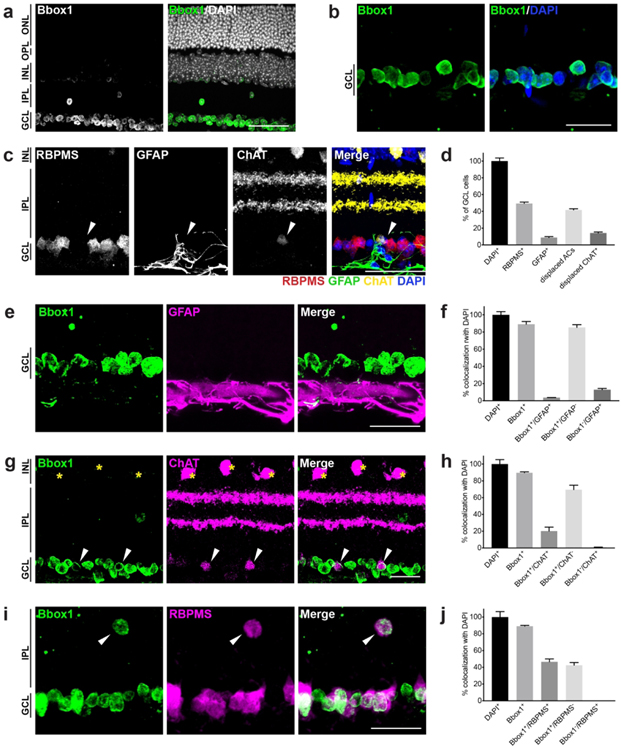
We next asked whether we could identify shared molecular features within subsets of inner retina neurons by identifying those that were restricted to the GCL. Since RNA expression appeared predictably broader in most cases than reporter protein expression (Fig. 1, 2, and 3), we selected candidates based on lacZ staining patterns. Calcium/calmodulin-dependent protein kinase I (Camk1), formin family member 3 (Fmnl3), and the L-carnitine biosynthetic enzyme (Bbox1) all appeared GCL-specific. Among these, we were able to obtain validated antibodies to Bbox1 and Fmnl3. While Fmnl3 labeled subsets of GCL neurons, Bbox1 appeared present within all adult GCL neurons and was largely restricted to this layer (Fig. 6a and b). To examine the distribution of Bbox1 more precisely, we first assessed the cellular composition of the GCL by staining with markers to the cell types known to reside there, ganglion cells, astrocytes, and displaced amacrines (Fig. 6c). We found that 49%±2% of DAPI-positive nuclei labeled for the pan-RGC marker RBPMS, while 9%±1% labeled for the astrocyte marker GFAP (Fig. 6d). The remainder of the DAPI-positive but RBPMS- and GFAP-negative nuclei are presumably displaced amacrines (42%±1%). Indeed, we found that ChAT, a marker for cholinergic amacrine cells, labels 14%±1% of GCL nuclei, consistent with previous reports (Perez De Sevilla Muller et al., 2007). We next assessed Bbox1 expression in these subsets. We found that Bbox1 universally and completely labeled all neurons within the GCL but was absent from astrocytes (Fig. 6e-j). Consistent with this idea, most GFAP-positive cells did not express Bbox1 (96%±0.1%, Fig. 6e and f ). In addition, we observed that ChAT-positive GCL amacrines were positive for Bbox1 (arrows) while ChAT-positive INL amacrines (asterisks) were negative for Bbox1 (Fig. 6g and h). Bbox1 was also rarely present in neurons within the INL (≤0.3% of INL cells, Fig. 6i and j). These cells co-labeled with RBPMS suggesting that they are displaced ganglion cells (Fig. 6i, arrows, Drager & Olsen, 1981; Pang & Wu, 2011). These data indicate that Bbox1 is a shared molecular feature of GCL neurons regardless of their specific subtype and that it effectively distinguishes INL and GCL amacrines.
Figure 6. Bbox1 labels the ganglion cell layer in adult retina.
a-b. Immunohistochemical images of Bbox1 (green) at lower (a) and higher (b) magnification in 14-week-old retina reveal that Bbox1 is exclusively localized to the ganglion cell layer (GCL). ONL, outer nuclear layer; OPL, outer plexiform layer; INL, inner nuclear layer; IPL, inner plexiform layer. c. Representative images showing the major cell classes residing in the adult GCL: RGCs (RBPMS), astrocytes (GFAP), and displaced starburst amacrines (ChAT; white arrows). d. Quantification of the major cell classes in the ganglion cell layer in adult 14-week-old retina (RBPMS, retinal ganglion cells; GFAP, astrocytes; ChAT, displaced amacrine cells). n = 3 animals. e-f. Representative images (e) and quantification (f) of Bbox1 (green) and astrocytes (magenta) colocalization in adult animals. Bbox1 shows very little overlap with astrocytes, which reside below GCL neurons. g-h. Representative images (g) and quantification (h) of Bbox1 (green) and ChAT amacrine co-staining in adult retina. Bbox1 does not label ChAT amacrines in the INL (yellow asterisks) but does label displaced ChAT amacrines in the GCL (white arrows). i-j. Representative images (i) and quantification (j) of Bbox1 (green) and ganglion cells (RBPMS, magenta) colocalization in adult retina. Bbox1 labels all ganglion cells in the GCL and also labels displaced ganglion cells in the INL (white arrows). n = 3 animals. Data are represented as the mean ± SEM. Scale bars = 50 μm.
3.5: Dbn1 is an early and specific marker for all amacrine subtypes
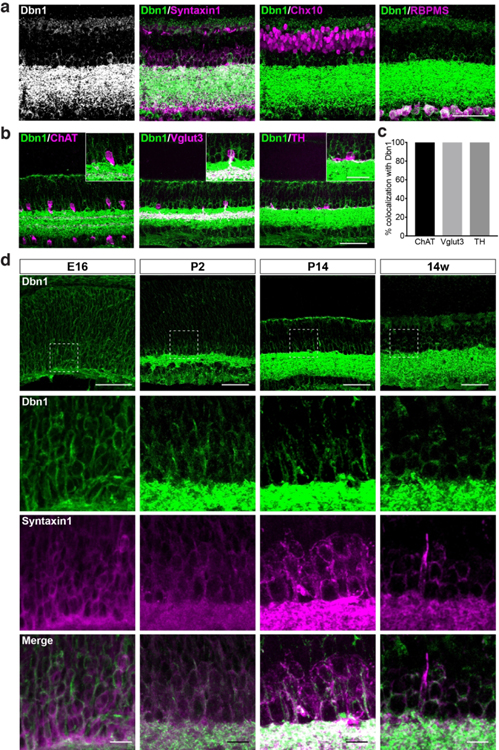
Neuron subtypes in the retina can be identified by gene expression patterns that display periodicity or restriction to neuron specific regions. For example, amacrine-specific genes would be predicted to be present in the lower half of the INL and in ~40% of the GCL, while amacrine subtype-specific gene might be present only in a subset of INL neurons. Four genes robustly displayed one of these patterns by lacZ staining: echinoderm microtubule-associated protein-like 2 (Eml2, Fry, O’Regan, Montgomery, Adib, & Bayliss, 2016), fibroblast growth factor 3 (Fgf3, Represa, Leon, Miner, & Giraldez, 1991), Phf24, and Dbn1. To further explore these patterns, we focused our analysis on Dbn1. We asked which inner retina neuron types were Dbn1 positive by co-labeling for Dbn1 together with Syntaxin1, Chx10, and RBPMS to specifically mark amacrine, bipolar, and ganglion cells, respectively (Fig. 7a). We found that Dbn1 was enriched in Syntaxin1-positive cells but was absent or at low levels in other inner retina neuron types. Similar to Syntaxin1, Dbn1 expression was also observed in the OPL, albeit in low abundance. To localize and quantify this protein within specific amacrine subsets, we then stained for Dbn1 in conjunction with amacrine subtype markers (see Table 1). Dbn1 was present in all ChAT-positive starburst amacrines, all Vglut3-positive glutamatergic amacrines, and all TH-positive dopaminergic amacrines (Fig. 7b and c). We next asked when Dbn1 becomes specifically enriched for amacrines. Amacrines are born between E12 to P0 and are fully specified at birth (Fujitani et al., 2006). They then extend neurites and form synaptic contacts over the first two postnatal weeks. To examine these processes, we surveyed for co-expression of Dbn1 and Syntaxin1 in retina at E16, P2, P14, and 14 weeks. Dbn1 was present at E16 in postmitotic neurons in the inner retina and overlapped with Syntaxin1 (100%±1% overlap), indicating that Dbn1 is present in amacrines as early as the best available marker for amacrine cell fate (Fig. 7d). By P2, Dbn1 was highly enriched in amacrine cell bodies and their developing processes in the IPL and continued to show high colocalization with Syntaxin1 (100%±0% overlap). This pattern persisted at P14 and into adulthood (Fig. 7d). Together, these data suggest that Dbn1 is an early and specific marker for amacrine cells.
Figure 7. Dbn1 is expressed in developing and mature amacrine cells.
a. Representative images showing Dbn1 (green) co-staining together with staining for the major neuron cell classes in adult retina (amacrine cells, Syntaxin1; bipolar cells, Chx10; retinal ganglion cells, RBPMS). Dbn1 appears selectively enriched in amacrines. Scale bar = 50 μm. b-c. Representative images (b) and quantification (c) of Dbn1 co-staining with specific amacrine cells subtypes in adult retina (starburst amacrines, ChAT; dopaminergic amacrines, TH; vesicular glutamate transporter 3 amacrines, Vglut3). Dbn1 is present in all amacrine cell subsets examined. Scale bar = 50 μm in the full image and 25 μm in the insets. d. Representative images of Dbn1 (green) co-staining with the amacrine marker Syntaxin1 (magenta) across retina development (E16, P2, P14, and 14w) in wildtype mice. The lower panels show enlarged views of the boxed regions. n = 3 animals. Data are represented as the mean ± SEM. Scale bars = 50 μm in the upper panel and 10 μm in the lower panels.
3.6: Fmnl3 demarks unique subsets of RGCs
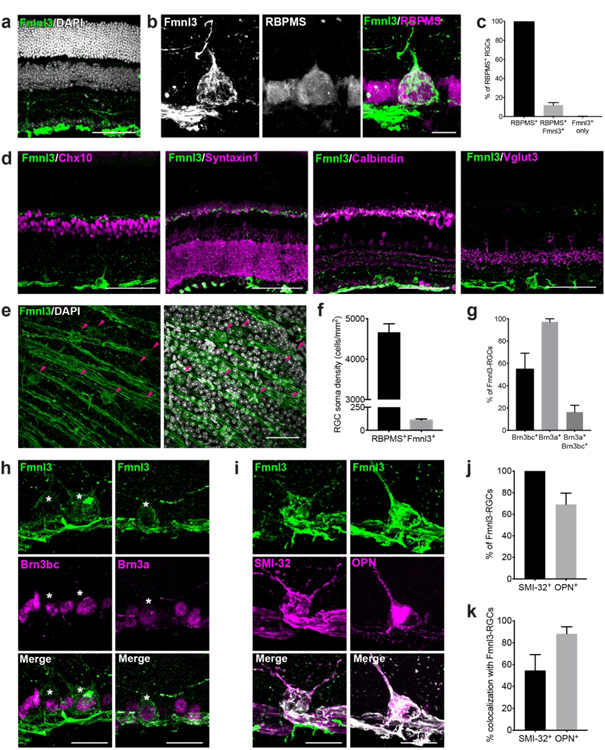
Our analysis of GCL-restricted genes identified Fmnl3 as a potential candidate selectively expressed by RGCs. To validate the expression of Fmnl3 in these cells, we stained retinas with an Fmnl3 antibody together with the pan-RGC marker RBPMS. Fmnl3 was present in the cell bodies and axons of GCL neurons, all of which co-labeled with RBPMS (Fig. 8a-c). While low levels of Fmnl3 were occasionally present in the OPL, it was absent in the cell bodies of all other inner retina neuron types, including bipolar cells, amacrines, and horizontal cells (Fig. 8d). Thus, all Fmnl3-positive retinal cell bodies are RGCs, and we refer to these cells hereafter as Fmnl3-RGCs. We determined the fraction of RGCs that were Fmnl3-RGCs by quantifying their density in whole mounts. Fmnl3-RGCs display an average density of 102±18 cells/mm2 which accounts for 15%±1% of all RGCs (Fig. 8e and f). We next asked whether Fmnl3-RGCs were comprised of diverse RGC types. RGCs can be broadly categorized based on their staining for the transcription factors Brn3a and Brn3bc. Co-staining with these markers showed that 62%±9% of Fmnl3-RGCs were positive for Brn3a, 34%±8% were positive for Brn3bc, and 16%±6% were positive for both Brn3a and b/c (Fig. 8g and h). These data suggest that Fmnl3-RGCs are comprised of more than one RGC type. To begin to identify these types, we took advantage of a panel of molecular markers known to label specific RGC subsets. All Fmnl3-RGCs were positive for SMI-32, which predominately labels αRGCs (Krieger et al., 2017; Duan et al., 2015). Consistent with this, co-labeling with osteopontin (OPN), another known marker of αRGCs, showed that 88%±6% of OPN-positive cells also expressed Fmnl3 (Fig. 8i-k). Since 45%±15% SMI-32 RGCs were Fmnl3-negative, Fmnl3-RGCs are likely to comprise αRGC subsets.
Figure 8. Fmnl3 expression labels subsets of αRGCs.
a. Fmnl3 (green) localization in adult retina shows that it is expressed in the ganglion cell layer (DAPI, grey). b-c. Representative images (b) and quantification (c) of Fmnl3 labeling (green) together with the retinal ganglion cell (RGC) marker RBPMS (magenta). Fmnl3 labels 15% of RGCs. d. Representative images of Fmnl3 (green) colocalization with inner retina cell types (bipolar cells, Chx10; amacrines, Syntaxin1; horizontal cells, Calbindin; glutamatergic amacrines, Vglut3) in adult 14-week-old wildtype retinas. Fmnl3 is present in ganglion cells but absent from bipolar cells, amacrine cells, and horizontal cells. e-f. Representative images (e) and quantification (f) of Fmnl3-positive RGC soma density in whole-mount preparations from adult retina. Fmnl3-positive RGCs are arranged in a sparse array (arrows). g-h. Quantification (g) and representative images (h) of Fmnl3 staining (green) together with the RGC subset markers Brn3a and Brn3bc (magenta) in adult wildtype animals. Fmnl3 is present in subsets of both Brn3a and Brn3bc expressing ganglion cells (white asterisks). i-k. Representative images (i) and quantification (j-k) of Fmnl3 (green) colocalization with αRGCs labeled with osteopontin (OPN, magenta, left panel) and SMI-32 (magenta, right panel). Fmnl3 is present in both OPN and SMI-32 positive RGCs, suggesting that Fmnl3 labels αRGC subsets. n = 3 animals. Data are represented as the mean ± SEM. Scale bars = 50 μm.
4. DISCUSSION
In this study we utilized 92 lacZ reporter lines available through the Knockout Mouse Project and identified 32 candidates with reporter expression in laminar restricted subsets of inner retina neurons. We mapped the spatiotemporal expression profiles of these candidates at key developmental stages and noted three categories of expression: some were enriched in early neurogenesis, others were prevalent in developing fate committed neurons, and a third set was enriched in mature neurons. Among these, we identified a subset for which validated antibodies are available in order to document their timing and cell type-specificity. In particular, we showed that Hmga1 is enriched in undifferentiated neurons but becomes restricted to inner retina neuron lamina as the retina matures. In contrast, Bbox1 is upregulated in adult neurons and is present only in the GCL, suggesting that Bbox1 is a shared molecular feature of GCL neurons independent of their subtype. We also find that Dbn1 is a novel early and specific marker for amacrine cells and that Fmnl3 demarks subsets of αRGCs. This work provides a spatiotemporal map for laminar and cell type-specific neural fate programs, identifies new neural markers, and suggests that diverse neuron types within a lamina may share coordinating molecular features.
4.1: The KOMP mouse lines as a tool to uncover conserved molecular programs within cell types
In this study, we deployed a systematic approach that captures unique gene expression patterns across space and developmental time that leverages the animal lines available through KOMP. These lines have several advantages that enable us to rapidly match gene expression levels with gene expression location within a tissue and identify novel molecular patterns. First, KOMP lines encompass a set of genes whose cellular functions are not well mapped since alleles are selected for inclusion in the pipeline in part due to the absence of existing mouse models (Dickinson et al., 2016). Second, many KOMP lines are constructed to include lacZ in place of part of the coding region of a given gene such that simple staining can reveal dynamic cellular expression patterns even in single neurons. This complements single cell sequencing efforts in retina, which tend to capture the top 10% of transcripts in neuron subsets (Macosko et al., 2015; Clark et al., 2019). Third, mutants are slated for comprehensive phenotyping analysis through the KOMP pipeline enabling the potential identification of gene-associated phenotypes. Fourth, additional gene expression data can be accessed through the KOMP database enabling virtual expression screening in different tissue compartments at various developmental and adult ages (www.impc.org). Finally, since all of the lines are publicly available, they can be readily accessed by the community for further study. We showcase this resource here using cell specific staining in the retina to identify unique laminar restricted expression patterns. Similar studies in other organ systems would likely have equal utility.
4.2: Specific gene expression patterns delineate laminar-specific phases of neuron maturation
The molecular attributes required to generate a laminar-specific bias in neural development and whether a shared molecular program is specified within laminae remain largely unknown. One possibility is that laminae are a by-product of the developmental processes that establish wiring specificity. An alternative idea is that laminae may represent a fundamental unit of molecular function in which cells whose functions differ are spatially clustered based on shared molecular profiles. In line with this idea, large-scale in situ hybridization projects in the neocortex have been carried out to identify layer-specific markers (Gray et al., 2004; Lein et al., 2007). Among the markers identified, some are expressed in one specific neuronal type within a layer or across layers, others exhibit a varying degree of restricted expression across multiple subtypes of a neuron class (Nieto et al., 2004; McEvilly, de Diaz, Schonemann, Hooshmand, & Rosenfeld, 2002; Ferland, Cherry, Preware, Morrisey, & Walsh, 2003). Similarly, in the retina we noted several genes that displayed laminar specific enrichment in distinct developmental windows. Some genes were present early in the RPC ventricular zone (e.g. Dbn1, Hmga1, Zfpl1), while other genes were enriched in fate committed neurons (e.g. Adsl, Erc1, Phf24, Rad9a). Among these, Hmga1 displayed the highest levels of expression overall. It was broadly present at E16 but became specific for inner retina laminae as the retina matured. Hmga1 has been implicated in cell growth and differentiation in cancers, including retinoblastoma (Cleynen & Van de Ven, 2008; Mu et al., 2010), and homozygous null Hmga1 mice display preweaning lethality (www.impc.org). In addition, the closely related molecule Hmga2 is required for stem cell function and restricts differentiation of both neurons and Müller glia (Parameswaran, Xia, Hegde, & Ahmad, 2014; Xia & Ahmad, 2016). We thus speculate that like Hmga2, Hmga1 may be critical for neural development potentially through regulating progenitor cell cycling or survival.
4.3: Bbox1 suggests molecular relatedness among cells in the GCL
The organization of laminated CNS neurons can occur in two general patterns. In the first, neurons of one general type cluster together within a layer to form an ordered sub-lamina. In the second, neurons of different types are intermingled within a distinct layer (Popovitchenko & Rasin, 2017). Like other regions of the CNS, the retina displays both patterns. Neurons in the ONL and INL follow the first design principle, while neurons in the GCL follow the second and are comprised of a mixed population of displaced amacrines and ganglion cells. The mechanisms that dictate one form of lamination versus the other have not been described, and to date no molecules that separate GCL neurons from other retina neurons have been identified. We identified Bbox1 as a shared molecular feature of diverse neuron types within the ganglion cell layer. It labeled all ganglion cells and displaced amacrines in this layer but was absent from otherwise similar amacrine subsets in the INL. This finding has several implications. First, it suggests that lamina may either derive from or adopt shared molecular program during development. Second, it suggests that molecular features exist that sperate and perhaps participate in patterning genetically homogeneous but spatially sperate cell types like starburst amacrines. It will be interesting to explore laminar restriction of such neural subtypes further to determine if molecules can be identified that instruct this process. Bbox1 (Gamma-butyrobetaine hydroxylase) itself may be one such candidate as it is required for the biosynthesis of L-carnitine, an important molecule in fatty acid metabolism and energy homeostasis (Rigault, Le Borgne, & Demarquoy, 2006). Interestingly, this line is homozygous subviable and displays abnormal midbrain and hindbrain morphology and abnormal neural tube closure (https://www.mousephenotype.org/data/genes/MGI:1891372).
4.4: Dbn1 is a novel molecular feature of amacrine cells
Among the cell specific gene expression patterns documented in our analysis, Dbn1 showed robust expression in fate committed neurons at early developmental stages and became restricted to parts of the INL and GCL as neurons matured. In subsequent analysis, we showed that Dbn1 is expressed at the early stages of amacrine development and coincides with Syntaxin1, one of few available pan-amacrine markers. Given this specificity, we propose Dbn1 as an alternative pan-amacrine cell type marker in the retina. Such tools are powerful because they can be used to mark and follow neuron subsets in development as well as to generate specific genetics tools for mapping and manipulating circuits (Kim, Zhang, Yamagata, Meister, & Sanes, 2008, Siegert et al., 2009). While the precise function of Dbn1 in amacrines is unknown, Dbn1 has been shown to bind to and stabilize F-actin in dendritic spines (Hanamura et al., 2018). It has also been implicated in cognitive decline in a variety of neurodegenerative disorders, including Alzheimer’s disease and Down syndrome (Harigaya, Shoji, Shirao, & Hirai, 1996; Hatanpaa, Isaacs, Shirao, Brady, & Rapoport, 1999; Shim & Lubec, 2002).
4.5: Fmnl3 represents a new molecular marker for αRGC subsets
We showed that Fmnl3 is specific for a subset of RGCs and identified these cells as primarily comprised of αRGC types. Notably, even though there are an estimated ~30 types of RGCs based on electrophysiology, morphology, and single-cell sequencing, antibody-based markers are only available for a limited number of these types (Rheaume et al., 2018; Sanes & Masland, 2015). Fmnl3 thus joins a small but important set of tools that can be used to distinguish subsets of RGC types from others. Fmnl3-RGCs comprise ~15% of all RGCs, and this marker provides ready access to αRGC subsets. Since distinction between αRGC subsets has been largely based on electrophysiology, this reagent may enable fuller access to and understanding of αRGC types.
In sum, these data provide a spatiotemporal roadmap of factors that show laminar-selective gene expression and document the distribution, specificity, and dynamics of representative candidates. These results suggest that unique cues may distinguish lamina comprised of diverse neural types even when similar neurons are present elsewhere. Since many of the catalogued factors are expressed in additional regions of the nervous system, it will be interesting to determine whether this set of molecules can be used to identify temporal patterns or neuron subtypes in other regions of the CNS.
Highlights.
Identified 32 genes that selectively label inner retina neuron cell types.
Mapped spatiotemporal profiles to reveal genes that show laminar enrichment in development.
Identified Bbox1 as a shared molecular feature of all neurons within the ganglion cell layer.
Defined Dbn1 as a novel amacrine enriched molecule.
Established Fmnl3 as a new marker for subsets of αRGCs.
Acknowledgements
We thank Benjamin Arenkiel and members of our laboratory for scientific discussions and advice. We also thank John R. Seavitt, Arthur L. Beaudet, and Mary E. Dickinson for assistance in the initial INSiGHT screen that led to this work. This work was supported by the National Institutes of Health (NIH, R00AG044444 and DP2EY02798 to M.A.S.), the Cancer Prevention Research Institute of Texas (RR150005), the Brain Research Foundation, and the Ted Nash Foundation. This project was also supported by the RNA In Situ Hybridization Core facility at Baylor College of Medicine with the assistance of Cecilia Ljungberg, Ph.D., and funding from the NIH (1S10 OD016167; IDDRC grant 1U54 HD083092, Eunice Kennedy Shriver National Institute of Child Health & Human Development). The availability of the Knockout Mouse Project lines was supported by KOMP2 awards UM1HG006348, U42OD11174, and U54HG006348.
Footnotes
Competing Financial Interests. The authors declare no competing financial interests.
Data Availability Statement: The data that support the findings of this study are available from the corresponding author upon reasonable request.
REFERENCES
- Abou Jamra R, Philippe O, Raas-Rothschild A, Eck SH, Graf E, Buchert R, … Colleaux L. (2011). Adaptor protein complex 4 deficiency causes severe autosomal-recessive intellectual disability, progressive spastic paraplegia, shy character, and short stature. Am J Hum Genet, 88(6), 788–795. doi: 10.1016/j.ajhg.2011.04.019 [DOI] [PMC free article] [PubMed] [Google Scholar]
- Agathocleous M, & Harris WA. (2009). From progenitors to differentiated cells in the vertebrate retina. Annu Rev Cell Dev Biol, 25, 45–69. doi: 10.1146/annurev.cellbio.042308.113259 [DOI] [PubMed] [Google Scholar]
- Albrecht NE, Alevy J, Jiang D, Burger CA, Liu BI, Li F, … Samuel MA. (2018). Rapid and Integrative Discovery of Retina Regulatory Molecules. Cell Rep, 24(9), 2506–2519. doi: 10.1016/j.celrep.2018.07.090 [DOI] [PMC free article] [PubMed] [Google Scholar]
- Barnstable CJ, Hofstein R, & Akagawa K. (1985). A marker of early amacrine cell development in rat retina. Brain Res, 352(2), 286–290. doi: 10.1016/0165-3806(85)90116-6 [DOI] [PubMed] [Google Scholar]
- Bleckert A, Schwartz GW, Turner MH, Rieke F, & Wong RO. (2014). Visual space is represented by nonmatching topographies of distinct mouse retinal ganglion cell types. Curr Biol, 24(3), 310–315. doi: 10.1016/j.cub.2013.12.020 [DOI] [PMC free article] [PubMed] [Google Scholar]
- Bustin M, & Reeves R. (1996). High-mobility-group chromosomal proteins: architectural components that facilitate chromatin function. Prog Nucleic Acid Res Mol Biol, 54, 35–100. [DOI] [PubMed] [Google Scholar]
- Campbell MJ, & Morrison JH. (1989). Monoclonal antibody to neurofilament protein (SMI-32) labels a subpopulation of pyramidal neurons in the human and monkey neocortex. J Comp Neurol, 282(2), 191–205. doi: 10.1002/cne.902820204 [DOI] [PubMed] [Google Scholar]
- Chen CM, & Cepko CL. (2000). Expression of Chx10 and Chx10–1 in the developing chicken retina. Mech Dev, 90(2), 293–297. [DOI] [PubMed] [Google Scholar]
- Clark BS, Stein-O’Brien GL, Shiau F, Cannon GH, Davis-Marcisak E, Sherman T, … Blackshaw S. (2019). Single-Cell RNA-Seq Analysis of Retinal Development Identifies NFI Factors as Regulating Mitotic Exit and Late-Born Cell Specification. Neuron, 102(6), 1111–1126 e1115. doi: 10.1016/j.neuron.2019.04.010 [DOI] [PMC free article] [PubMed] [Google Scholar]
- Cleynen I, & Van de Ven WJ. (2008). The HMGA proteins: a myriad of functions (Review). Int J Oncol, 32(2), 289–305. [PubMed] [Google Scholar]
- Dell’Angelica EC, Mullins C, & Bonifacino JS. (1999). AP-4, a novel protein complex related to clathrin adaptors. J Biol Chem, 274(11), 7278–7285. doi: 10.1074/jbc.274.11.7278 [DOI] [PubMed] [Google Scholar]
- Dickinson ME, Flenniken AM, Ji X, Teboul L, Wong MD, White JK, … Murray SA. (2016). High-throughput discovery of novel developmental phenotypes. Nature, 537(7621), 508–514. doi: 10.1038/nature19356 [DOI] [PMC free article] [PubMed] [Google Scholar]
- Drager UC, & Olsen JF. (1981). Ganglion cell distribution in the retina of the mouse. Invest Ophthalmol Vis Sci, 20(3), 285–293. [PubMed] [Google Scholar]
- Duan X, Qiao M, Bei F, Kim IJ, He Z, & Sanes JR. (2015). Subtype-specific regeneration of retinal ganglion cells following axotomy: effects of osteopontin and mTOR signaling. Neuron, 85(6), 1244–1256. doi: 10.1016/j.neuron.2015.02.017 [DOI] [PMC free article] [PubMed] [Google Scholar]
- Elshatory Y, Deng M, Xie X, & Gan L. (2007a). Expression of the LIM-homeodomain protein Isl1 in the developing and mature mouse retina. J Comp Neurol, 503(1), 182–197. doi: 10.1002/cne.21390 [DOI] [PMC free article] [PubMed] [Google Scholar]
- Elshatory Y, Everhart D, Deng M, Xie X, Barlow RB, & Gan L. (2007b). Islet-1 controls the differentiation of retinal bipolar and cholinergic amacrine cells. J Neurosci, 27(46), 12707–12720. doi: 10.1523/JNEUROSCI.3951-07.2007 [DOI] [PMC free article] [PubMed] [Google Scholar]
- Fang C, Bian G, Ren P, Xiang J, Song J, Yu C, … Wang J. (2018). S1P transporter SPNS2 regulates proper postnatal retinal morphogenesis. FASEB J, 32(7), 3597–3613. doi: 10.1096/fj.201701116R [DOI] [PubMed] [Google Scholar]
- Fasano C, Rocchetti J, Pietrajtis K, Zander JF, Manseau F, Sakae DY, … El Mestikawy S. (2017). Regulation of the Hippocampal Network by VGLUT3-Positive CCK- GABAergic Basket Cells. Front Cell Neurosci, 11, 140. doi: 10.3389/fncel.2017.00140 [DOI] [PMC free article] [PubMed] [Google Scholar]
- Ferland RJ, Cherry TJ, Preware PO, Morrisey EE, & Walsh CA. (2003). Characterization of Foxp2 and Foxp1 mRNA and protein in the developing and mature brain. J Comp Neurol, 460(2), 266–279. doi: 10.1002/cne.10654 [DOI] [PubMed] [Google Scholar]
- Fry AM, O’Regan L, Montgomery J, Adib R, & Bayliss R. (2016). EML proteins in microtubule regulation and human disease. Biochem Soc Trans, 44(5), 1281–1288. doi: 10.1042/BST20160125 [DOI] [PubMed] [Google Scholar]
- Fujitani Y, Fujitani S, Luo H, Qiu F, Burlison J, Long Q, … Wright CV. (2006). Ptf1a determines horizontal and amacrine cell fates during mouse retinal development. Development, 133(22), 4439–4450. doi: 10.1242/dev.02598 [DOI] [PubMed] [Google Scholar]
- Gerlitz G, Hock R, Ueda T, & Bustin M. (2009). The dynamics of HMG protein-chromatin interactions in living cells. Biochem Cell Biol, 87(1), 127–137. doi: 10.1139/O08-110 [DOI] [PMC free article] [PubMed] [Google Scholar]
- Gray PA, Fu H, Luo P, Zhao Q, Yu J, Ferrari A, … Ma Q. (2004). Mouse brain organization revealed through direct genome-scale TF expression analysis. Science, 306(5705), 2255–2257. doi: 10.1126/science.1104935 [DOI] [PubMed] [Google Scholar]
- Gustincich S, Feigenspan A, Wu DK, Koopman LJ, & Raviola E. (1997). Control of dopamine release in the retina: a transgenic approach to neural networks. Neuron, 18(5), 723–736. [DOI] [PubMed] [Google Scholar]
- Hanamura K, Kamata Y, Yamazaki H, Kojima N, & Shirao T. (2018). Isoform-dependent Regulation of Drebrin Dynamics in Dendritic Spines. Neuroscience, 379, 67–76. doi: 10.1016/j.neuroscience.2018.02.038 [DOI] [PubMed] [Google Scholar]
- Harigaya Y, Shoji M, Shirao T, & Hirai S. (1996). Disappearance of actin-binding protein, drebrin, from hippocampal synapses in Alzheimer’s disease. J Neurosci Res, 43(1), 87–92. doi: 10.1002/jnr.490430111 [DOI] [PubMed] [Google Scholar]
- Hatanpaa K, Isaacs KR, Shirao T, Brady DR, & Rapoport SI. (1999). Loss of proteins regulating synaptic plasticity in normal aging of the human brain and in Alzheimer disease. J Neuropathol Exp Neurol, 58(6), 637–643. doi: 10.1097/00005072-199906000-00008 [DOI] [PubMed] [Google Scholar]
- Haverkamp S, Inta D, Monyer H, & Wassle H. (2009). Expression analysis of green fluorescent protein in retinal neurons of four transgenic mouse lines. Neuroscience, 160(1), 126–139. doi: 10.1016/j.neuroscience.2009.01.081 [DOI] [PubMed] [Google Scholar]
- Haverkamp S, & Wassle H. (2000). Immunocytochemical analysis of the mouse retina. J Comp Neurol, 424(1), 1–23. [PubMed] [Google Scholar]
- Hayashi K, & Shirao T. (1999). Change in the shape of dendritic spines caused by overexpression of drebrin in cultured cortical neurons. J Neurosci, 19(10), 3918–3925. [DOI] [PMC free article] [PubMed] [Google Scholar]
- Haycock JW, & Waymire JC. (1982). Activating antibodies to tyrosine hydroxylase. J Biol Chem, 257(16), 9416–9423. [PubMed] [Google Scholar]
- Hirano AA, Brandstatter JH, & Brecha NC. (2005). Cellular distribution and subcellular localization of molecular components of vesicular transmitter release in horizontal cells of rabbit retina. J Comp Neurol, 488(1), 70–81. doi: 10.1002/cne.20577 [DOI] [PMC free article] [PubMed] [Google Scholar]
- Hirst J, Bright NA, Rous B, & Robinson MS. (1999). Characterization of a fourth adaptor-related protein complex. Mol Biol Cell, 10(8), 2787–2802. doi: 10.1091/mbc.10.8.2787 [DOI] [PMC free article] [PubMed] [Google Scholar]
- Janoueix-Lerosey I, Pasheva E, de Tand MF, Tavitian A, & de Gunzburg J. (1998). Identification of a specific effector of the small GTP-binding protein Rap2. Eur J Biochem, 252(2), 290–298. doi: 10.1046/j.1432-1327.1998.2520290.x [DOI] [PubMed] [Google Scholar]
- Jeon CJ, Strettoi E, & Masland RH. (1998). The major cell populations of the mouse retina. J Neurosci, 18(21), 8936–8946. [DOI] [PMC free article] [PubMed] [Google Scholar]
- Kao YH, & Sterling P. (2006). Displaced GAD65 amacrine cells of the guinea pig retina are morphologically diverse. Vis Neurosci, 23(6), 931–939. doi: 10.1017/S0952523806230293 [DOI] [PubMed] [Google Scholar]
- Kay JN, Voinescu PE, Chu MW, & Sanes JR. (2011). Neurod6 expression defines new retinal amacrine cell subtypes and regulates their fate. Nat Neurosci, 14(8), 965–972. doi: 10.1038/nn.2859 [DOI] [PMC free article] [PubMed] [Google Scholar]
- Keeley PW, Zhou C, Lu L, Williams RW, Melmed S, & Reese BE. (2014). Pituitary tumor-transforming gene 1 regulates the patterning of retinal mosaics. Proc Natl Acad Sci U S A, 111(25), 9295–9300. doi: 10.1073/pnas.1323543111 [DOI] [PMC free article] [PubMed] [Google Scholar]
- Kim IJ, Zhang Y, Yamagata M, Meister M, & Sanes JR. (2008). Molecular identification of a retinal cell type that responds to upward motion. Nature, 452(7186), 478–482. doi: 10.1038/nature06739 [DOI] [PubMed] [Google Scholar]
- Krieger B, Qiao M, Rousso DL, Sanes JR, & Meister M. (2017). Four alpha ganglion cell types in mouse retina: Function, structure, and molecular signatures. PLoS One, 12(7), e0180091. doi: 10.1371/journal.pone.0180091 [DOI] [PMC free article] [PubMed] [Google Scholar]
- Lein ES, Hawrylycz MJ, Ao N, Ayres M, Bensinger A, Bernard A, … Jones AR. (2007). Genome-wide atlas of gene expression in the adult mouse brain. Nature, 445(7124), 168–176. doi: 10.1038/nature05453 [DOI] [PubMed] [Google Scholar]
- Lin B, & Masland RH. (2006). Populations of wide-field amacrine cells in the mouse retina. J Comp Neurol, 499(5), 797–809. doi: 10.1002/cne.21126 [DOI] [PubMed] [Google Scholar]
- Liu IS, Chen JD, Ploder L, Vidgen D, van der Kooy D, Kalnins VI, & McInnes RR. (1994). Developmental expression of a novel murine homeobox gene (Chx10): evidence for roles in determination of the neuroretina and inner nuclear layer. Neuron, 13(2), 377–393. [DOI] [PubMed] [Google Scholar]
- Livak KJ, & Schmittgen TD. (2001). Analysis of relative gene expression data using real-time quantitative PCR and the 2(-Delta Delta C(T)) Method. Methods, 25(4), 402–408. doi: 10.1006/meth.2001.1262 [DOI] [PubMed] [Google Scholar]
- MacNeil MA, & Masland RH. (1998). Extreme diversity among amacrine cells: implications for function. Neuron, 20(5), 971–982. [DOI] [PubMed] [Google Scholar]
- Macosko EZ, Basu A, Satija R, Nemesh J, Shekhar K, Goldman M, … McCarroll SA. (2015). Highly Parallel Genome-wide Expression Profiling of Individual Cells Using Nanoliter Droplets. Cell, 161(5), 1202–1214. doi: 10.1016/j.cell.2015.05.002 [DOI] [PMC free article] [PubMed] [Google Scholar]
- Marquardt T, & Gruss P. (2002). Generating neuronal diversity in the retina: one for nearly all. Trends Neurosci, 25(1), 32–38. [DOI] [PubMed] [Google Scholar]
- Masland RH. (2001a). The fundamental plan of the retina. Nat Neurosci, 4(9), 877–886. doi: 10.1038/nn0901-877 [DOI] [PubMed] [Google Scholar]
- Masland RH. (2001b). Neuronal diversity in the retina. Curr Opin Neurobiol, 11(4), 431–436. [DOI] [PubMed] [Google Scholar]
- Masland RH. (2012). The neuronal organization of the retina. Neuron, 76(2), 266–280. doi: 10.1016/j.neuron.2012.10.002 [DOI] [PMC free article] [PubMed] [Google Scholar]
- Masland RH, Rizzo JF 3rd, & Sandell JH. (1993). Developmental variation in the structure of the retina. J Neurosci, 13(12), 5194–5202. [DOI] [PMC free article] [PubMed] [Google Scholar]
- McEvilly RJ, de Diaz MO, Schonemann MD, Hooshmand F, & Rosenfeld MG. (2002). Transcriptional regulation of cortical neuron migration by POU domain factors. Science, 295(5559), 1528–1532. doi: 10.1126/science.1067132 [DOI] [PubMed] [Google Scholar]
- Mu G, Liu H, Zhou F, Xu X, Jiang H, Wang Y, & Qu Y. (2010). Correlation of overexpression of HMGA1 and HMGA2 with poor tumor differentiation, invasion, and proliferation associated with let-7 down-regulation in retinoblastomas. Hum Pathol, 41(4), 493–502. doi: 10.1016/j.humpath.2009.08.022 [DOI] [PubMed] [Google Scholar]
- Murtagh F, & Legendre P. (2014). Ward’s Hierarchical Agglomerative Clustering Method: Which Algorithms Implement Ward’s Criterion? Journal of Classification, 31(3), 274–295. [Google Scholar]
- Nagayama S, Homma R, & Imamura F. (2014). Neuronal organization of olfactory bulb circuits. Front Neural Circuits, 8, 98. doi: 10.3389/fncir.2014.00098 [DOI] [PMC free article] [PubMed] [Google Scholar]
- Nieto M, Monuki ES, Tang H, Imitola J, Haubst N, Khoury SJ, … Walsh CA. (2004). Expression of Cux-1 and Cux-2 in the subventricular zone and upper layers II-IV of the cerebral cortex. J Comp Neurol, 479(2), 168–180. doi: 10.1002/cne.20322 [DOI] [PubMed] [Google Scholar]
- Pang JJ, & Wu SM. (2011). Morphology and immunoreactivity of retrogradely double-labeled ganglion cells in the mouse retina. Invest Ophthalmol Vis Sci, 52(7), 4886–4896. doi: 10.1167/iovs.10-5921 [DOI] [PMC free article] [PubMed] [Google Scholar]
- Parameswaran S, Xia X, Hegde G, & Ahmad I. (2014). Hmga2 regulates self-renewal of retinal progenitors. Development, 141(21), 4087–4097. doi: 10.1242/dev.107326 [DOI] [PMC free article] [PubMed] [Google Scholar]
- Perez De Sevilla Muller L, Shelley J, & Weiler R. (2007). Displaced amacrine cells of the mouse retina. J Comp Neurol, 505(2), 177–189. doi: 10.1002/cne.21487 [DOI] [PubMed] [Google Scholar]
- Popovitchenko T, & Rasin MR. (2017). Transcriptional and Post-Transcriptional Mechanisms of the Development of Neocortical Lamination. Front Neuroanat, 11, 102. doi: 10.3389/fnana.2017.00102 [DOI] [PMC free article] [PubMed] [Google Scholar]
- Rapaport DH, Wong LL, Wood ED, Yasumura D, & LaVail MM. (2004). Timing and topography of cell genesis in the rat retina. J Comp Neurol, 474(2), 304–324. doi: 10.1002/cne.20134 [DOI] [PubMed] [Google Scholar]
- Reese BE. (2011). Development of the retina and optic pathway. Vision Res, 51(7), 613–632. doi: 10.1016/j.visres.2010.07.010 [DOI] [PMC free article] [PubMed] [Google Scholar]
- Represa J, Leon Y, Miner C, & Giraldez F. (1991). The int-2 proto-oncogene is responsible for induction of the inner ear. Nature, 353(6344), 561–563. doi: 10.1038/353561a0 [DOI] [PubMed] [Google Scholar]
- Rheaume BA, Jereen A, Bolisetty M, Sajid MS, Yang Y, Renna K, … Trakhtenberg EF. (2018). Single cell transcriptome profiling of retinal ganglion cells identifies cellular subtypes. Nat Commun, 9(1), 2759. doi: 10.1038/s41467-018-05134-3 [DOI] [PMC free article] [PubMed] [Google Scholar]
- Rigault C, Le Borgne F, & Demarquoy J. (2006). Genomic structure, alternative maturation and tissue expression of the human BBOX1 gene. Biochim Biophys Acta, 1761(12), 1469–1481. doi: 10.1016/j.bbalip.2006.09.014 [DOI] [PubMed] [Google Scholar]
- Rodriguez AR, de Sevilla Muller LP, & Brecha NC. (2014). The RNA binding protein RBPMS is a selective marker of ganglion cells in the mammalian retina. J Comp Neurol, 522(6), 1411–1443. doi: 10.1002/cne.23521 [DOI] [PMC free article] [PubMed] [Google Scholar]
- Sanes JR, & Masland RH. (2015). The types of retinal ganglion cells: current status and implications for neuronal classification. Annu Rev Neurosci, 38, 221–246. doi: 10.1146/annurev-neuro-071714-034120 [DOI] [PubMed] [Google Scholar]
- Sanes JR, & Zipursky SL. (2010). Design principles of insect and vertebrate visual systems. Neuron, 66(1), 15–36. doi: 10.1016/j.neuron.2010.01.018 [DOI] [PMC free article] [PubMed] [Google Scholar]
- Serikawa T, Kunisawa N, Shimizu S, Kato M, Alves Iha H, Kinboshi M, … Ohno Y. (2019). Increased seizure sensitivity, emotional defects and cognitive impairment in PHD finger protein 24 (Phf24)-null rats. Behav Brain Res, 369, 111922. doi: 10.1016/j.bbr.2019.111922 [DOI] [PubMed] [Google Scholar]
- Shim KS, & Lubec G. (2002). Drebrin, a dendritic spine protein, is manifold decreased in brains of patients with Alzheimer’s disease and Down syndrome. Neurosci Lett, 324(3), 209–212. doi: 10.1016/s0304-3940(02)00210-0 [DOI] [PubMed] [Google Scholar]
- Shirao T, Hanamura K, Koganezawa N, Ishizuka Y, Yamazaki H, & Sekino Y. (2017). The role of drebrin in neurons. J Neurochem, 141(6), 819–834. doi: 10.1111/jnc.13988 [DOI] [PubMed] [Google Scholar]
- Shirao T, Kojima N, & Obata K. (1992). Cloning of drebrin A and induction of neurite-like processes in drebrin-transfected cells. Neuroreport, 3(1), 109–112. [DOI] [PubMed] [Google Scholar]
- Siegert S, Scherf BG, Del Punta K, Didkovsky N, Heintz N, & Roska B. (2009). Genetic address book for retinal cell types. Nat Neurosci, 12(9), 1197–1204. doi: 10.1038/nn.2370 [DOI] [PubMed] [Google Scholar]
- Turner DL, & Cepko CL. (1987). A common progenitor for neurons and glia persists in rat retina late in development. Nature, 328(6126), 131–136. doi: 10.1038/328131a0 [DOI] [PubMed] [Google Scholar]
- Versaux-Botteri C, Nguyen-Legros J, Vigny A, & Raoux N. (1984). Morphology, density and distribution of tyrosine hydroxylase-like immunoreactive cells in the retina of mice. Brain Res, 301(1), 192–197. doi: 10.1016/0006-8993(84)90423-2 [DOI] [PubMed] [Google Scholar]
- Voigt T. (1986). Cholinergic amacrine cells in the rat retina. J Comp Neurol, 248(1), 19–35. doi: 10.1002/cne.902480103 [DOI] [PubMed] [Google Scholar]
- Wagner KD, Wagner N, Vidal VP, Schley G, Wilhelm D, Schedl A, … Scholz H. (2002). The Wilms’ tumor gene Wt1 is required for normal development of the retina. EMBO J, 21(6), 1398–1405. doi: 10.1093/emboj/21.6.1398 [DOI] [PMC free article] [PubMed] [Google Scholar]
- Whitney IE, Keeley PW, Raven MA, & Reese BE. (2008). Spatial patterning of cholinergic amacrine cells in the mouse retina. J Comp Neurol, 508(1), 1–12. doi: 10.1002/cne.21630 [DOI] [PMC free article] [PubMed] [Google Scholar]
- Whitney IE, Raven MA, Ciobanu DC, Williams RW, & Reese BE. (2009). Multiple genes on chromosome 7 regulate dopaminergic amacrine cell number in the mouse retina. Invest Ophthalmol Vis Sci, 50(5), 1996–2003. doi: 10.1167/iovs.08-2556 [DOI] [PMC free article] [PubMed] [Google Scholar]
- Xia X, & Ahmad I. (2016). let-7 microRNA regulates neurogliogenesis in the mammalian retina through Hmga2. Dev Biol, 410(1), 70–85. doi: 10.1016/j.ydbio.2015.12.010 [DOI] [PubMed] [Google Scholar]
- Xiang M, Zhou L, Macke JP, Yoshioka T, Hendry SH, Eddy RL, … Nathans J. (1995). The Brn-3 family of POU-domain factors: primary structure, binding specificity, and expression in subsets of retinal ganglion cells and somatosensory neurons. J Neurosci, 15(7 Pt 1), 4762–4785. [DOI] [PMC free article] [PubMed] [Google Scholar]
- Zhang Q, & Wang Y. (2010). HMG modifications and nuclear function. Biochim Biophys Acta, 1799(1–2), 28–36. doi: 10.1016/j.bbagrm.2009.11.009 [DOI] [PMC free article] [PubMed] [Google Scholar]


