

Introduction and Background
Much of the drinking water distribution system infrastructure in the United States has exceeded its life expectancy and is deteriorating. This can lead to increasing challenges for a historically reliable water supply and the provision of barriers designed to prevent system contamination. Given that much of the nation’s drinking water distribution system infrastructure was installed 50 or more years ago, a large proportion of the infrastructure may need to be replaced over the next decades (AWWA 2012). This article provides an overview of relevant information about deteriorating distribution system infrastructure and suggests a conceptual framework for evaluating the potential public health impact from such deterioration. For the purposes of this article, “deterioration” is taken to mean degradation due to age and normal use, but also due to inadequate maintenance, or adverse environmental or water quality conditions (e.g. corrosive soil). A newer system may deteriorate rapidly, with conditions similar to those of a much older system, so that despite the difference in actual ages, the conditions and public health impacts may be the same. In this paper we focus on microbial risks associated with distribution system infrastructure, although there may be other types of risks that could affect water system infrastructure as well.
Deteriorating drinking water distribution systems are prone to a host of problems which may increase the probability of public health issues (Deb et al. 2000). In the United States, much of the drinking water infrastructure is approaching the end of its useful life within the next 30 years (AWWA 2012). Figure 1 shows the projected annual replacement needs for transmission lines and distribution mains for each year between 2000 and 2075. Replacement needs are projected to peak around 2035 with almost 2 percent of the country’s transmission lines and distribution mains in need of replacement (USEPA 2002a). Data from a 2017 survey of utilities in the U.S. and Canada found an annual average main replacement rate of 0.8 percent, in line with the rates projected in 2002 (Folkman 2018). As distribution system infrastructure ages and replacement needs increase over the following decades, infrastructure deterioration can be expected to be of more concern for drinking water utilities.
Figure 1:
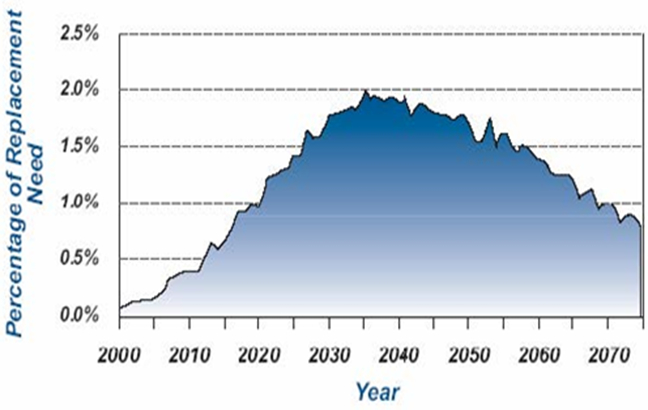
Projected annual replacement needs for transmission lines arid distribution mains 2000-2075, (USEPA 2002a)
The 2015 USEPA Drinking Water Infrastructure Needs Survey and Assessment asked water utilities to estimate their 20-year infrastructure replacement needs (2015 to 2035). The total water infrastructure need amounted to $473 billion, with two thirds of the need ($313 billion) for transmission and distribution systems (USEPA 2018). Storage facility needs make up an additional 10 percent, bringing the total distribution, transmission and storage needs to $360 billion, or 76 percent of the total need. AWWA’s “Buried No Longer” report estimated the funds needed to restore drinking water transmission lines and distribution mains alone from 2011 to 2035 to be over $1 trillion (AWWA 2012). Figure 2 shows how drinking water infrastructure needs have been steadily increasing from 1995 to 2015, with transmission and distribution needs accounting for a consistently large percentage of the total need.
Figure 2:
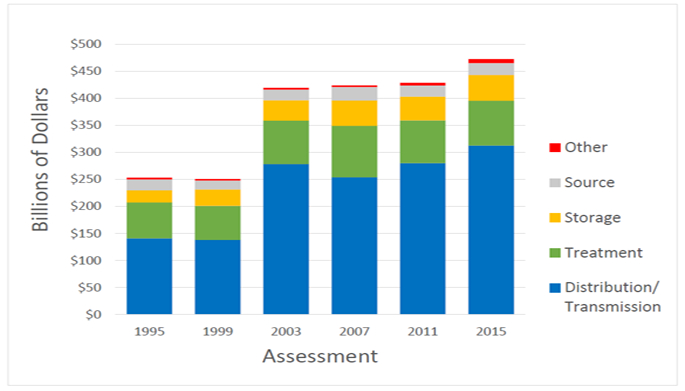
Total 20-Year Need by Project Category for Each Drinking Water Infrastructure Needs Survey and Assessment (in billions of January 2015 dollars) (taken from USEPA 2018)
When infrastructure fails due to deterioration or other causes, the physical integrity of the system is degraded and barriers to potential contamination may be compromised. According to a National Academies of Science report on distribution systems (NRC 2006), the physical integrity of a drinking water distribution system prevents contamination and increases in infrastructure failures can lead to a proportional increase in contamination events. These failures can introduce a wide range of microbial, chemical and radiological contamination to drinking water in distribution systems, and potentially adverse public health outcomes due to their ingestion, inhalation or dermal contact. Failures of these barriers can also lead to the introduction of organic or other matter to distribution systems, which can lead to increased microbial growth by some opportunistic pathogens (e.g., Legionella, Mycobacterium avium complex (MAC)) (NRC 2006). The degree to which deteriorating infrastructure contributes to adverse public health outcomes is difficult to quantify, since many contamination events are not detected or recognized, and the resulting illness or disorder is under-reported, under-recognized or not attributed to drinking water. Nonetheless, a significant percentage of waterborne disease outbreaks may be caused by distribution system deficiencies (NRC 2006).
The question “what are the public health impacts of deteriorating infrastructure?” must be broken down into smaller sub-questions to be answered satisfactorily. These questions include: How might contaminants enter or increase in the distribution system? How do infrastructure conditions influence the vulnerability of distribution systems to contamination and any subsequent public health concern ? To better answer these and other questions, the authors developed a conceptual framework that includes three broad areas of inquiry: contamination mechanisms, infrastructure conditions, and waterborne disease estimates; the parts of this framework are shown conceptually in Figure 3:
Figure 3:
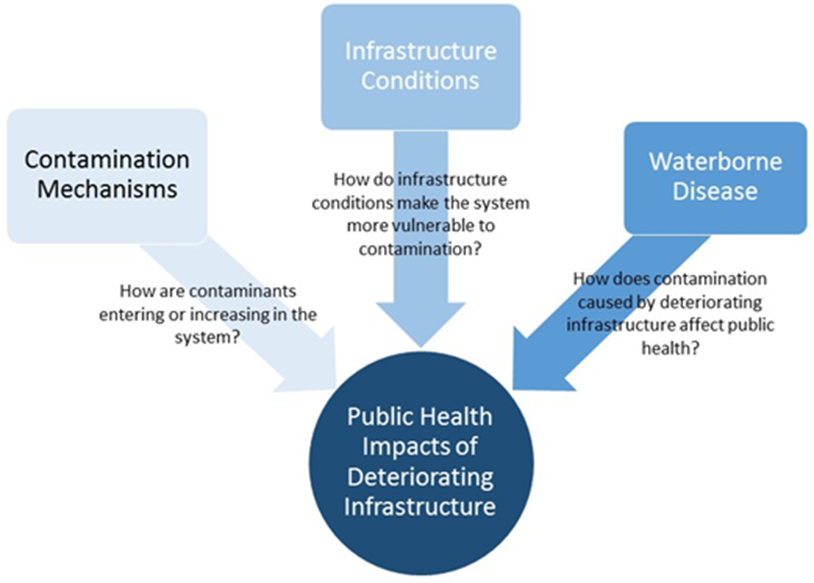
Conceptual Framework
Contamination Mechanisms Associated with Deteriorated Distribution System Infrastructure
Contaminants that affect public health may enter or accumulate within a water distribution system through several different mechanisms or contributing factors, some of which may be exacerbated by infrastructure deterioration. The following mechanisms and factors can contribute to multiple types of contaminants or contaminant mixtures entering a distribution system during a single event:
Intrusion
Corrosion
Biofilms
Sediment
Water Age
Additional relevant mechanisms such as permeation and leaching are discussed briefly. While each mechanism or factor is unique, they may share causes and affect one another. Each mechanism may lead to contamination by itself or contribute to some combination of other means. Figure 4 shows a conceptual representation of these selected contamination mechanisms and illustrates how each influences the others. Other contamination mechanisms not directly related to deteriorating infrastructure, such as backflow, cross-connections, deliberate contamination and treatment breakthrough are outside the scope of this discussion.
Figure 4:

Examples of Relationships between Contamination Mechanisms
Intrusion is the flow of non-potable water into the water distribution system through leakage points or other openings (LeChevallier et al. 2003). In addition to directly allowing contaminants to enter the water system, intrusion events can lead to increased reactive materials (both organic and inorganic) in the distribution system that can decrease disinfectant residual concentrations and leave water vulnerable to subsequent contamination (NRC 2006).
For contaminant intrusion to occur, three conditions need to be met simultaneously: (1) low or negative pressure in the distribution system, (2) physical gaps in infrastructure, such as leaks or breaks, and (3) the presence of contaminants (e.g., bacteria, viruses, and protozoa) outside the distribution system, usually in the form of contaminated ground water or soil.
Water utilities may experience changes in pressure for brief periods of time, commonly referred to as pressure transients. When a pressure transient is negative, the water pressure inside the pipe is lower than the outside pressure and external soil or water can be drawn into the system leading to contamination (LeChevallier et al. 2003, Yang et al. 2011). If the pressure within the system is reduced (but not negative), intrusion may still occur if there is sufficient water pressure external to the pipe, such that contaminants can be ‘pushed’ into the system.
Corrosion refers to the gradual deterioration or destruction of a substance based on a reaction with its surroundings (NRC 2006). Corrosion of metal pipes in drinking water distribution systems can contribute to contamination by creating leaks or physical breaches, which can allow contaminant intrusion. Corrosion can also lead directly to reduced disinfectant residual levels, corrosion product buildup, and reduced aesthetic qualities (e.g. color, taste) (AWWA 2017). Iron corrosion can also lead to increased biofilm growth by providing increased surface areas for the colonization of biofilms, as well as provide a protective niche from the effects of disinfectants (NRC 2006).
Corrosivity of a specific water depends on its chemical properties (e.g., pH, alkalinity, dissolved oxygen, dissolved solids) and physical characteristics (e.g., temperature, flow, velocity), as well as the pipe material (AWWARF 1996). Microorganisms can also promote corrosion by creating areas with different concentrations in oxygen, minerals and metals, and some can catalyze reactions associated with corrosion processes (AWWA 2017). Examples of the types of inorganic contaminants often associated with corrosion include metals such as copper, lead, iron and zinc.
Biofilms are microbiologically-produced organic polymer matrices containing microbes, and organic and inorganic material (USEPA 2002b). They are naturally-occurring and ubiquitous in drinking water distribution systems. Biofilm growth can be enhanced when excess water age results in a lack of an adequate disinfection residual (NRC 2006). Biofilms themselves can increase the disinfectant demand and cause taste and odor issues as well as increase disinfection byproducts (DBPs) (AWWA 2017). In addition, microbial activity in pipe biofilms is one factor that influences the rate of pipe deterioration (Geldreich 1996).
Shear forces can cause biofilm sloughing, changing the microbial composition of the water flowing in the system (Ingerson-Mahar and Reid 2013). Rapid changes in pressure or flow in the system can cause biofilms to slough off the interior surface of pipes and seed biofilm material at downstream locations and enabling microbiologically-influenced corrosion (MIC) to potentially spread. Biofilms can also provide a protective environment for the growth of opportunistic pathogens (e.g., Legionella) (USEPA 2016, 2002b). Examples of the types of microbiological contaminants often associated with biofilms include bacteria such as Escherichia coli, MAC, Legionella, Pseudomonas aeruginosa and Helicobacter pylori; viruses such as Rotavirus, Hepatitis A virus, and Adenovirus; and protozoa such as Naegleria fowleri (USEPA 2002b).
Sediment accumulation occurs within storage facilities and distribution system piping due to still-water conditions which promote particle settling, and sediment depths can range from less than an inch to several feet (Kirmeyer et al. 1999). Particulates in the source water not completely removed by treatment can accumulate as sediment as well as particulates that enter through intrusion. The corrosion of interior surfaces in distribution system piping and appurtenances, as well as storage facilities and equipment within storage facilities (e.g., ladders) can all contribute to sediment accumulation. Additionally, precipitation of inorganic contaminants, including minerals (e.g., calcium, magnesium, iron, manganese) or metals (e.g., lead, copper, vanadium, arsenic) from the interior surfaces of storage facilities and pipes serves as sediment sources (USEPA 2006).
While sediment itself is not necessarily harmful, accumulated sediment in a pipe or storage facility can harbor contaminants that enter through infrastructure breaches or pipes during pressure changes and subsequently enter the storage facility or piping. Sediments can also contain nutrients that can be a food source for pathogens living in the distribution system, and sediments promote biofilm growth, which can protect pathogens from disinfectant residuals (USEPA 2006).
Water age typically refers to the amount of time water travels from the end of the treatment process to a given point in the distribution system (AWWA 2017). As water ages, disinfectant residuals break down, eventually disappearing entirely as the disinfectant is consumed (Rossman 1994). The disinfectant residual decay rate depends on many variables including pipe material, disinfectant type and dose, temperature, pipe surface area, and presence of re-chlorination (USEPA 2002c). The presence of contaminants (e.g., from intrusion) or biofilms can also result in a decrease of the disinfectant concentration. Increased water age is also associated with increased DBP levels, biofilm growth, and increased corrosion (USEPA 2002c).
Permeation is the passage of chemical constituents (e.g., gasoline-range organics) from outside of the distribution system through the distribution system material and into the finished water inside the pipes (USEPA 2002d). While this is typically considered as a potential concern in plastic, non-metallic pipes, it can also occur through fittings, appurtenances, and some storage facilities (USEPA 2002d). Permeation can result in premature aging of distribution systems.
Leaching is the dissolution of material into the drinking water and can lead to the contamination of water by metals, organic contaminants or asbestos (USEPA 2002d). Unlike permeation, the leaching process is internal to the distribution system and does not involve the introduction of outside contaminants. Pipe walls, valves, joints, gaskets and other appurtenances can all leach material into water.
Drinking Water Distribution System Infrastructure Conditions
Drinking water distribution system infrastructure comprises pipes (transmission lines and distribution mains), storage facilities, valves, pumps and other appurtenances (e.g., pressure regulators, bulk meters). Each infrastructure component is vulnerable to different contamination mechanisms as it deteriorates. Customer service lines can experience some of the same problems as distribution system piping. Lead and galvanized steel customer service lines in particular can also serve as a source of contamination through corrosion.
Utilities may implement asset management programs to help make prudent, economically justified decisions regarding investment in distribution system infrastructure. Age alone is not a sufficient indicator of the need for infrastructure replacement, but through asset management, utilities document the condition and failure history of their piping network and other assets to make better informed investment decisions. However, the report for the 2015 Drinking Water Infrastructure Survey and Needs Assessment notes: “Many utilities are only in the very early stages of developing an asset management program, as evidenced by the reliance of most survey respondents on the survey’s baseline pipe replacement rate (USEPA 2018).”
Pipes
Pipes make up the largest portion of infrastructure in a drinking water distribution system, and as they deteriorate they become vulnerable to each of the contamination mechanisms described previously. A 2017 survey of water utilities in the U.S. and Canada (Folkman 2018) found that over 16 percent of installed water mains are in service beyond their useful lives (up from 8 percent in a similar 2012 survey conducted by Folkman). This is consistent with findings in the same survey that pipes are being replaced at an average rate of once every 125 years, well beyond the useful life for many pipe materials.
It has been estimated that U.S. water utilities experience approximately 250,000 to 300,000 main breaks per year, which corresponds to approximately 25–30 breaks per 100 miles of pipe per year (Rogers and Grigg 2009). Factors that can lead to main breaks include pipe age, pressure changes, corrosion, seismic activity, soil expansion and inadequate bedding material (Deb et al. 2000). Folkman (2018) calculated a main break rate of 14 breaks per 100 miles per year from utilities surveyed. This is lower than the national U.S. estimate but represents a 27 percent increase from 2012 data.
Unlined iron pipes in drinking water distribution networks can develop extensive internal corrosion scales as they age. Corrosion can also occur on unprotected external surfaces of pipes. An increased association of MIC and deteriorating infrastructure has been observed regarding copper, iron and steel pipes (Dutkiewicz and Fallowfield 1998, Percival et al. 1998, Mittelman 2003). Ultimately, MIC originating in biofilms can cause pipe leaks, leading to contamination through intrusion or by breaks. The number of corrosion-related failures can increase exponentially as pipes age (USEPA 2009).
While pipes of all ages and types can have biofilms, in general older pipes tend to have more biofilms. Biofilm occurrence has been shown to increase in iron pipes that are more than 50 years old (Geldreich 1996). A wide variety of distribution system materials can be colonized by bacteria, and support microbial growth, including rubber, silicon, polyvinyl chloride (PVC), polyethylene (PE) and bituminous coatings (USEPA 2002b). Plastic pipes are generally regarded as being less susceptible to biofilm-related problems but biofilms can still occur, although at lower concentrations than steel or iron pipes (Yu et al. 2010).
Valves, pumps and other appurtenances
While pipes make up much of distribution system infrastructure and are likely have the greatest potential to impact public health from deterioration, there can also be increased risks from deterioration of other distribution system components, including valves, pumps, hydrants, and meters. As with pipes, these components are susceptible to corrosion (if made of metal) and biofilms. However, there are other risks of deterioration associated specifically with these infrastructure components.
Neglecting the operation and maintenance of valves can lead them to become inoperable (AWWA 2005). Inoperable (or unmapped) valves may lead to increased water age in portions of the distribution system as well as unexpected pressure changes. For example, in 2015, the city of Houston, TX experienced widespread distribution system water quality problems due to high water age including low disinfectant residuals, total coliform positives, and nitrification. The high water age was partially attributed to valves that were inoperable due to deterioration or found to be in the incorrect position (i.e., closed instead of open) (Smith 2016). The inoperable valves created areas of high water age that was difficult to move water through.
As with valves, if a hydrant remains unused over time, sediment and debris can build up, causing it to become encrusted and reduce discharge flow. In addition to regular fire hydrant maintenance, flushing programs typically exercise hydrants when they are opened to remove contaminated water (or water with high water age) from nearby mains. Hydrants must be able to open whenever the need for flushing arises, but if an issue arises and a hydrant can’t be closed, the high volume of flow can cause drops in pressure for the surrounding pipe network, possibly leading to intrusion or pipe breaks (NRC 2006).
Systems that cannot rely on gravity alone are pressurized using pumping booster stations that are often connected to the electrical grid. For these systems, power failure is therefore another potential cause of a low or negative pressure event and subsequent intrusion of contaminated water into pipes with leaky joints or cracks. As pumps age they may be less energy efficient and require more repairs which could lead to more shutdowns and low-pressure events, possibly leading to an increase in intrusion events. Similarly, as the electrical grid ages, the occurrence of power outages, which may lead to pressure losses, could be expected to increase.
Storage Facilities
Finished water storage facilities contain a large volume of water, so degradation of these facilities has the potential to impact the health of numerous people. Unlike distribution system piping, storage facilities are generally not pressurized, meaning contamination can occur whenever there is a breach in the storage facility structure regardless of system pressure. Storage facilities are also the only place in the distribution system where water can be in direct access with the ambient environment through vents, overflows and (unintended) breaches.
Breaches in a tank’s integrity can have severe public health consequences, as was observed in Gideon, MO and Alamosa, CO where breaches in tanks allowed contaminants to enter the drinking water supply and caused widespread illness and some fatalities (Falco & Williams 2009, Angulo et al. 1997). Storage facilities may be at risk for breaches caused by corrosion, especially above-ground or elevated metal tanks that are exposed to air and precipitation in addition to any internal corrosion.
Storage tanks can also provide a habitat for microbial growth (NRC 2006). Infrequent and/or inadequate cycling of the storage facility can lead to a longer water age, providing an environment suitable for microbial growth. This microbial growth can occur in biofilms or in sediments accumulated at the bottom of a tank. In the event that water is rapidly drained from the storage facility, such as in the cases of hydrant use or a main break, these sediments and biofilms can become dislodged and enter the distribution system, introducing a large amount of microbial contaminants in a short amount of time. Some contaminants that have been found in sediments include MAC, Legionella, cesium-133, and lindane (Ho et al. 2016). In New Jersey several cases of Legionellosis were attributed to lack of maintenance and low flow conditions in a storage tank that resulted in low disinfectant residual levels and increased sedimentation (Cohn et al., 2015).
Waterborne Disease
While there is significant difficulty in quantifying the public health impacts related to deteriorating distribution system infrastructure, several approaches can be used to provide estimates. These include using waterborne disease outbreak information to establish the potential extent of an adverse public health outcome, the examination of published reports or studies on waterborne disease (e.g., epidemiological studies), and modeled estimates of waterborne disease. Each of these approaches has its own strengths and weaknesses, but used together, they provide a better picture of the potential public health impacts related to deteriorating infrastructure.
Waterborne Disease Outbreaks
Waterborne disease outbreaks (WBDOs) attributed to drinking water are defined by the CDC as two or more persons having experienced a similar illness attributable to drinking water (Craun et al. 2006); however, this criterion is waived for single laboratory-confirmed cases of primary amebic meningoencephalitis and for single chemical poisoning cases that are supported by water quality data. The CDC has maintained voluntary surveillance and reporting (annual and biennial) for WBDOs in the United States since 1971. Data collected for each outbreak include information on the number of cases of illness, hospitalizations and deaths, the suspected or confirmed etiologic agent, the implicated water source, and the exposure setting.
The authors analyzed published CDC outbreak surveillance reports for the years 1995 and 2014 (the most recent year of data reported). Between 1995 and 2014 there have been 43 WBDOs attributed to drinking water distribution system deficiencies, resulting in over 4,800 cases of illness (CDC 2017, 2015a, 2013, 2011, 2008, 2006, 2004, 2002, 2000, 1998). The number of outbreaks and cases varies greatly from year to year. In the last 10 years of reporting (2005–2014) distribution system-related deficiencies accounted for 14 percent of total outbreaks (not including Legionella related), but accounted for 35 percent of total cases of non-Legionella illness, indicating the potential for distribution system deficiencies to cause widespread illness (CDC 2017, 2015a, 2013, 2011, 2008). Legionella related outbreaks have accounted for a growing percentage of WBDOs since they were first included in surveillance reports in 2001. Since these outbreaks are classified by CDC as their own category of deficiency, it was not possible in this analysis to determine how many could be attributed to distribution system deficiencies.
The World Health Organization (WHO) conducted a meta-analysis of CDC WBDO reports between 1981 and 2010 in the United States and noted the system faults and type of contaminant associated with WBDOs attributed to distribution system deficiencies, shown in Figure 5 (WHO 2014). The results only include distribution system related outbreaks and do not include Legionella outbreaks. Many of these system faults are associated with deteriorating infrastructure, especially water main breaks and repairs. However, it is not clear from the data how many WBDOs could be attributed directly to deteriorating infrastructure.
Figure 5:
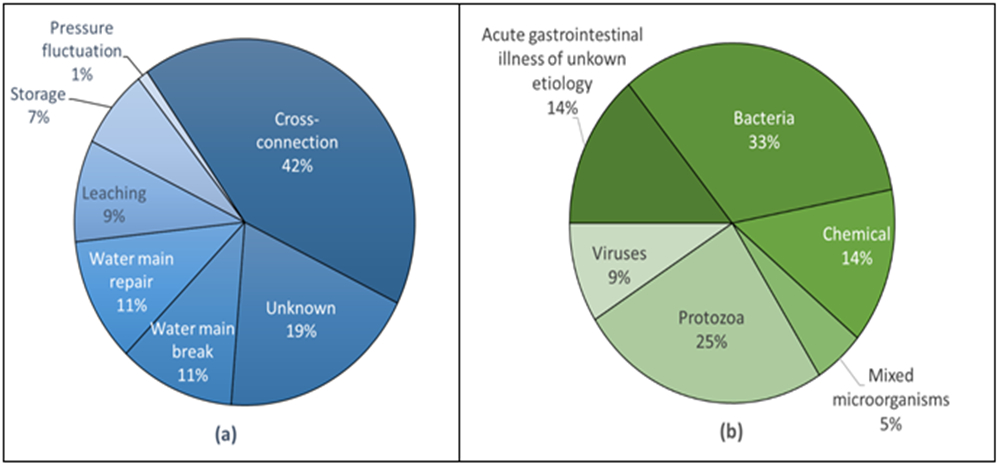
Waterbome Outbreaks Associated with Distribution Systems in the U.S., 1981-2010, (a) by system fault and (b) etiology (adapted from WHO 2014)
Notable outbreaks associated with aging and/or deteriorating infrastructure include those recorded in Alamosa CO, Gideon MO, and Cabool MO. In Alamosa CO, it was found that a ground-level storage reservoir had several small holes and cracks, providing a pathway for Salmonella from animal feces that resulted in 442 documented illnesses and one death, with up to 1,300 cases of illness estimated (Falco & Williams 2009). In the Gideon, MO water system, Salmonella from animal feces also entered holes on a poorly maintained storage tank, resulting in an estimated 650 cases of illnesses (including 44 percent of the city’s population at that time) and seven deaths (Angulo et al. 1997). Weather conditions may further exacerbate public health impacts from deteriorating infrastructure; during a cold winter in Cabool, MO, multiple water main breaks resulted in E. coli O157:H7 contamination of the water system. The outbreak resulted in 243 cases of documented illness and four deaths (Geldreich et al. 1992).
There are limitations associated with WBDO reporting, and data from current surveillance systems don’t provide a quantitative estimate of national risk from drinking water. Limitations associated with WBDO reporting include the following: (1) surveillance and reporting varies across states and localities; (2) incomplete detection, investigation and reporting of outbreaks; (3) difficulty of detecting drinking water outbreaks because most people have daily exposure to tap water; and (4) gaps in the types of data that are systematically collected and reported during outbreak investigations (CDC 2015a, 2011). Some surveillance systems may miss smaller outbreaks, and persons with gastrointestinal illness often do not seek health care, especially if symptoms are mild. Additionally, some agents such as Cryptosporidium and E. coli are not typically tested for by physicians, and mild-to-moderate illness may often be misdiagnosed.
Epidemiological Studies
In addition to WBDO data, epidemiological studies can provide valuable information linking waterborne disease to probable causes, albeit typically at a local rather than national scale. Issues related to deteriorating infrastructure can result in illness independent of a recognized waterborne disease outbreak. For instance, intrusion events could be related to an endemic level of illness (NRC 2006). Endemic illness is illness that is present in a population at all times even in the absence of reported outbreaks. This type of illness can be better characterized by epidemiology studies than outbreak data with study participants typically self-reporting cases of gastrointestinal illness over a period of time.
Ercumen, Gruber and Colford Jr. (2014) conducted a meta-analysis of epidemiological studies to investigate the relationship between distribution system deficiencies and risk of endemic waterborne illness in consumers of tap water. The meta-analysis included studies examining the effects of pressure loss and main breaks (e.g. Nygård et al. 2007) as well as studies comparing distribution system water and water treated at point of use. The study’s findings suggested that tap water consumption is associated with endemic gastrointestinal illness in systems with malfunctioning distribution systems, including specific distribution-related deficiencies, such as loss of pipe integrity, water outages, inadequate disinfection residual and loss of pressure. The authors recognize significant heterogeneity among study settings and water system characteristics, even within study subgroups (Ercumen et al. 2014).
A recent epidemiological study conducted in Sweden found an elevated risk of gastrointestinal illness associated with drinking water distribution incidents such as pipe breaks and repairs, and low-pressure events (Säve-Söderbergh et al. 2017). This study found that the duration of low pressure events did not significantly affect risk when compared to the proximity of sewage pipes to drinking water pipes. Interestingly, the authors found that system flushing after incidents resulted in a higher risk of illness, and they suggested that perhaps additional safety measures may need to be taken beyond flushing. The CDC is currently conducting a study on the health effects associated with low-pressure events in drinking water distribution systems (CDC 2015b). They have observed numerous low-pressure events in five drinking water systems in the United States and are currently collecting data. This study will help inform the relationship between low-pressure events (which may be exacerbated by deteriorating infrastructure) and public health.
Most of the epidemiological studies from North America and Europe examined for this study showed a negative impact on public health from deficiencies in distribution systems. In many of the studies there was evidence that deficiencies impacted public health, particularly main breaks, water age and low-pressure events. As these deficiencies increase with distribution system deterioration, these studies provide evidence that deterioration of distribution system infrastructure poses an increased risk to public health.
Public Health Models and Estimates
Public health models and estimates are additional tools for evaluating the public health impacts of deteriorating infrastructure. A 2006 national estimate of waterborne disease by Messner et al. (2006) gives an estimate of the number of annual cases of acute gastrointestinal illness (AGI) that can be attributed to issues in community water systems associated with either source water and treatment, or distribution systems. This national estimate gives a mean of 0.06 cases of waterborne AGI per person per year, with 50 percent of the risk attributed to distribution systems. Other studies based on data from Norway and Canada estimate between 14 percent and 40 percent of waterborne AGI can be attributed to distribution system risks (Murphy et al. 2016, Nygård et al. 2007, Payment et al. 1997). These estimates attribute risks to distribution system deficiencies generally but do not specify the type of deficiency or whether infrastructure deterioration is a root cause.
With sufficient data, modeling could estimate the public health impact of any of the contamination mechanisms caused by deteriorating infrastructure, but a review of the literature found modeling studies dealing with only intrusion. However, as with epidemiological studies, the number of modeling studies dealing directly with deteriorating infrastructure is limited. Several authors have explored models of public health impacts from intrusion (Teunis et al. 2010, Yang et al. 2011, Besner et al. 2011) and pipe breaks (Shortridge & Guikema 2014).
The model developed by Teunis et al. (2010) demonstrated a small probability of consuming contaminated water due to virus intrusion events, but when intrusion occurs the virus concentration is often high so the risk can be significant. The results of a quantitative microbial risk assessment (QMRA) to identify factors for the public health impacts associated with pathogen intrusion found that the duration of a negative pressure event as well as the total number of places where negative pressure occurs in the distribution system were the most sensitive for the model (Yang et al. 2011). Besner, Prevost and Regli (2011) developed a conceptual framework for modeling the public health risk from intrusion events and identified data needs and challenges associated with each portion of the process. This framework could be adapted to focus on deterioration of infrastructure. Shortridge and Guikema (2014) compared pipe break data with internet search data and found a positive correlation between pipe breaks and searches for gastrointestinal illness symptoms in several cities.
Given the weaknesses in WBDO reporting and the time and expense needed to conduct epidemiological studies, the authors suggest a modeling approach for estimating the amount of waterborne illness caused by deteriorating distribution system infrastructure in the U.S. However, this modeling approach should be supported by WBDO and epidemiological data. Further research is needed to determine appropriate proxies for infrastructure deterioration (e.g. pipe age, main failure rates, water system budgets) and to gather data on a national scale associated with these proxies. Once an estimate of system deterioration in the U.S. is made, the relationship between deterioration occurrence and disease incidence could be further refined. All of this is complicated by the fact that water system deterioration is not a guarantee of drinking water contamination, and contamination itself is not a guarantee of illness. Further research is needed to reasonably model these relationships.
Conclusions
Water distribution system infrastructure is aging and deteriorating, affecting the ability of drinking water systems to provide safe drinking water. Drinking water distribution system deterioration can affect the water supply and reliability as well as water quality and public health. As systems deteriorate, main breaks, pressure losses, biofilm accumulation, and other deficiencies become more likely, potentially endangering drinking water quality and public health. Several waterborne disease outbreaks have occurred in the U.S. due to distribution system deficiencies, and more may occur in the coming years. It is possible that deteriorating drinking water distribution system infrastructure has resulted in other cases of disease and illness in addition to reported waterborne disease outbreaks.
We have presented a multi-faceted approach that could be used to better understand the public health impacts related to deteriorating distribution system infrastructure including an examination of contamination mechanisms, infrastructure conditions and waterborne diseases. This general approach could also support the need for infrastructure funding and upgrades. We note several areas where additional studies and data would be helpful to further inform an estimate of the risk of deteriorating drinking water distribution system infrastructure to public health. This additional data and the conceptual framework outlined here could help inform a model of public health impacts due to deterioration of distribution system infrastructure.
Rehabilitation and replacement of deteriorating distribution system infrastructure will mitigate negative impacts to public health. Drinking water utilities that are interested in funding opportunities for rehabilitating or replacing deteriorating distribution system infrastructure may want to explore financing programs like the US EPA’s Water Infrastructure Finance and Innovation Act (WIFIA) program as well as the Drinking Water State Revolving Fund.
Acknowledgements:
The authors would like to thank our colleagues at the US Environmental Protection Agency Peter Shanaghan, Crystal Rodgers-Jenkins, and Ryan Albert for their encouragement and thoughtful feedback as this paper was developed.
Footnotes
Disclaimer
The views expressed in this article are those of the individual authors and do not necessarily reflect the views and policies of the US Environmental Protection Agency. The article has been subject to the Agency’s peer review and approved for publication.
REFERENCES
- Angulo FJ; Tippen S; Sharp DJ; Payne BJ; Collier C; Hill JE; Barrett TJ; Clark RM; Geldreich EE; Donnell HD Jr & Swerdlow DL, 1997. A community waterborne outbreak of salmonellosis and the effectiveness of a boil water order. American Journal of Public Health, 87:4:580–584. [DOI] [PMC free article] [PubMed] [Google Scholar]
- AWWA, 2017. Manual of Water Supply Practices, M68 Water Quality in Distribution Systems. AWWA, Denver. [Google Scholar]
- AWWA, 2012. Buried No Longer: Confronting America’s Water Infrastructure Challenge. AWWA, Denver. [Google Scholar]
- AWWA, 2005. Water Distribution Operator Training Handbook. AWWA, Denver. [Google Scholar]
- AWWARF (American Water Works Association Research Foundation), DVGW-TZW (German Technical and Scientific Association for Gas and Water-Water Technology Center), 1996. Internal Corrosion of Water Distribution Systems. AWWARF, Denver. [Google Scholar]
- Besner MC; Prevost M & Regli S, 2011. Assessing the public health risk of microbial intrusion events in distribution systems: conceptual model, available data, and challenges. Water Research, 45:3:961–979. [DOI] [PubMed] [Google Scholar]
- CDC (Centers for Disease Control and Prevention), 2017. Surveillance for waterborne disease outbreaks associated with drinking water – United States, 2013–2014. Morbidity and Mortality Weekly Report, 66:44:1216–1221. [DOI] [PMC free article] [PubMed] [Google Scholar]
- CDC, 2015a. Surveillance for Waterborne Disease Outbreaks Associated with Drinking Water – United States, 2011–2012. Morbidity and Mortality Weekly Report, 64:31:842–848. [DOI] [PMC free article] [PubMed] [Google Scholar]
- CDC, 2015b. CDC Water and Health Study. www.cdc.gov/healthywater/study.html (accessed March 15, 2018).
- CDC, 2013. Surveillance for Waterborne Disease Outbreaks Associated with Drinking Water and Other Nonrecreational Water – United States, 2009–2010. Morbidity and Mortality Weekly Report, 62:35:714–721. [PMC free article] [PubMed] [Google Scholar]
- CDC, 2011. Surveillance for Waterborne Disease Outbreaks Associated with Drinking Water – United States, 2007–2008. Morbidity and Mortality Weekly Report Surveillance Summaries, 60:12:39–68. [PubMed] [Google Scholar]
- CDC, 2008. Surveillance for Waterborne Disease Outbreaks Associated with Drinking Water and Water not Intended for Drinking – United States 2005–2006. Morbidity and Mortality Weekly Report, 57:SS-9:39–69. [PubMed] [Google Scholar]
- CDC, 2006. Surveillance for Waterborne Disease Outbreaks Associated with Drinking Water and Water not Intended for Drinking – United States 2003–2004. Morbidity and Mortality Weekly Report, 55:SS-12:31–65. [PubMed] [Google Scholar]
- CDC, 2004. Surveillance For Waterborne Disease Outbreaks Associated with Drinking Water – United States 2001–2002. Morbidity and Mortality Weekly Report, 53:SS-8:39–43. [PubMed] [Google Scholar]
- CDC, 2002. Surveillance for Waterborne-Disease Outbreaks – United States 1999–2000. Morbidity and Mortality Weekly Report, 51:SS-8:2–44. [PubMed] [Google Scholar]
- CDC, 2000. Surveillance for Waterborne-Disease Outbreaks – United States 1997–1998. Morbidity and Mortality Weekly Report, 49:SS-4:2–32. [PubMed] [Google Scholar]
- CDC, 1998. Surveillance for Waterborne-Disease Outbreaks – United States 1995–1996. Morbidity and Mortality Weekly Report, 47:SS–5 [PubMed] [Google Scholar]
- Cohn PD; Gleason JA; Rudowski E; Tsai SM; Genese CA & Fagliano JA, 2015. Community outbreak of legionellosis and an environmental investigation into a community water system. Epidemiology & Infection, 143:6:1322–1331. [DOI] [PMC free article] [PubMed] [Google Scholar]
- Craun MF; Craun GF; Calderon RL & Beach MJ, 2006. Waterborne outbreaks reported in the United States. Journal of Water and Health, 4:S2:19–30. [DOI] [PubMed] [Google Scholar]
- Deb AK; Momberger KA; Hasit YJ; & Grablutz FM, 2000. Guidance for Management of Distribution System Operation and Maintenance. American Water Works Association Research Foundation, Denver. [Google Scholar]
- Dutkiewicz C & Fallowfield H, 1998. Assessment of microbial involvement in the elevation of copper levels in drinking water. Journal of Applied Microbiology, 85:3:597–602. [DOI] [PubMed] [Google Scholar]
- Ercumen A; Gruber JS & Colford JM Jr, 2014. Water distribution system deficiencies and gastrointestinal illness: a systematic review and meta-analysis. Environmental Health Perspectives, 122:7:651. [DOI] [PMC free article] [PubMed] [Google Scholar]
- Falco R & Williams SI, 2009. Waterborne Salmonella outbreak in Alamosa, Colorado, March and April 2008: Outbreak Identification, Response, and Investigation. Colorado Department of Public Health and Environment, Safe Drinking Water Program, Water Quality Control Division. [Google Scholar]
- Folkman S, 2018. Water Main Break Rates in the USA and Canada: A Comprehensive Study, Mechanical and Aerospace Engineering Faculty Publications. Paper 174. https://digitalcommons.usu.edu/mae_facpub/174.
- Geldreich EE; Fox KR; Goodrich JA; Rice EW; Clark RM & Swerdlow DL, 1992. Searching for a water supply connection in the Cabool, Missouri disease outbreak of Escherichia coli O157: H7. Water Research, 26:8:1127–1137. [Google Scholar]
- Geldreich EE 1996. Biofilms in water distribution system Microbial Quality of Water Supply in Distribution Systems. Lewis Publishers, New York. [Google Scholar]
- Ho CK; Christian JM; Ching EJ; Slavin J; Ortega J; Murray R & Rossman LA, 2016. Sediment Resuspension and Transport in Water Distribution Storage Tanks. Journal - American Water Works Association, 108:6. [Google Scholar]
- Ingerson-Mahar M & Reid A, 2013. Microbes in Pipes: The Microbiology of the Water Distribution System. American Society for Microbiology. [PubMed] [Google Scholar]
- Kirmeyer GJ; Kirby L; Murphy BM; Noran PF; Martel KD; Lund TW; Anderson JL & Medhurst R, 1999. Maintaining Water Quality in Finished Water Storage Facilities. AWWA, Denver. [Google Scholar]
- LeChevallier MW; Gullick RW; Karim MR; Friedman M & Funk JE, 2003. The potential for health risks from intrusion of contaminants into the distribution system from pressure transients. Journal of Water and Health, 1:1:3–14. [PubMed] [Google Scholar]
- Messner M; Shaw S; Regli S; Rotert K; Blank V & Soller J, 2006. An approach for developing a national estimate of waterborne disease due to drinking water and a national estimate model application. Journal of Water and Health, 4:S2:201–240. [DOI] [PubMed] [Google Scholar]
- Mittelman MW, 2003. Microbially influenced corrosion of sprinkler piping. Corrosion, 49:13–17. [Google Scholar]
- Murphy HM; Thomas MK; Medeiros DT; McFadyen S & Pintar KDM, 2016. Estimating the number of cases of acute gastrointestinal illness (AGI) associated with Canadian municipal drinking water systems. Epidemiology & Infection, 144:7:1371–1385. [DOI] [PMC free article] [PubMed] [Google Scholar]
- Nygård K; Wahl E; Krogh T; Tveit OA; Bøhleng E; Tverdal A & Aavitsland P, 2007. Breaks and maintenance work in the water distribution systems and gastrointestinal illness: a cohort study. International Journal of Epidemiology, 36:4:873–880. [DOI] [PubMed] [Google Scholar]
- Payment P; Siemiatycki J; Richardson L; Renaud G; Franco E & Prevost M, 1997. A prospective epidemiological study of gastrointestinal health effects due to the consumption of drinking water. International Journal of Environmental Health Research, 7:1:5–31. [Google Scholar]
- Percival SL; Knapp JS; Edyvean R & Wales DS, 1998. Biofilm development on stainless steel in mains water. Water Research 32:1:243–253. [Google Scholar]
- Rogers PD & Grigg NS, 2009. Failure assessment modeling to prioritize water pipe renewal: two case studies. Journal of Infrastructure Systems 15:3:162–171. [Google Scholar]
- Rossman LA; Clark RM & Grayman WM, 1994. Modeling chlorine residuals in drinking-water distribution systems. Journal of Environmental Engineering, 120:4:803–820. [Google Scholar]
- Säve-Söderbergh M, Bylund J, Malm A, Simonsson M and Toljander J, 2017. Gastrointestinal illness linked to incidents in drinking water distribution networks in Sweden. Water Research, 122:503–511. [DOI] [PubMed] [Google Scholar]
- Shortridge JE & Guikema SD, 2014. Public health and pipe breaks in water distribution systems: analysis with internet search volume as a proxy. Water Research, 53:26–34. [DOI] [PubMed] [Google Scholar]
- Smith Kira S., 2016. Disinfectant Residual Management - Utility Perspective & Case Study Proc. 2016 AWWA ACE, Chicago, IL. [Google Scholar]
- NRC (National Research Council), 2006. Drinking Water Distribution Systems: Assessing and Reducing Risks. National Academies Press, Washington. [Google Scholar]
- Teunis PF; Xu M; Fleming KK; Yang J; Moe CL; LeChevallier MW, 2010. Enteric virus infection risk from intrusion of sewage into a drinking water distribution network. Environmental Science and Technology, 44:8561–8566. [DOI] [PubMed] [Google Scholar]
- USEPA (US Environmental Protection Agency), 2018. Drinking Water Infrastructure Needs Survey and Assessment, Sixth Report to Congress. EPA 816-K-17–002, Washington. [Google Scholar]
- USEPA, 2016. Technologies for Legionella control in Premise Plumbing Systems: Scientific Literature Review. EPA 810-R-16–001, Washington. [Google Scholar]
- USEPA, 2013. Drinking Water Infrastructure Needs Survey and Assessment, Fifth Report to Congress. EPA 816-R-13–006, Washington. [Google Scholar]
- USEPA, 2009. Rehabilitation of Wastewater Collection and Water Distribution Systems-State of Technology Review Report. EPA 600-R-09–048, Washington. [Google Scholar]
- USEPA, 2006. Inorganic Contaminant Accumulation in Potable Water Distribution Systems. Total Coliform Rule Issue Paper, Office of Water, Washington. [Google Scholar]
- USEPA, 2002a. The Clean Water and Drinking Water Gap Analysis. EPA 816-R-02–020, Washington. [Google Scholar]
- USEPA, 2002b. Health Risks from Microbial Growth and Biofilms in Distribution Systems. Distribution System White Paper, Office of Water, Washington. [Google Scholar]
- USEPA, 2002c. Effects of Water Age on Distribution System Water Quality. Distribution System Issue Paper, Office of Water, Washington. [Google Scholar]
- USEPA, 2002d. Permeation and Leaching. Distribution System Issue Paper, Office of Water, Washington. [Google Scholar]
- WHO (World Health Organization), 2014. Water Safety in Distribution Systems. WHO Press, Geneva. [Google Scholar]
- Yang J; LeChevallier MW; Teunis PF; & Xu M, 2011. Managing risks from virus intrusion into water distribution systems due to pressure transients. Journal of Water and Health, 9:2:291–305. [DOI] [PubMed] [Google Scholar]
- Yu J; Kim D; & Lee T, 2010. Microbial diversity in biofilms on water distribution pipes of different materials. Water Science and Technology, 61:1:163–171. [DOI] [PubMed] [Google Scholar]