Abstract
Background
Pancreatic cancer (PAC) is a lethal cancer and it is essential to develop accurate diagnostic and prognostic biomarkers for PAC.
Material/Methods
An integrated microarray analysis of PAC was conducted to identify differentially expressed genes (DEGs) between PAC and non-tumor controls. Expression of DEGs were further confirmed by The Cancer Genome Atlas and the Genotype-Tissue Expression. Gene Ontology and Kyoto Encyclopedia of Genes and Genomes enrichment analysis, and protein–protein integration network construction were performed to further research the biological functions of DEGs. Receiver-operating characteristic analysis and survival analysis were used to evaluate the diagnostic and prognostic value of DEGs for PAC.
Results
Seventeen microarray datasets were downloaded from Gene Expression Omnibus to conduct the integrated microarray analysis. A total of 1136 DEGs (596 upregulated and 540 downregulated DEGs) in PAC tissues compared with non-tumor controls were identified. Pancreatic secretion (Kegg: 04972), insulin signaling pathway (Kegg: 04910), and several cancer-related pathways including pathways in cancer (Kegg: 05200), MAPK signaling pathway (Kegg: 04010), and pancreatic cancer (Kegg: 05212) were enriched for DEGs in PAC. Seven DEGs (AHNAK2, CDH3, IFI27, ITGA2, LAMB3, SLC6A14, and TMPRSS4) were found to have both great diagnostic and prognostic value for PAC. High expression of these 7 DEGs were significantly associated with poor prognosis of patients with PAC.
Conclusions
These 7 DEGs might be potential diagnostic and prognostic biomarkers for PAC and help uncovering the mechanism of PAC.
MeSH Keywords: Biological Markers, Diagnosis, Microarray Analysis, Pancreatic Neoplasms, Prognosis
Background
Pancreatic cancer (PAC) is an aggressive cancer and its incidence rate has alarmingly increased worldwide. Moreover, PAC is one of the most lethal cancers, with a 5-year survival rate of less than 9% [1]. PAC was the 7th leading cause of cancer death in both males and females worldwide in 2018 [2]. Despite intensive efforts, the prognosis of PAC remains poor mainly due to the absence of early detection biomarkers and limited effective therapeutic strategies [1,2]. Therefore, there is an urgent need to develop accurate diagnostic and prognostic biomarkers so that the optimal treatments can be selected for patients with PAC and thus offer the best hope for cure or extension of lifespan.
Since clinical and pathological characteristics have limited value in early detection and predicting prognosis for PAC, great effort has been made to explore gene biomarkers for PAC. In recent years, accumulated microarray analysis of PAC have been used to identify differentially expressed genes (DEGs) between PAC and non-tumor controls [3–8]; these studies have made a contribution to discovering the underlying mechanism of PAC and developing biomarkers. Integrated analysis of multiple microarray analysis can help obtain a more accurate profiles of DEGs by using increased sample sizes and avoiding biases induced by different platforms.
Hence, this present study performed an integrated analysis of multiple PAC microarray analyses derived from the GEO to identify accurate DEGs between PAC tissues and non-tumor control tissues. Gene Ontology (GO) and Kyoto Encyclopedia of Genes and Genomes (KEGG) enrichment analysis, and protein–protein integration (PPI) network construction were performed to further research the biological functions of DEGs and the underlying mechanism of PAC. Moreover, the diagnostic and prognostic value of DEGs for PAC was evaluated, which contributes to developing potential biomarkers for PAC.
Material and Methods
Microarray expression profiling of PAC
The Gene Expression Omnibus (GEO) is the largest database of high-throughput gene expression data; it is developed and maintained by the National Center for Biotechnology Information. In this present study, datasets of PAC were searched and downloaded from the GEO (http://www.ncbi.nlm.nih.gov/geo). The inclusion criteria for this study were as follows. First, microarray datasets were expression profiled by array. Second, samples used for microarray datasets were PAC tissues and non-tumor control tissues which included adjacent non-tumor tissues and normal pancreatic tissues.
Identification of DEGs between PAC and non-tumor controls
Background correction and normalization were conducted to minimize the heterogeneity among different datasets enrolled in this integrated analysis. By using metaMA in R [9], we calculated effect sizes from unpaired data either from classical or moderated t-tests (Limma, SMVar) for each study and combined these effect sizes. P-values were corrected separately for multiple test using the false discovery method proposed by Benjamini and Hochberg and the false discovery rate (FDR) was obtained. DEGs between PAC and non-tumor controls were identified with FDR <0.05 and |diff| >0.5. Hierarchical clustering analysis of DEGs was conducted by using R package “pheatmap” (scale=”row”, clustering_method=”complete” and clustering_distance_rows=” euclidean”).
Functional annotation of DEGs
We used the online-based software GeneCoDis3 (http://genecodis.cnb.csic.es/analysis), GO, and KEGG molecular pathway enrichment analysis for DEGs between PAC and non-tumor controls. P-values were adjusted for multiple test using the Benjamini-Hochberg method and the FDR was obtained. Statistical significance was defined as FDR <0.05.
Protein–protein interaction (PPI) network
To determine the PAC-associated pathways and explore functions of proteins at the molecular level, the top 100 upregulated and downregulated DEGs between PAC and non-tumor controls were applied to construct the PPI network based on the STRING database (http://string-db.org) and Cytoscape 3.3.0. Proteins with a degree of ≥20 were defined as hub proteins of the PPI network.
Receiver-operating characteristic (ROC) analysis
To access the diagnostic value of DEGs for PAC, receiver-operating characteristic (ROC) of DEGs and the area under the ROC curve (AUC) were calculated by using the “pROC” package. DEGs with AUC >0.85 were considered to have great diagnostic value for PAC with excellent specificity and sensitivity.
Cross-validation of DEGs
The Cancer Genome Atlas (TCGA) project (https://tcga-data.nci.nih.gov/tcga/) is a public-funded project sponsored by the National Cancer Institute and the National Human Genome Research Institute which stores genomic datasets covering various cancers. The Genotype-Tissue Expression (GTEx) project is a resource database and associated tissue bank for exploring the relationship between genetic variation and gene expression in human tissues [10]. Using R package TCGAbiolinks, the clinical data and gene expression data of 176 pancreatic adenocarcinoma and 167 normal control tissues were downloaded from TCGA and GTEx, respectively. Then, this TCGA-GTEx processed data was used to validate the expression of DEGs identified by this integrated analysis.
Survival analysis
The prognostic value of DEGs for PAC patients was further analyzed based on these 176 patients with pancreatic adenocarcinoma in TCGA by using multivariate Cox regression analyses (adjusted for age, sex, grade and stage).
Results
Identification of DEGs between PAC and non-tumor controls
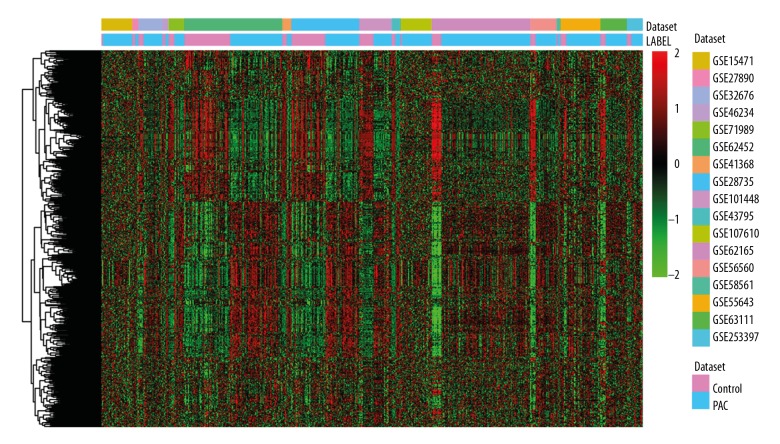
A total of 17 GEO microarray datasets [3–8,11–20] including 512 PAC tissues and 206 non-tumor control tissues were enrolled in this present study (Table 1). Compared with non-tumor controls, 1136 DEGs including 596 upregulated DEGs and 540 downregulated DEGs were identified in PAC. Hierarchical cluster result of DEGs between PAC and non-tumor controls was displayed in Figure 1. Table 2 showed the top 20 upregulated and downregulated DEGs between PAC and non-tumor controls (sorted by FDR).
Table 1.
Gene expression datasets used in this study.
| GEO accession | Control | Case | Platform | Year | Country | Author |
|---|---|---|---|---|---|---|
| GSE107610 | 2 | 39 | GPL15207[PrimeView] Affymetrix Human Gene Expression Array | 2018 | Japan | Shimokawa M. [4] |
| GSE101448 | 19 | 24 | GPL10558Illumina HumanHT-12 V4.0 expression beadchip | 2018 | Germany | Busch H. [5] |
| GSE46234 | 4 | 4 | GPL570[HG-U133_Plus_2] Affymetrix Human Genome U133 Plus 2.0 Array | 2017 | Norway | Ræder H. [12] |
| GSE63111 | 7 | 28 | GPL5188[HuEx-1_0-st] Affymetrix Human Exon 1.0 ST Array [probe set (exon) version] | 2017 | United Kingdom | Wang J. [6] |
| GSE62165 | 13 | 118 | GPL13667[HG-U219] Affymetrix Human Genome U219 Array | 2016 | Belgium | Janky R. [7] |
| GSE62452 | 61 | 69 | GPL6244[HuGene-1_0-st] Affymetrix Human Gene 1.0 ST Array [transcript (gene) version] | 2016 | USA | Hussain P.S. [8] |
| GSE71989 | 8 | 13 | GPL570[HG-U133_Plus_2] Affymetrix Human Genome U133 Plus 2.0 Array | 2015 | USA | Schmittgen T. [13] |
| GSE27890 | 4 | 4 | GPL570[HG-U133_Plus_2] Affymetrix Human Genome U133 Plus 2.0 Array | 2014 | USA | Bowen N.J. [14] |
| GSE56560 | 7 | 28 | GPL5175[HuEx-1_0-st] Affymetrix Human Exon 1.0 ST Array [transcript (gene) version] | 2014 | United Kingdom | Wang J. [9] |
| GSE58561 | 2 | 3 | GPL14550Agilent-028004 SurePrint G3 Human GE 8x60K Microarray (Probe Name Version) | 2014 | Norway | Sandhu V. [15] |
| GSE55643 | 8 | 45 | GPL6480Agilent-014850 Whole Human Genome Microarray 4x44K G4112F (Probe Name version) | 2014 | United Kingdom | Jamieson N.B. [16] |
| GSE23397 | 6 | 15 | GPL5188[HuEx-1_0-st] Affymetrix Human Exon 1.0 ST Array [probe set (exon) version] | 2013 | Germany | Holzmann K. |
| GSE41368 | 6 | 6 | GPL6244[HuGene-1_0-st] Affymetrix Human Gene 1.0 ST Array [transcript (gene) version] | 2013 | Italy | Colombo T. [17] |
| GSE43795 | 5 | 7 | GPL10558Illumina HumanHT-12 V4.0 expression beadchip | 2013 | South Korea | Park N. [18] |
| GSE28735 | 45 | 45 | GPL6244[HuGene-1_0-st] Affymetrix Human Gene 1.0 ST Array [transcript (gene) version] | 2012 | USA | Hussain P. [19] |
| GSE32676 | 7 | 25 | GPL570[HG-U133_Plus_2] Affymetrix Human Genome U133 Plus 2.0 Array | 2011 | USA | Tran L.M. [20] |
| GSE15471 | 39 | 39 | GPL570[HG-U133_Plus_2] Affymetrix Human Genome U133 Plus 2.0 Array | 2009 | Romania | Badea L. [21] |
Figure 1.
Hierarchical clustering analysis of DEGs between PAC and non-tumor controls. Row and column represented DEGs and tissue samples, respectively. The color scale indicated the expression of DEGs while red and green color represented upregulation and downregulation, respectively. DEGs – differentially expressed genes; PAC – pancreatic cancer.
Table 2.
Top 20 up- and down-regulated DEGs between pancreatic cancer and non-tumor controls.
| Gene ID | Gene symbol | Diff | Regulation | Gene id | Gene symbol | Diff | Regulation |
|---|---|---|---|---|---|---|---|
| 6286 | S100P | 1.851675 | Up | 5407 | PNLIPRP1 | −2.52947 | Down |
| 4680 | CEACAM6 | 1.809022 | Up | 1358 | CPA2 | −2.44332 | Down |
| 1048 | CEACAM5 | 1.74063 | Up | 1208 | CLPS | −2.30786 | Down |
| 3918 | LAMC2 | 1.619369 | Up | 5408 | PNLIPRP2 | −2.29361 | Down |
| 10103 | TSPAN1 | 1.592894 | Up | 5319 | PLA2G1B | −2.27519 | Down |
| 11254 | SLC6A14 | 1.51112 | Up | 5406 | PNLIP | −2.26446 | Down |
| 11199 | ANXA10 | 1.504241 | Up | 1357 | CPA1 | −2.24956 | Down |
| 6364 | CCL20 | 1.491776 | Up | 11330 | CTRC | −2.10615 | Down |
| 3429 | IFI27 | 1.47296 | Up | 2813 | GP2 | −2.10261 | Down |
| 56649 | TMPRSS4 | 1.455704 | Up | 440387 | CTRB2 | −2.10088 | Down |
| 3880 | KRT19 | 1.44997 | Up | 1360 | CPB1 | −2.09227 | Down |
| 1728 | NQO1 | 1.398528 | Up | 5968 | REG1B | −2.01307 | Down |
| 10874 | NMU | 1.39464 | Up | 50624 | CUZD1 | −1.98905 | Down |
| 22943 | DKK1 | 1.347667 | Up | 1506 | CTRL | −1.98238 | Down |
| 51208 | CLDN18 | 1.343661 | Up | 121506 | ERP27 | −1.87554 | Down |
| 195814 | SDR16C5 | 1.342804 | Up | 5276 | SERPINI2 | −1.80644 | Down |
| 2877 | GPX2 | 1.326222 | Up | 213 | ALB | −1.73523 | Down |
| 7031 | TFF1 | 1.298329 | Up | 8671 | SLC4A4 | −1.73172 | Down |
| 4312 | MMP1 | 1.296652 | Up | 2494 | NR5A2 | −1.64221 | Down |
| 29089 | UBE2T | 1.289073 | Up | 5166 | PDK4 | −1.62103 | Down |
Diff – mean expression of pancreatic cancer minus mean expression of non-tumor controls.
Functional annotation
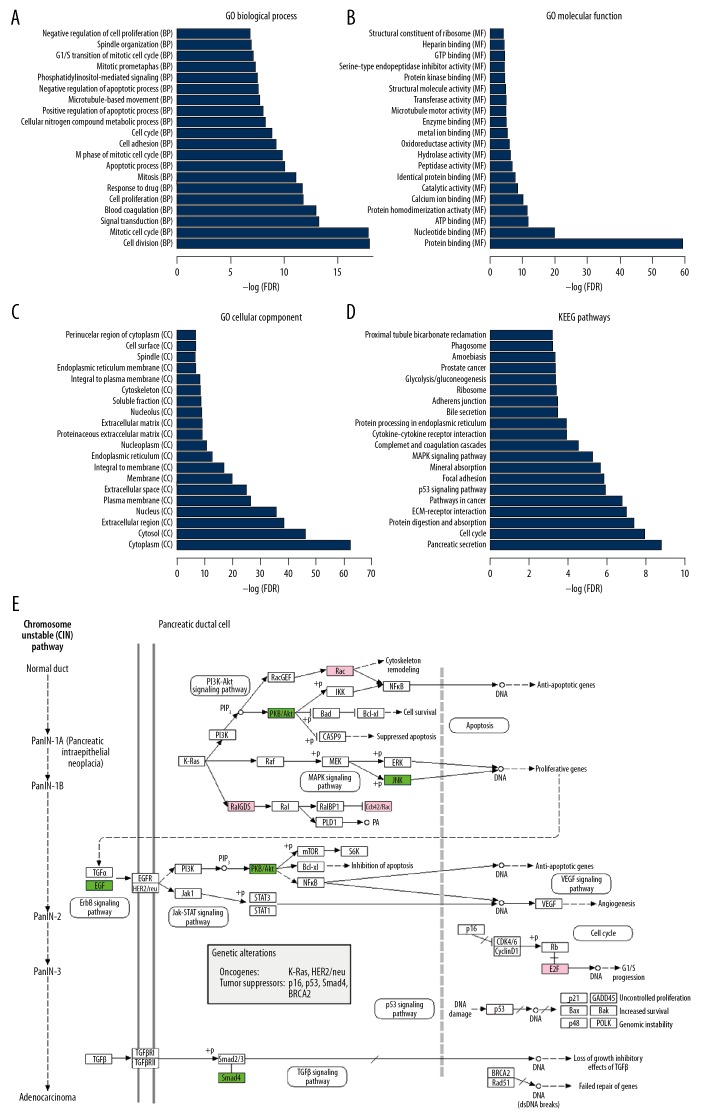
Cell proliferation (GO: 0008283, FDR=1.60E-12), Apoptotic process (GO: 0006915, FDR=9.49E-11), Cytoplasm (GO: 0005737, FDR=1.14E-62), Protein binding (GO: 0005515, FDR=1.16E-59), and Microtubule motor activity (GO: 0003777, FDR=7.65E-06) were significantly enriched GO terms for DEGs between PAC and non-tumor controls. The top 20 most significantly enriched GO terms including “biological process”, “molecular function”, and “cellular component” were displayed in Figure 2A–2C.
Figure 2.
Significantly enriched GO terms and KEGG pathways in PAC. (A–D) The top 20 significantly biological process, molecular function, cellular component and KEGG pathways enriched for DEGs in PAC are displayed. The y-axis shows GO terms or KEGG pathways and the x-axis represents -logFDR. (E) Shows pancreatic cancer (Kegg: 05212). Pink and green rectangles represented the particles that regulated by the upregulated and downregulated DEGs between PAC and non-tumor controls, respectively. DEGs – differentially expressed genes; PAC – pancreatic cancer; GO – Gene Ontology; KEGG – Kyoto Encyclopedia of Genes and Genomes.
After KEGG enrichment analysis, pancreatic secretion (Kegg: 04972, FDR=7.12E-12), pathways in cancer (Kegg: 05200, FDR=1.63E-07), p53 signaling pathway (Kegg: 04115, FDR=1.19E-06), MAPK signaling pathway (Kegg: 04010, FDR=5.13E-06), Insulin signaling pathway (Kegg: 04910, FDR=0.0076) and pancreatic cancer (Kegg: 05212, FDR=0.0264) were significantly enriched pathways for DEGs between PAC and non-tumor controls (Figure 2D). Three upregulated DEGs (RALGDS, E2F3, and RAC1) and 4 downregulated DEGs (EGF, SMAD4, MAPK9, and AKT1) were enriched in pancreatic cancer (Kegg: 05212, Figure 2E).
PPI network
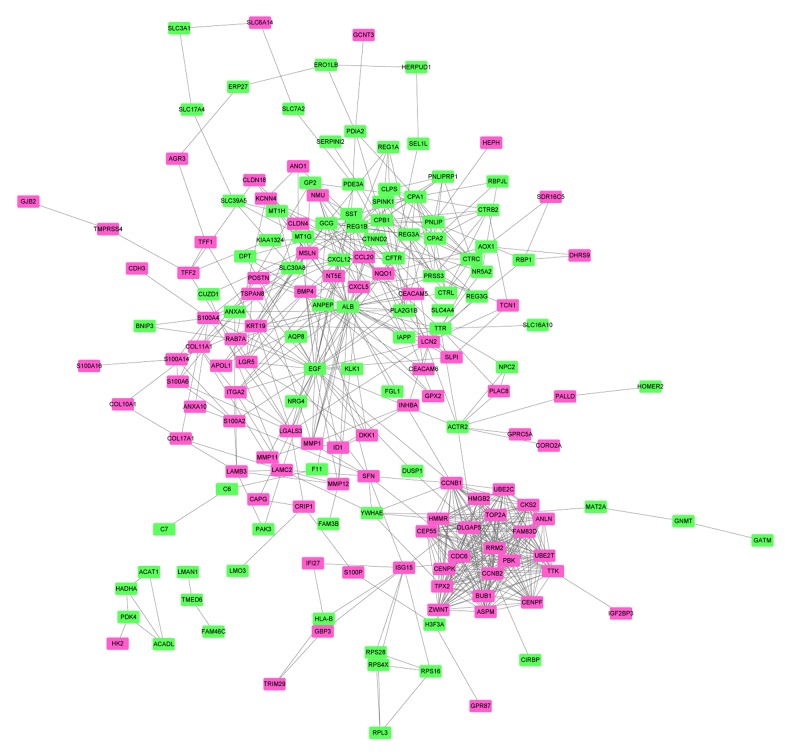
The PPI network of top 100 upregulated and downregulated DEGs consisted of 174 nodes and 612 edges (Figure 3). Two hub proteins, ALB (degree=34) and BGF (degree=33), were identified based on this PPI network.
Figure 3.
PPI network. Rosy and green rectangles represent proteins encoded by upregulated and downregulated DEGs, respectively. Edges indicate integrations between proteins. PPI – protein–protein integration; DEGs – differentially expressed genes.
ROC analysis
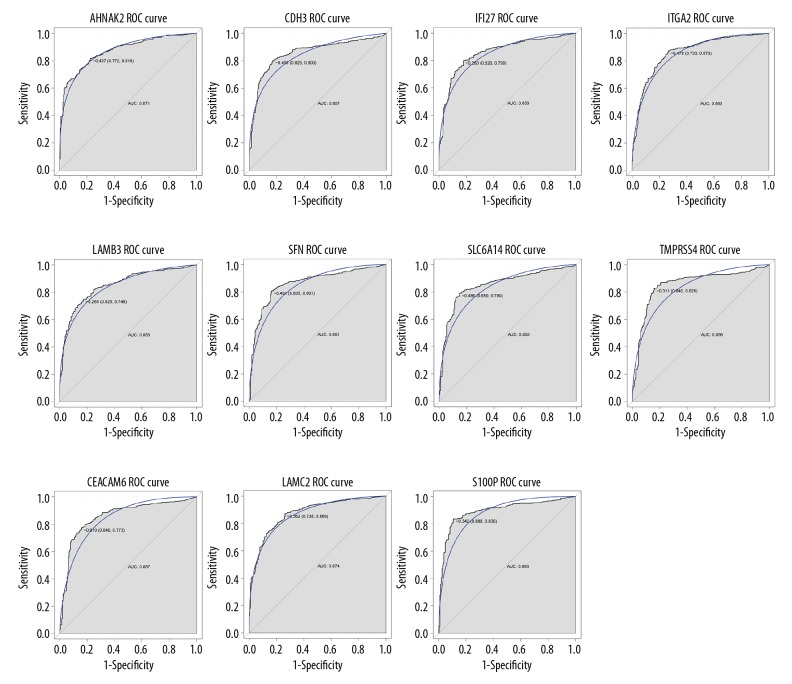
Based on the ROC analysis, a total of 11 DEGs (AHNAK2, CDH3, IFI27, ITGA2, LAMB3, SFN, SLC6A14, TMPRSS4, LAMC2, CEACAM6, and S100P) had great diagnostic value for PAC with AUC more than 0.85 (Figure 4).
Figure 4.
ROC curves of DEGs with great diagnostic value for PAC. Gene symbols was on the top of the ROC curves. The x-axis shows 1-specificity and y-axis shows sensitivity, respectively. ROC – receiver-operating characteristic; DEGs – differentially expressed genes.
Cross-validation
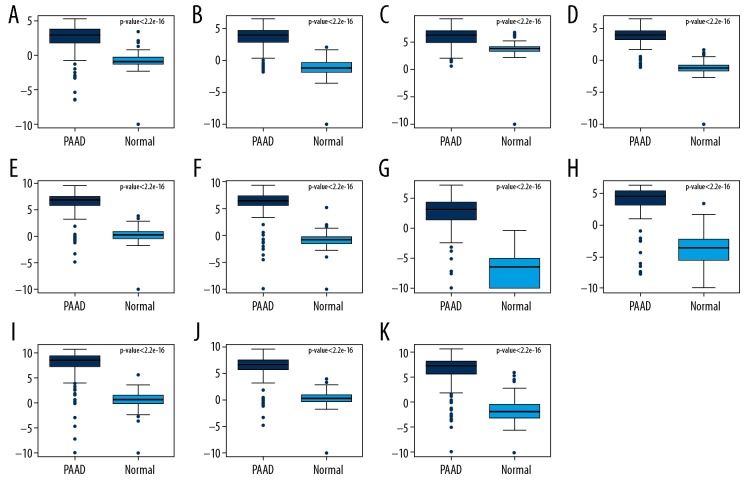
By using TCGA-GTEx processed data, expression of these 11 DEGs with AUC >0.85 were validated. All these DEGs were significantly upregulated in pancreatic adenocarcinoma compared with normal controls which was generally consistent with our integrated analysis (Figure 5).
Figure 5.
Cross-validation of DEGs by TCGA and GTEx Box-plot displayed the expression levels of DEGs between PAAD and non-tumor tissues. (A) AHNAK2; (B) CDH3; (C) IFI27; (D) ITGA2; (E) LAMB3; (F) SFN; (G) SLC6A14; (H) TMPRSS4; (I) CEACAM6; (J) LAMC2; (K) S100P. The x-axis represents PAAD and normal groups. The y-axis represents relative gene expression levels. DEGs – differentially expressed genes; TCGA – The Cancer Genome Atlas; GTEx – Genotype-Tissue Expression; PAAD – pancreatic adenocarcinoma.
Survival analysis
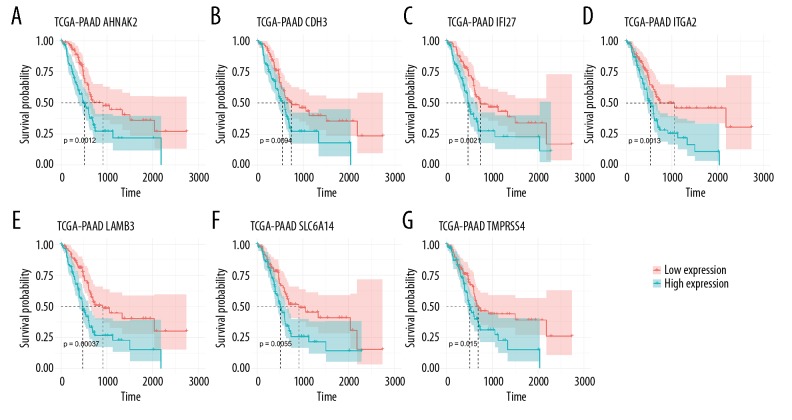
Multivariate Cox regression analyses (adjusted for age, sex, grade, and stage) were performed to evaluate the impact of these 11 above-mentioned DEGs on overall survival of PAC patients. A total of 7 DEGs (AHNAK2, CDH3, IFI27, ITGA2, LAMB3, SLC6A14, and TMPRSS4) with great prognostic value for PAC were identified (Figure 6). Increased expression of these 7 DEGs were significantly associated with poor prognosis of patients with pancreatic adenocarcinoma. Furthermore, these 7 DEGs were dual-functional biomarkers which have both great diagnostic and prognostic value for PAC.
Figure 6.
Survival analysis of DEGs with great prognostic value for PAC. (A) AHNAK2; (B) CDH3; (C) IFI27; (D) ITGA2; (E) LAMB3; (F) SLC6A14; (G) TMPRSS4. The x-axis indicates times (days) and y-axis indicates survival rate. High expression of these eight DEGs was significantly associated with lower survival rate in patients with PAC. DEGs – differentially expressed genes; PAC – pancreatic cancer.
Discussion
Low detection rate in the early stage, and systemic dissemination and insufficient effective treatment contribute to the invariably poor prognosis of patients with PAC. Therefore, development of diagnostic and prognostic biomarkers and therapeutic targets are essential to improve diagnosis accuracy and outcome of PAC patients in the clinic.
After integrated 17 microarray analysis of PAC, a total of 1136 DEGs including 596 upregulated DEGs and 540 downregulated DEGs between PAC and non-tumor controls were identified. Expression of DEGs were confirmed by the TCGA and GTEx. DEGs were significantly enriched in pancreatic secretion (Kegg: 04972), insulin signaling pathway (Kegg: 04910) and several cancer-related pathways including pathways in cancer (Kegg: 05200), MAPK signaling pathway (Kegg: 04010), and pancreatic cancer (Kegg: 05212), which increased the credibility of our integrated analysis.
Eleven upregulated DEGs including (AHNAK2, CDH3, IFI27, ITGA2, LAMB3, SFN, SLC6A14, TMPRSS4, CEACAM6, LAMC2, and S100P) were found to have great ability in discriminating PAC from non-tumor control tissues. These results have been validated by the TCGA-GTEx processed data. Literature-based validation also provided support for our study. Increased expression of 10 DEGs (AHNAK2, CDH3, IFI27, ITGA2, LAMB3, SLC6A14, TMPRSS4, CEACAM6, LAMC2, and S100P) in PAC tissues was confirmed by another microarray analysis in PAC [21]. Lu et al. [22] reported that AHNAK2 is highly expressed in PAC compared to normal tissues by immunohistochemistry. Long et al. [23] found that increased LACM2, ITGA2, and CDH3 were upregulated in PAC at mRNA and protein level using an integrative analysis utilizing next-generation sequencing, transcriptome meta-analysis and immunohistochemistry. Zhang et al. [24] found the upregulation of LAMB3 in pancreatic ductal adenocarcinoma tissues and 7 pancreatic ductal adenocarcinoma cell lines. SLC6A14 was found to be upregulated in pancreatic cancer tissues, cancer cell lines at both mRNA and protein levels [25]. Furthermore, 7 of these 11 DEGs (AHNAK2, CDH3, IFI27, ITGA2, LAMB3, SLC6A14, and TMPRSS4) were found to have great diagnosis and prognostic value for patients with PAC.
Among them, AHNAK2 is a large protein (>600 kDa) with a PDZ domain that belongs to AHNAK protein family [26,27]. AHNAK2 is a known prognostic biomarker for PAC and increased AHNAK2 was closely associated with the poor prognosis of pancreatic ductal adenocarcinoma (PDAC) [22] which supports this present study.
ITGA2, CDH3, SLC6A14, LAMB3, and TMPRSS4 were all PAC-regulators. Integrin, alpha 2 (ITGA2) was reported to play migrating roles various cancers including pancreas, nasopharyngeal carcinoma [28], colon cancer and gastric cancer.
Cadherin-3 (CDH3) is a novel and useful tumor-associated antigen for immunotherapy against a broad spectrum of cancers such as pancreatic, gastric, and colorectal cancers [29]. SLC6A14 is a neutral and basic amino acid transporter that upregulated in both primary PAC tissues and pancreatic cancer cells lines [25,30] and inhibition of SLC6A14 could decrease pancreatic cell growth and proliferation due to amino acid starvation [25]. LAMB3 involve in the invasion and metastases of multiple cancers such as head and neck squamous cell carcinoma [31], thyroid [32], liver [33], and prostate cancer [34]. Expression of LAMB3 was progressively elevated from tumor initiation to progression [35]. Moreover, LAMB3 play roles in apoptotic, proliferative, invasive, and metastatic in pancreatic cancer via regulating the PI3K/Akt signaling pathway [24]. TMPRSS4 is novel type II transmembrane serine protease that overexpressed in some types of cancers including pancreatic, thyroid, colon, breast, cervical, gastric, and non-small-cell lung cancer [36–42]. As an important tumor regulator, TMPRSS4 play roles in tumor cell invasion, migration, and metastasis by mediating multiple downstream signaling pathways including focal adhesion kinase (FAK)/MAPK, extracellular signal-regulated kinase (ERK), Akt, Src, Rac1, and JNK signaling pathway [38,42–44]. Knockdown of TMPRSS4 was found to decrease PDAC cell migration, invasion, and anchorage-independent growth [27]. This present study provided support for these previous studies and emphasized the importance of ITGA2, CDH3, SLC6A14, LAMB3, and TMPRSS in PAC. Moreover, we indicated that these 5 genes could accurately discriminated PAC from non-tumor controls and revealed the association between upregulation of these 5 genes and poor prognosis of patients with PAC.
Notably, the association between IFI27 and PAC has never been reported. IFI27 (interferon alpha inducible protein 27) is an interferon-α (IFN-α) inducible gene that was reported to involve in innate immunity and intervene in cell proliferation. Increased expression of IFI27 has been detected in various other cancers with underlying mechanism not fully understood [45]. IFI27 knockdown induced cholangiocarcinoma cell proliferative rate decreased in vitro and in vivo and attenuated cholangiocarcinoma cell migration and invasion through inhibition of epithelial-mesenchymal transition [46]. The same phenomenon was observed in oral squamous cell carcinoma as well [47]. In this study, increased expression of IFI27 was found to serve as a poor prognostic biomarker in PAC which providing clues that IFI27 may elicit similar features in PAC.
However, this study had 2 limitations. First, due to restrictions of GEO, the clinical data of datasets used in this study was not detailed enough. This study compared expression profile between PAC tissues and non-tumor controls without classification of normal controls and adjacent non-tumor tissues in PAC patients. Second, wet-lab evidence and larger clinical data sets are needed to confirm our results.
Conclusions
Taken together, our integrated analysis identified 7 dual-function cancer biomarkers (AHNAK2, CDH3, IFI27, ITGA2, LAMB3, SLC6A14, and TMPRSS4) that have both great diagnostic and prognostic value for PAC and it provided clues for the underlying mechanism and therapeutic targets for PAC. Further research is needed to explore their biological function in PAC.
Footnotes
Conflict of interest
None.
Source of support: Departmental sources
References
- 1.Siegel RL, Miller KD, Jemal A. Cancer statistics, 2019. Cancer J Clin. 2019;69:7–34. doi: 10.3322/caac.21551. [DOI] [PubMed] [Google Scholar]
- 2.Bray F, Ferlay J, Soerjomataram I, et al. Global cancer statistics 2018: GLOBOCAN estimates of incidence and mortality worldwide for 36 cancers in 185 countries. Cancer J Clin. 2018;68:394–424. doi: 10.3322/caac.21492. [DOI] [PubMed] [Google Scholar]
- 3.Seino T, Kawasaki S, Shimokawa M, et al. Human pancreatic tumor organoids reveal loss of stem cell niche factor dependence during disease progression. Cell Stem Cell. 2018;22:454–67.e456. doi: 10.1016/j.stem.2017.12.009. [DOI] [PubMed] [Google Scholar]
- 4.Klett H, Fuellgraf H, Levit-Zerdoun E, et al. Identification and validation of a diagnostic and prognostic multi-gene biomarker panel for pancreatic ductal adenocarcinoma. Front Genet. 2018;9:108. doi: 10.3389/fgene.2018.00108. [DOI] [PMC free article] [PubMed] [Google Scholar]
- 5.Wang J, Dumartin L, Mafficini A, et al. Splice variants as novel targets in pancreatic ductal adenocarcinoma. Sci Rep. 2017;7:2980. doi: 10.1038/s41598-017-03354-z. [DOI] [PMC free article] [PubMed] [Google Scholar]
- 6.Janky R, Binda MM, Allemeersch J, et al. Prognostic relevance of molecular subtypes and master regulators in pancreatic ductal adenocarcinoma. BMC Cancer. 2016;16:632. doi: 10.1186/s12885-016-2540-6. [DOI] [PMC free article] [PubMed] [Google Scholar]
- 7.Yang S, He P, Wang J, et al. A novel MIF signaling pathway drives the malignant character of pancreatic cancer by targeting NR3C2. Cancer Res. 2016;76:3838–50. doi: 10.1158/0008-5472.CAN-15-2841. [DOI] [PMC free article] [PubMed] [Google Scholar]
- 8.Haider S, Wang J, Nagano A, et al. A multi-gene signature predicts outcome in patients with pancreatic ductal adenocarcinoma. Genome Med. 2014;6:105. doi: 10.1186/s13073-014-0105-3. [DOI] [PMC free article] [PubMed] [Google Scholar]
- 9.Marot G, Foulley JL, Mayer CD, Jaffrezic F. Moderated effect size and P-value combinations for microarray meta-analyses. Bioinformatics. 2009;25:2692–99. doi: 10.1093/bioinformatics/btp444. [DOI] [PubMed] [Google Scholar]
- 10.The Genotype-Tissue Expression (GTEx) project. Nat Genet. 2013;45:580–85. doi: 10.1038/ng.2653. [DOI] [PMC free article] [PubMed] [Google Scholar]
- 11.Dong S, Huang F, Zhang H, Chen Q. Overexpression of BUB1B, CCNA2, CDC20, and CDK1 in tumor tissues predicts poor survival in pancreatic ductal adenocarcinoma. Biosci Rep. 2019;39(2) doi: 10.1042/BSR20182306. pii: BSR20182306. [DOI] [PMC free article] [PubMed] [Google Scholar]
- 12.Jiang J, Azevedo-Pouly AC, Redis RS, et al. Globally increased ultraconserved noncoding RNA expression in pancreatic adenocarcinoma. Oncotarget. 2016;7:53165–77. doi: 10.18632/oncotarget.10242. [DOI] [PMC free article] [PubMed] [Google Scholar]
- 13.Qian YG, Ye Z, Chen HY, et al. LINC01121 Inhibits cell apoptosis while facilitating proliferation, migration, and invasion though negative regulation of the Camp/PKA signaling pathway via GLP1R. Cell Physiol Biochem. 2018;47:1007–24. doi: 10.1159/000490167. [DOI] [PubMed] [Google Scholar]
- 14.Wennerstrom AB, Lothe IM, Sandhu V, et al. Generation and characterisation of novel pancreatic adenocarcinoma xenograft models and corresponding primary cell lines. PLoS One. 2014;9:e103873. doi: 10.1371/journal.pone.0103873. [DOI] [PMC free article] [PubMed] [Google Scholar]
- 15.Lunardi S, Jamieson NB, Lim SY, et al. IP-10/CXCL10 induction in human pancreatic cancer stroma influences lymphocytes recruitment and correlates with poor survival. Oncotarget. 2014;5:11064–80. doi: 10.18632/oncotarget.2519. [DOI] [PMC free article] [PubMed] [Google Scholar]
- 16.Frampton AE, Castellano L, Colombo T, et al. MicroRNAs cooperatively inhibit a network of tumor suppressor genes to promote pancreatic tumor growth and progression. Gastroenterology. 2014;146:268–77.e218. doi: 10.1053/j.gastro.2013.10.010. [DOI] [PubMed] [Google Scholar]
- 17.Park M, Kim M, Hwang D, et al. Characterization of gene expression and activated signaling pathways in solid-pseudopapillary neoplasm of pancreas. Modern Pathol. 2014;27:580–93. doi: 10.1038/modpathol.2013.154. [DOI] [PubMed] [Google Scholar]
- 18.Zhang G, He P, Tan H, et al. Integration of metabolomics and transcriptomics revealed a fatty acid network exerting growth inhibitory effects in human pancreatic cancer. Clin Cancer Res. 2013;19:4983–93. doi: 10.1158/1078-0432.CCR-13-0209. [DOI] [PMC free article] [PubMed] [Google Scholar]
- 19.Donahue TR, Tran LM, Hill R, et al. Integrative survival-based molecular profiling of human pancreatic cancer. Clin Cancer Res. 2012;18:1352–63. doi: 10.1158/1078-0432.CCR-11-1539. [DOI] [PMC free article] [PubMed] [Google Scholar]
- 20.Badea L, Herlea V, Dima SO, et al. Combined gene expression analysis of whole-tissue and microdissected pancreatic ductal adenocarcinoma identifies genes specifically overexpressed in tumor epithelia. Hepatogastroenterology. 2008;55:2016–27. [PubMed] [Google Scholar]
- 21.Liu B, Yang H, Taher L, et al. Identification of prognostic biomarkers by combined mRNA and miRNA expression microarray analysis in pancreatic cancer. Transl Oncol. 2018;11:700–14. doi: 10.1016/j.tranon.2018.03.003. [DOI] [PMC free article] [PubMed] [Google Scholar]
- 22.Lu D, Wang J, Shi X, et al. AHNAK2 is a potential prognostic biomarker in patients with PDAC. Oncotarget. 2017;8:31775–84. doi: 10.18632/oncotarget.15990. [DOI] [PMC free article] [PubMed] [Google Scholar]
- 23.Long NP, Jung KH, Anh NH, et al. An integrative data mining and omics-based translational model for the identification and validation of oncogenic biomarkers of pancreatic cancer. Cancers (Basel) 2019;11(2) doi: 10.3390/cancers11020155. pii: E155. [DOI] [PMC free article] [PubMed] [Google Scholar]
- 24.Zhang H, Pan YZ, Cheung M, et al. LAMB3 mediates apoptotic, proliferative, invasive, and metastatic behaviors in pancreatic cancer by regulating the PI3K/Akt signaling pathway. Cell Death Dis. 2019;10:230. doi: 10.1038/s41419-019-1320-z. [DOI] [PMC free article] [PubMed] [Google Scholar]
- 25.Coothankandaswamy V, Cao S, Xu Y, et al. Amino acid transporter SLC6A14 is a novel and effective drug target for pancreatic cancer. Br J Pharmacol. 2016;173:3292–306. doi: 10.1111/bph.13616. [DOI] [PMC free article] [PubMed] [Google Scholar]
- 26.Komuro A, Masuda Y, Kobayashi K, et al. The AHNAKs are a class of giant propeller-like proteins that associate with calcium channel proteins of cardiomyocytes and other cells. Proc Natl Acad Sci USA. 2004;101:4053–58. doi: 10.1073/pnas.0308619101. [DOI] [PMC free article] [PubMed] [Google Scholar]
- 27.Bhasin MK, Ndebele K, Bucur O, et al. Meta-analysis of transcriptome data identifies a novel 5-gene pancreatic adenocarcinoma classifier. Oncotarget. 2016;7:23263–81. doi: 10.18632/oncotarget.8139. [DOI] [PMC free article] [PubMed] [Google Scholar]
- 28.Zhao C, Zou H, Zhang J, et al. An integrated methylation and gene expression microarray analysis reveals significant prognostic biomarkers in oral squamous cell carcinoma. Oncol Rep. 2018;40:2637–47. doi: 10.3892/or.2018.6702. [DOI] [PMC free article] [PubMed] [Google Scholar]
- 29.Imai K, Hirata S, Irie A, et al. Identification of a novel tumor-associated antigen, cadherin 3/P-cadherin, as a possible target for immunotherapy of pancreatic, gastric, and colorectal cancers. Clin Cancer Res. 2008;14:6487–95. doi: 10.1158/1078-0432.CCR-08-1086. [DOI] [PubMed] [Google Scholar]
- 30.Penheiter AR, Erdogan S, Murphy SJ, et al. Transcriptomic and immunohistochemical profiling of SLC6A14 in pancreatic ductal adenocarcinoma. Biomed Res Int. 2015;2015 doi: 10.1155/2015/593572. 593572. [DOI] [PMC free article] [PubMed] [Google Scholar]
- 31.Liu L, Jung SN, Oh C, et al. LAMB3 is associated with disease progression and cisplatin cytotoxic sensitivity in head and neck squamous cell carcinoma. Eur J Surg Oncol. 2019;45:359–65. doi: 10.1016/j.ejso.2018.10.543. [DOI] [PubMed] [Google Scholar]
- 32.Wang Y, Jin Y, Bhandari A, et al. Upregulated LAMB3 increases proliferation and metastasis in thyroid cancer. Onco Targets Ther. 2018;11:37–46. doi: 10.2147/OTT.S149613. [DOI] [PMC free article] [PubMed] [Google Scholar]
- 33.Hou J, Wang L, Wu D. The root of Actinidia chinensis inhibits hepatocellular carcinomas cells through LAMB3. Cell Biol Toxicol. 2018;34:321–32. doi: 10.1007/s10565-017-9416-7. [DOI] [PubMed] [Google Scholar]
- 34.Reis ST, Timoszczuk LS, Pontes-Junior J, et al. The role of micro RNAs let7c, 100 and 218 expression and their target RAS, C-MYC, BUB1, RB, SMARCA5, LAMB3 and Ki-67 in prostate cancer. Clinics (Sao Paulo) 2013;68:652–57. doi: 10.6061/clinics/2013(05)12. [DOI] [PMC free article] [PubMed] [Google Scholar]
- 35.Pan Z, Li L, Fang Q, et al. Analysis of dynamic molecular networks for pancreatic ductal adenocarcinoma progression. Cancer Cell Int. 2018;18:214. doi: 10.1186/s12935-018-0718-5. [DOI] [PMC free article] [PubMed] [Google Scholar]
- 36.Kim S, Lee JW. Membrane proteins involved in epithelial-mesenchymal transition and tumor invasion: studies on TMPRSS4 and TM4SF5. Genom Inform. 2014;12:12–20. doi: 10.5808/GI.2014.12.1.12. [DOI] [PMC free article] [PubMed] [Google Scholar]
- 37.Cheng D, Kong H, Li Y. TMPRSS4 as a poor prognostic factor for triple-negative breast cancer. Int J Mol Sci. 2013;14:14659–68. doi: 10.3390/ijms140714659. [DOI] [PMC free article] [PubMed] [Google Scholar]
- 38.de Aberasturi AL, Calvo A. TMPRSS4: an emerging potential therapeutic target in cancer. Br J Cancer. 2015;112:4–8. doi: 10.1038/bjc.2014.403. [DOI] [PMC free article] [PubMed] [Google Scholar]
- 39.Huang A, Zhou H, Zhao H, et al. TMPRSS4 correlates with colorectal cancer pathological stage and regulates cell proliferation and self-renewal ability. Cancer Biol Ther. 2014;15:297–304. doi: 10.4161/cbt.27308. [DOI] [PMC free article] [PubMed] [Google Scholar]
- 40.Larzabal L, Nguewa PA, Pio R, et al. Overexpression of TMPRSS4 in non-small cell lung cancer is associated with poor prognosis in patients with squamous histology. Br J Cancer. 2011;105:1608–14. doi: 10.1038/bjc.2011.432. [DOI] [PMC free article] [PubMed] [Google Scholar]
- 41.Wallrapp C, Hahnel S, Muller-Pillasch F, et al. A novel transmembrane serine protease (TMPRSS3) overexpressed in pancreatic cancer. Cancer Res. 2000;60:2602–6. [PubMed] [Google Scholar]
- 42.Kim S, Kang HY, Nam EH, et al. TMPRSS4 induces invasion and epithelial-mesenchymal transition through upregulation of integrin alpha5 and its signaling pathways. Carcinogenesis. 2010;31:597–606. doi: 10.1093/carcin/bgq024. [DOI] [PubMed] [Google Scholar]
- 43.Larzabal L, de Aberasturi AL, Redrado M, et al. TMPRSS4 regulates levels of integrin alpha5 in NSCLC through miR-205 activity to promote metastasis. Br J Cancer. 2014;110:764–74. doi: 10.1038/bjc.2013.761. [DOI] [PMC free article] [PubMed] [Google Scholar]
- 44.Min HJ, Lee Y, Zhao XF, et al. TMPRSS4 upregulates uPA gene expression through JNK signaling activation to induce cancer cell invasion. Cell Signal. 2014;26:398–408. doi: 10.1016/j.cellsig.2013.08.002. [DOI] [PubMed] [Google Scholar]
- 45.Suomela S, Cao L, Bowcock A, Saarialho-Kere U. Interferon alpha-inducible protein 27 (IFI27) is upregulated in psoriatic skin and certain epithelial cancers. J Invest Dermatol. 2004;122:717–21. doi: 10.1111/j.0022-202X.2004.22322.x. [DOI] [PubMed] [Google Scholar]
- 46.Chiang KC, Huang ST, Wu RC, et al. Interferon alpha-inducible protein 27 is an oncogene and highly expressed in cholangiocarcinoma patients with poor survival. Cancer Manag Res. 2019;11:1893–905. doi: 10.2147/CMAR.S196485. [DOI] [PMC free article] [PubMed] [Google Scholar]
- 47.Wang H, Qiu X, Lin S, et al. Knockdown of IFI27 inhibits cell proliferation and invasion in oral squamous cell carcinoma. World J Surg Oncol. 2018;16:64. doi: 10.1186/s12957-018-1371-0. [DOI] [PMC free article] [PubMed] [Google Scholar]


