

Abstract
The highly pathogenic avian influenza (HPAI) strain H5N1, which first appeared in Hong Kong in 1997, achieved bird-to-human transmission, causing a severe disease with high mortality to humans [18]. According to the World Health Organization (WHO), a total of 637 cases were reported in fifteen countries, including 378 deaths, corresponding to a case fatality rate of nearly 60% [19]. Avian influenza continues to be one of the deadliest diseases that jumps from animals to humans. Epidemiologists believe that it is likely to cause the next major global pandemic that could kill millions of people.
The 2002 outbreak of severe acute respiratory syndrome (SARS) demonstrated that international air travel can significantly influence the global spread of an infectious disease. This paper studies the effects of air travel on the spread of avian influenza from Asian and Australian cities to the United States. A two-city mathematical model involving a pandemic strain is used to derive the basic reproduction number (), which determines if the disease will spread and persist () or go extinct (). Real air travel data is used to model the disease spread by individuals who are susceptible to or are infected with pandemic avian influenza. Analysis of the two-city model helps understand the dynamics of the spread of pandemic influenza when the cities are connected by air travel. Understanding these effects can help public health officials and policy-makers select the appropriate disease control measures. Also, it can provide guidance to decision-makers on where to implement control measures while conserving precious resources.
Keywords: Avian influenza, Pandemic, Disease spread, Air travel, Disease control
1. Introduction
The avian influenza virus belongs to a group of viruses known as Influenza A that circulate in many avian and mammalian species, including humans [2]. The highly pathogenic avian influenza (HPAI) strain H5N1 achieved bird-to-human transmission and caused a severe disease to humans with high mortality [18]. HPAI first appeared in 1997 in Hong Kong, where it infected eighteen humans and caused six deaths. To date, a total of 637 cases in fifteen countries have been reported to the World Health Organization (WHO), including 378 deaths with a case fatality rate approaching 60% [19].
Interestingly, there has been no decline in the mortality rate since the first appearance of HPAI. In March 2013, China reported several confirmed cases involving the H7N9 strain that had not been seen previously in humans [20]. Most patients showed flu-like symptoms, and a throat swab taken from a patient in Jiangsu Province revealed the presence of the H3N2 human influenza virus and the H7N9 avian influenza virus [19]. Avian influenza continues to be one of the deadliest diseases that links humans and animals. Indeed, it is expected to cause the next major influenza pandemic.
An influenza pandemic occurs when a new strain of virus circulates among humans, potentially killing millions of people. Aside from its high mortality rate, avian influenza is monitored closely for a pandemic because Influenza A type viruses can evolve rapidly and jump between species. The viruses evolve through evolutionary mechanisms such as drift and shift. Drift involves small, gradual changes to surface proteins while shift involves abrupt major changes to the influenza virus. Shift evolution occurs through reassortment, the mixing of two influenza viruses (e.g., avian influenza and human influenza) into a new strain that carries properties from both strains. Shift typically occurs when a patient gets infected with both strains of the influenza virus. Recent outbreaks in China show that shift evolution can occur at any time with potentially deadly effects.
Vaccination is one of the best ways to prevent the spread of pandemic influenza and reduce its severity. However, producing live attenuated and inactive vaccine seed viruses against a potential pandemic-causing avian influenza strain, and subsequently performing pre-clinical tests and clinical trials can take several months, if not longer. Unfortunately, it is not possible to predict which avian virus strains will cause the next influenza pandemic or when the pandemic will occur. Of great concern is the fact that once pandemic avian influenza surfaces, it will spread globally in no time at all because the world is connected via air travel.
The 2002 outbreak of severe acute respiratory syndrome (SARS) demonstrated that international air travel accelerated the global spread of an infectious disease [14]. This paper attempts to study the effects of air travel on the spread of avian influenza. Understanding the effects can help public health officials and policy-makers to select the appropriate disease control measures. Also, it can provide guidance to decision-makers about where to implement control measures while conserving precious resources.
This paper presents a mathematical model with spatial heterogeneity that is designed to better understand the emergence and the spread of pandemic avian influenza. Spatial effects regarding disease spread can be modeled by diffusion or dispersal models. In a diffusion model, the movements of infected individuals are instantaneous and the disease spreads immediately to neighboring areas. On the other hand, in a dispersal model, the movements of individuals are discrete and usually occur between so-called patches connected by dispersion. Dispersal models are more appropriate when considering travel over long distances. Thus, a two-city dispersal model is developed to predict the spread of avian influenza from Asia and Australia to major U.S. cities via air travel. Real air travel data is used to model the disease spread by individuals who are susceptible to or are infected with pandemic avian influenza. The two-city model helps identify the most effective intervention strategies at the origin and destination cities as well as help quantify the effectiveness of control measures that should applied to reduce the morbidity and mortality of a pandemic. This can provide valuable guidance to public health officials and policy-makers as they decide how, where and when to target pandemic influenza intervention strategies while efficiently using the available resources.
2. Mathematical methods
This section describes the mathematical model, and the data and model parameters.
2.1. Mathematical model
A two-city model is used to express the spread of avian influenza from its origin in an Asian or Australian city to major cities in the United States. A single-city model is first specified, which is subsequently generalized to a two-city model by considering the travel of susceptible and infected individuals with the new strain of avian influenza.
2.1.1. Single-city model
Avian influenza, one of the most dangerous diseases that links humans and animals, is currently the foremost pandemic threat. Early mathematical models that investigate the impact of a hypothetical pandemic have focused only on humans [1], [4], [5], [10], [13]. At this time, the avian influenza virus can only be transmitted from birds to humans; it is not yet capable of sustained human-to-human transmission. Most of the human cases reported to the WHO were due to close contact between humans and domestic birds. Recent mathematical models capture the bird-to-human transmission pathway of avian influenza [6], [7], [8], [9]. The simplest bird-to-human model was introduced by Iwami et al. [7]; this model is the starting point for the single-city model presented in this paper. The notation used in our model is different, but the two models are equivalent.
In our single-city model, the domestic bird population is divided into two non-intersecting classes: susceptible domestic birds denoted by S d(t) and infected domestic birds denoted by I d(t). The natural birth rate of the bird population is expressed by Λ d. Susceptible birds have a natural death rate μ d while infected birds die at the rate , where the additional death rate ν d is induced by HPAI.
Susceptible humans are denoted by S(t) and infected humans by I(t). The natural birth rate of the human population is denoted by . Susceptible humans die at the rate μ while infected humans die at the rate , where ν is the additional death rate due to avian influenza.
The single city model, which comprises the bird and human populations, is given by
| (1) |
The force of the infection in the domestic bird population is denoted by , where β d is the transmission rate at which a susceptible bird contracts avian influenza from an infected bird. The incidence rate in the human population is denoted by , where β is the rate at which a susceptible human contracts avian influenza upon contact with an infected bird.
To investigate the impact of a hypothetical pandemic, we assume that avian influenza evolves to become a human-to-human transmissible pathogen. This evolution likely occurs as a result of one of two evolutionary mechanisms: drift and shift. We assume that the mutation of avian influenza is caused by reassortment (shift mechanism) and denote the mutation rate of avian influenza into a pandemic influenza by m. The new avian influenza strain that causes a pandemic is called “pandemic avian influenza.” The human population that is infected with the new strain is denoted by P(t). Infection from one strain of Influenza A virus provides cross-immunity to infections from other strains. This is why we assume that humans infected with pandemic avian influenza can infect susceptible humans, but not humans who are infected with avian influenza. The new incidence of pandemic avian influenza is denoted by , where β p is the transmission rate. The additional death rate due to pandemic avian influenza is denoted by ν p. Table 1 lists the state variables in the model while Table 2 lists the model parameters.
Table 1.
State variables.
| Variable | Description |
|---|---|
| Sd | Susceptible domestic birds |
| Id | Birds infected with HPAI |
| S | Susceptible humans |
| I | Humans infected with HPAI |
| P | Humans infected with pandemic avian influenza |
Table 2.
Parameters.
| Parameter | Description |
|---|---|
| Λd | Birth/recruitment rate of domestic birds |
| Transmission rate of HPAI among domestic birds | |
| μd | Natural death rate of domestic birds |
| νd | HPAI-induced mortality rate of domestic birds |
| Birth/recruitment rate of humans | |
| Transmission coefficient of HPAI from birds to humans | |
| μ | Natural death rate of humans |
| ν | Death rate of humans due to HPAI |
| m | Mutation rate of avian influenza to pandemic avian influenza |
| βp | Transmission rate of pandemic avian influenza |
| νp | Death rate of humans due to pandemic avian influenza |
2.1.2. Two-city model
The two-city model assumes that the pandemic originates in a city in Asia or Australia and spreads to a city in the United States by air travel. We only consider the air travel of susceptible and infected humans with pandemic avian influenza because the infected individuals can only contract the disease from domestic birds (that do not travel). If the travel of humans is not considered, then the pandemic is modeled within each city by a single-city model. In the following, we use subscripts to distinguish cities. The travel rate of individuals from City 1 to City 2 is denoted as k 1 and the corresponding travel rate from City 2 to City 1 is denoted by k 2. The two-city model is given by
| (2) |
We assume that individuals infected with pandemic avian influenza have minor flu-like symptoms and, therefore, are “well enough” to continue with their travel plans. Thus, the travel rate for infected individuals is the same as that for susceptible individuals.
Fig. 1 shows the movements of individuals between City 1 and City 2 through the various stages of the disease. In the model, the transmission of pandemic avian influenza occurs only between individuals in a city. Specifically, infected individuals in one city do not directly infect individuals in another city. This assumption is motivated by the fact that individuals in a city are much more likely to be in contact with city residents than tourists – the number of contacts between city residents is extremely large compared with the number of contacts between residents and tourists on a given day. We also assume that the transmission rates of avian influenza within the bird and human populations, and the transmission rates of pandemic avian influenza are the same for all cities.
Fig. 1.

Flow diagram of the two-city model.
2.2. Data and model parameters
International airline flight data provided by the Office of the Secretary for Aviation and International Affairs was obtained from the United States Department of Transportation website [16]. Table 3, Table 4 present flight data obtained from the report entitled “U.S. International Air Passenger and Freight Statistics” for the third quarter of 2011. Table 3 lists the numbers of passengers who took direct flights from Asian or Australian cities to U.S. cities. Table 4 shows the numbers of passengers who traveled from major airports in Asia and Australia and the corresponding U.S. shares expressed as percentages.
Table 3.
Flight data for U.S.-international airport pairs.
| U.S. airport | Foreign airport | Passengers |
|---|---|---|
| Los Angeles | Tokyo, Japan | 1,114,251 |
| Los Angeles | Sydney, Australia | 1,104,245 |
| Los Angeles | Seoul, South Korea | 896,055 |
| San Francisco | Hong Kong, China | 891,257 |
| San Francisco | Seoul, South Korea | 635,575 |
| New York | Tokyo, Japan | 607,025 |
| Orlando | Tokyo, Japan | 591,083 |
| San Francisco | Tokyo, Japan | 565,957 |
Table 4.
Flight data for international passenger gateways to the U.S.
| Foreign city | Passengers | U.S. share (%) |
|---|---|---|
| Tokyo, Japan | 7,515,486 | 68.6 |
| Seoul, South Korea | 4,082,126 | 12.2 |
| Hong Kong, China | 2,322,144 | 32.9 |
| Sydney, Australia | 1,705,996 | 64.3 |
| Beijing, China | 1,541,073 | 64.1 |
| Shanghai, China | 1,422,707 | 71.8 |
The travel rates between City 1 (k 1) and City 2 (k 2) are estimated by dividing the total number of passengers traveling from City 1 to City 2 by the population of City 1. Since time is measured in days, the result is further divided by to obtain the travel rate of individuals of a city per day. The populations of cities considered in this work are presented in Table 5 . For example, the travel rate from Seoul to Los Angeles is estimated as
Similarly, the travel rate from Los Angeles to Seoul is estimated as
Table 5.
Regional populations and life expectancy.
| City | Population | Country | Life expectancy (years) |
|---|---|---|---|
| Tokyo | 13,189,000 | Japan | 82.9 |
| Sydney | 4,605,992 | Australia | 81.7 |
| Seoul | 10,464,051 | South Korea | 80.8 |
| Hong Kong | 7,071,600 | Hong Kong | 82.9 |
| Beijing | 20,180,000 | China | 73.3 |
| Shanghai | 23,019,200 | United States | 78.2 |
| Los Angeles | 3,819,702 | ||
| San Francisco | 812,826 | ||
| New York | 8,244,910 | ||
| Chicago | 2,707,120 |
The lifespan of humans varies from country to country, and even from city to city. Table 5 lists the life expectancies of the countries considered in this research. The natural death rate of humans is estimated as
According to the WHO, the duration of the infectious period for HPAI-infected human cases is six to seven days. Therefore, the disease-induced death rate of HPAI is taken to be . We adjust the disease-induced death rate as a result of pandemic avian influenza using , which is taken from [7]. Thus, we assume that the death rate caused by the new strain of avian influenza is smaller than the death rate of HPAI. The WHO gives the infectious period of domestic birds to be ten days, so . The natural death rate and the disease-induced death rate are assumed to be the same for all cities.
The total human population satisfies the differential equation:
| (3) |
Upon solving Eq. (3), we see that the total human population is a bounded function of time:
where N 0 is the initial human population. The limit of the human population is
| (4) |
Applying similar analysis to the total bird population , we obtain
| (5) |
In all the simulation results presented in this paper, the bird population is given in units of 107 domestic birds and the human population is given in units of 105 individuals. Eqs. (4), (5) are used to estimate the recruitment rates for the bird and human populations, respectively. The Food and Agriculture Organization [3] gives the total poultry population as 20.4 billion, which corresponds to 2040 in units of 107. Commercial poultry is usually kept for two years, so the natural death rate of birds is . Therefore, we estimate the recruitment rate for the bird population as
The recruitment rate of humans in each city is computed similarly using the population and life expectancy data given in Table 5.
The cumulative number of HPAI-infected human cases reported by the WHO exhibits seasonality [15]. This is likely due to factors such as temperature, rainfall, migration patterns of wild birds, survival of the HPAI virus in the environment and seasonality in bird-to-bird transmission. Several such mechanisms are considered in [15] to understand the reasons for the seasonality in avian influenza data; the authors report that the main culprit is bird-to-bird transmission. We use their fitted parameter values for the bird-to-bird and bird-to-human transmission rates, which are and , respectively [15].
In the case of pandemic avian influenza, we set the human-to-human transmission rate to . This is a purely hypothetical value because there is no good way to estimate it. The parameter is fixed by assuming that the transmission of the new pathogen is higher than the transmission of the current pathogen. Currently, avian influenza is in the zoonotic stage, meaning that the only transmission pathway is from birds to humans. The new pathogen evolves into a strain that is capable of human-to-human transmission. We use the mutation rate m=0.01 as given in [7]. All the simulations reported in Section 3 use the parameter values listed in this section. We only change β d or β p to vary the simulations when necessary and the changes are mentioned whenever they are applied.
2.3. Equilibria and reproduction number
Epidemiologists are interested in the long-term dynamics of the spread of an infectious disease. By studying the solutions of the mathematical model, we hope to answer the question of whether the disease will die out or persist in the bird and human populations. In particular, we want to measure the severity of the hypothetical pandemic caused by avian influenza.
To predict the severity of an outbreak or pandemic, a summary parameter called the reproduction number is calculated from the population model. The reproduction number is an epidemiologically important threshold value that determines whether a disease will persist or die out. The basic reproduction number gives the secondary number of infections produced by one infected individual in a totally susceptible domain during her/his infectious period. If , then the disease-free equilibrium is locally asymptotically stable, meaning that the disease will eventually become extinct. If , then the disease-free equilibrium is unstable and the disease will persist in the population. Determining an expression for the basic reproduction number and estimating its value are important when selecting the most effective control measures for eliminating a disease. Reproduction numbers are derived by performing a qualitative analysis of a mathematical model. The procedure is described in detail in the following sections.
2.3.1. Single-city model
The first step in the qualitative analysis of the model is to find constant solutions that do not change in time – equilibrium points. Equilibrium solutions for the single-city model have been studied in [7] and will not be repeated here. However, we will summarize the model dynamics.
The disease free equilibrium (DFE) for the single-city model is , where and . The basic reproduction numbers for the bird population r 0 b and the human population R 0 h, respectively, are
That is, if and , then the DFE vanishes in both populations; otherwise, the disease becomes endemic. This paper focuses on the DFE of the two-city model.
2.3.2. Two-city model
The equilibrium points for the two-city model satisfy the following steady-state equations, which are derived by setting the time derivatives equal to zero:
| (6) |
We denote the DFE equilibrium by , where
This is the state in which HPAI and pandemic avian influenza are both wiped out in the bird and human populations. This infection-free state is stable if the reproduction numbers for the bird and human populations in both cities are less than one. The basic reproduction numbers for the bird populations in City 1 and City 2 are given by
For a system with multiple infected compartments, as in the two-city model defined by Eq. (2), the reproduction number is defined as the number of infections produced by one infected individual at the DFE [17]. Following the next generation approach described in [17], we classify the compartments as infected and uninfected. In our case, the infected compartments consist of birds infected with HPAI, humans infected with HPAI and humans infected with pandemic avian influenza. We define two matrices: (i) F, which expresses the rate of new incidences; and (ii) V, which represents the transfer of individuals between compartments:
The principal eigenvalue of the next generation matrix FV −1 is the basic reproduction number. The next generation matrix for the two-city model in Eq. (2) is
in which the reproduction numbers for the human populations in City 1 and City 2 are given by
We take the basic reproduction number for the human population to be the maximum of the reproduction numbers for the two cities:
Similarly, the reproduction number for the bird population is
HPAI and pandemic avian influenza both become extinct in the bird and human populations when all the reproduction numbers are less than one.
The preceding mathematical discussion leads to the following important result.
Theorem 1
If , then the DFE is locally asymptotically stable. If or , then the DFE is unstable.
2.4. Sensitivity analysis
Sensitivity analysis of the model predictions to small changes in parameter values can help determine which parameters are the best targets for controlling the disease and slowing an epidemic. Let λ be a quantity that depends on two parameters of different scales, i.e., . Then, the sensitivity of λ with respect to the parameters p and q is given by
The sensitivity gives the amount of change that occurs in λ in response to small changes in p. However, because p and q are parameters with different scales, the effect of changes in p and q on λ cannot be compared easily. Therefore, we use an alternative measure that allows for the comparison of different scales. The normalized sensitivity, which is also called elasticity, of the quantity λ with respect to parameter p is given by
The elasticity describes how the quantity λ is affected by small changes in p. A negative elasticity means that a one-percent increase in the parameter p results in an decrease in λ. Similarly, a positive elasticity means that a one-percent increase in the parameter p results in an increase in λ. In the following section, we derive analytic expressions for the elasticities of the basic reproduction number and the prevalence of pandemic avian influenza. The elasticity values are analyzed in the context of the simulation results.
3. Numerical simulations
This section presents the numerical simulation results for the two-city model.
3.1. Transmission between cities
The two-city model was solved numerically using the ode15s built-in function provided in Matlab 2011b. The parameters were set to the values described in Section 2. In the simulations, a small initial infection was introduced in the origin city of the pandemic, and it was assumed that no infected cases exist initially in any of the U.S. cities. A total of fourteen simulations were conducted for the spread of the pandemic spanning a period of ten years. The reproduction number for the bird population was computed to be . The computed reproduction numbers for humans in the various cities are shown in Table 6 .
Table 6.
Reproduction numbers used in the study.
| City | City | Results | ||
|---|---|---|---|---|
| Los Angeles | Tokyo | Fig. 2 | ||
| Los Angeles | Sydney | Fig. 3 | ||
| Los Angeles | Seoul | Fig. 4 | ||
| San Francisco | Hong Kong | Fig. 5 | ||
| San Francisco | Seoul | Fig. 6 | ||
| New York | Tokyo | Fig. 7 | ||
| Chicago | Tokyo | Fig. 8 | ||
| San Francisco | Tokyo | Fig. 9 | ||
| United States | 0.0155 | Tokyo | Fig. 10 | |
| United States | 0.0156 | Seoul | Fig. 11 | |
| United States | 0.0153 | Hong Kong | Fig. 12 | |
| United States | 0.0156 | Sydney | Fig. 13 | |
| United States | 0.0156 | Beijing | Fig. 14 | |
| United States | 0.0156 | Shanghai | 0.011 | Fig. 15 |
The fact that the bird population reproduction number is greater than one () suggests that the DFE is unstable, and this is in agreement with the corresponding simulation results (Fig. 2, Fig. 3, Fig. 4, Fig. 5, Fig. 6, Fig. 7, Fig. 8, Fig. 9, Fig. 10, Fig. 11, Fig. 12, Fig. 13, Fig. 14, Fig. 15 listed in the last column of Table 6). In each of these figures, subfigure(a) shows the number of infected individuals with pandemic avian influenza in the origin city while subfigure(b) shows the number of infected individuals with pandemic avian influenza in the destination U.S. city.
Fig. 2.

Tokyo to Los Angeles. (a) Tokyo. (b) Los Angeles.
Fig. 3.

Sydney to Los Angeles. (a) Sydney. (b) Los Angeles.
Fig. 4.

Seoul to Los Angeles. (a) Seoul. (b) Los Angeles.
Fig. 5.

Hong Kong to San Francisco. (a) Hong Kong. (b) San Francisco.
Fig. 6.

Seoul to San Francisco. (a) Seoul. (b) San Francisco.
Fig. 7.

Tokyo to New York. (a) Tokyo. (b) New York.
Fig. 8.

Tokyo to Chicago. (a) Tokyo. (b) Chicago.
Fig. 9.

Tokyo to San Francisco. (a) Tokyo. (b) San Francisco.
Fig. 10.

Tokyo to the United States. (a) Tokyo. (b) United States.
Fig. 11.
Seoul to the United States. (a) Seoul. (b) United States.
Fig. 12.

Hong Kong to the United States. (a) Hong Kong. (b) United States.
Fig. 13.

Sydney to the United States. (a) Sydney. (b) United States.
Fig. 14.

Beijing to the United States. (a) Beijing. (b) United States.
Fig. 15.

Shanghai to the United States. (a) Shanghai. (b) United States.
In the simulations, we see that for the air travel data taken from Table 3, the numbers of infected people in U.S. cities are less than those in the origin cities. On the other hand, when we consider the data from Table 4, it is interesting to see that the situation reverses. This is not surprising because the travel rates differ considerably in the two types of data. Tokyo has the busiest air traffic to the United States – 5.2 million passengers in just one quarter (Table 4). This contributes to a high travel rate because the population of Tokyo is 13.2 million ( and ). The next section investigates the effects of air travel on pandemic prevalence in more detail.
3.2. Effect on pandemic prevalence
Several researchers have studied the state of H5N1 infections in bird populations [11], [12], [15]. These studies suggest that H5N1 infections are at the endemic state in bird populations. As such, the reproduction numbers for the bird populations should be reduced to control the disease. If the reproduction number r 0 is kept below 1, then an H5N1 infection in a bird population is eliminated. As a consequence, “spill over” infections to human populations are also eliminated [12].
Martcheva [12] conducted a sensitivity analysis of the reproduction number r 0 and reports the following results:
These results suggest that the highest impact on r 0 is obtained by increasing the natural death rate for the bird population μ d. Thus, one of the most effective control measures that can be applied to poultry is culling. Culling increases the parameter μ d and produces the largest change to r 0.
In the pandemic scenario, the reproduction number r 0 is also an important parameter whose value should be kept below one. However, control measures applied to a bird population may be insufficient to reduce the prevalence of a pandemic.
We now develop an analytic expression for the number of infected people with pandemic influenza at the equilibrium state. We call a state in which HPAI dies out in the population but pandemic avian influenza persists as the “pandemic-only equilibrium” and denote it by . The pandemic-only equilibrium satisfies the steady-state equations (Eq. (6)). Thus, the parameters and satisfy the following equations:
| (7) |
| (8) |
Here , i=1, 2 denotes the total population of City i at the pandemic-only equilibrium. To study the effect of the travel parameters k 1 and k 2 on the prevalence of the pandemic avian influenza, we derive the elasticities of pandemic prevalence with respect to the parameter set . Upon implicitly differentiating the functions and , we obtain the following equations:
| (9) |
| (10) |
where
| (11) |
| (12) |
| (13) |
| (14) |
| (15) |
The preceding discussion leads to the formulation of the following proposition.
Proposition 1
, and .
Proof
At the pandemic-only equilibrium, , is strictly positive and , so . Similar analysis yields . From Eqs. (9), (10), we obtain the following expression:
which states that both and are non-zero as long as is non-zero for each parameter p i. From Eqs. (12) through (15), it follows that . Moreover, since is continuous in all its parameters, it must have a definite sign – either all positive or all negative. Setting , we see that and, thus, . □
Upon solving Eqs. (9), (10), we obtain the following analytic expressions for the elasticities of pandemic prevalence:
From these analytic expressions, it is clear that the only positive elasticity is for the transmission rate of pandemic avian influenza. The elasticities of pandemic prevalence with respect to parameters , , , are all negative. These results suggest that control measures that decrease the transmission rate and infectious period of pandemic avian influenza should be applied.
Examples of control measures that might be applied to stop or limit the spread of pandemic influenza are isolating infected individuals, quarantining susceptible individuals who are exposed to the virus and vaccinating individuals against the pandemic strain. These measures impact different parameters in Eq. (2). For example, isolation and quarantine affect the transmission rate β p while vaccination reduces the susceptibility of healthy individuals (thus reducing β p) and might also decrease the infectious period (thus increasing ν p). Evaluating the efficacy of control measures is a non-trivial task for an actual infection, let alone for a hypothetical pandemic avian influenza outbreak. Nevertheless, we compute the elasticities of the pandemic prevalence numerically in order to elucidate the efficacy of control measures.
First, we compute the number of infected individuals with pandemic avian influenza at the pandemic-only equilibrium with k 1 and k 2 varying from 0 to 1. In the simulations, City 1 is the origin of pandemic influenza and City 2 is the destination city. Then, the elasticities of pandemic prevalence are plotted as functions of k 1 and k 2. To further visualize the effects of the air travel, for a fixed k 1 value, the elasticities are plotted for varying k 2 values, and vice versa.
The simulation results show that, although the analytic expressions for and are symmetric, the effects of air travel on the elasticities differ for the origin city and destination city (see Figs. 16 (a) and 17 (a)). The simulation results in Fig. 16 demonstrate that isolating and quarantining individuals from the origin city is appropriate when the travel rate out of the city is very small (i.e., when k 1 is small). When k 1 is large (e.g., in Fig. 16(a)), applying control measures aimed at decreasing the transmission rate of the pandemic influenza will not decrease the prevalence of infected individuals, potentially leading to wasted resources. On the other hand, in the destination city, much is gained from isolation and quarantine measures when k 2 is very small. During a pandemic, government agencies in the destination city should consider implementing disease control measures along with restricting travel (see Fig. 17).
Fig. 16.

Elasticities of pandemic prevalence in the origin city with respect to the transmission rate. (a) is plotted as a function of k1 and k2. (b) Plot of when . (c) Plot of when .
Fig. 17.

Elasticities of pandemic prevalence in the destination city with respect to the transmission rate. (a) is plotted as a function of k1 and k2. (b) Plot of when . (c) Plot of when .
Next, we consider the elasticities of pandemic prevalence with respect to the disease-induced death rates for each city. Since the elasticities are symmetric, we only show the results for origin cities. The simulation results in Fig. 18 suggest that vaccination of individuals in the origin city should be considered when the outbound travel rate is very small and the inbound travel rate is very high. Vaccinations in the destination city decrease the pandemic prevalence in the origin city only when the travel rate into the origin city is very high (see Fig. 19 ).
Fig. 18.

Elasticities of pandemic prevalence in the origin city with respect to the disease-induced death rate . (a) Plot of as a function of k1 and k2. (b) Plot of when . (c) Plot of when .
Fig. 19.

Elasticities of pandemic prevalence in the origin city with respect to the disease-induced death rate . (a) Plot of as a function of k1 and k2. (b) Plot of when . (c) Plot of when .
3.3. Effects of air travel on
We computed the basic reproduction numbers for each origin city and destination city, and , using the parameters described in Section 2.2. In the following, we take City 1 to be Tokyo and City 2 to be a city in the United States, where the transmission rate of pandemic avian influenza in both cities is . When there is no travel between the two cities, we obtain the same reproduction numbers for each city as when the reproduction numbers are computed for each city in isolation:
| (16) |
Fig. 20 suggests that, when k 1 is fixed and k 2 increases, the reproduction number for City 1 increases. On the other hand, when k 2 is fixed and k 1 increases, decreases. The same is true for the reproduction number for City 2 (see Fig. 21 ).
Fig. 20.

Reproduction number for City 1. (a) Plot of as a function of k1 when k2 is fixed at . (b) Plot of as a function of k2 when k1 is fixed at .
Fig. 21.

Reproduction number for City 2. (a) Plot of as a function of k1 when k2 is fixed at . (b) Plot of as a function of k2 when k1 is fixed at .
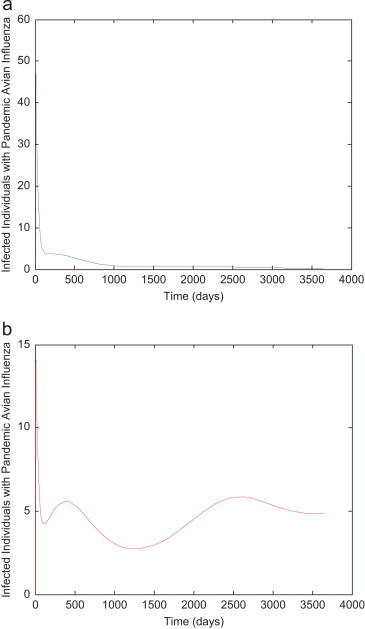
According to Theorem 1, if the reproduction numbers for the cities are greater than one, then the disease will always persist. For example, the reproduction numbers for two cities are and when HPAI is in the endemic state in the bird population (current state). This scenario is illustrated in Fig. 22 (a), where the higher reproduction number leads to higher prevalence of the disease. In a situation where the reproduction number is greater than one in one city and less than one in another city, then the disease still persists in both cities (see Fig. 22(b)).
Fig. 22.

Number of infected individuals with pandemic avian influenza in origin (City 1) and destination (City 2). (a) HPAI is endemic in the bird population; and and ; travel rates between cities are and . (b) HPAI is extinct in the bird population; and and ; travel rates between the cities are and .
Next, we investigate the effects of air travel on the elasticities of the reproduction numbers for various cities. If the cities are isolated and there is no travel that links them, then the elasticities of the reproduction numbers with respect to the parameters , , , , , and are obtained from the analytic expressions given in Eq. (16):
When the two cities are connected via air travel, then the elasticities of the reproduction numbers with respect to the parameters , , , , , and are obtained from their analytic expressions. The elasticities of the reproduction number for City 1 are
The elasticities of the reproduction number for City 2 are
As can be seen in the above expressions, the elasticities of the reproduction numbers with respect to the parameter β p are not affected by the travel rates. However, the elasticities with respect to parameters Λ 1 and Λ 2 are affected drastically. Consider, for example, Fig. 23 (a) and (b), which illustrate the effects of air travel on and , respectively. When, there is no air travel, the reproduction number is very sensitive to changes in Λ 1 (). When the two cities are connected via air travel, then the elasticity drops below 0.04. On the other hand, when the two cities are isolated, the sensitivity of the City 1 reproduction number to Λ 2 is nonexistent, but when the cities are connected, the sensitivity increases above 0.9. The same reasoning holds for City 2.
Fig. 23.
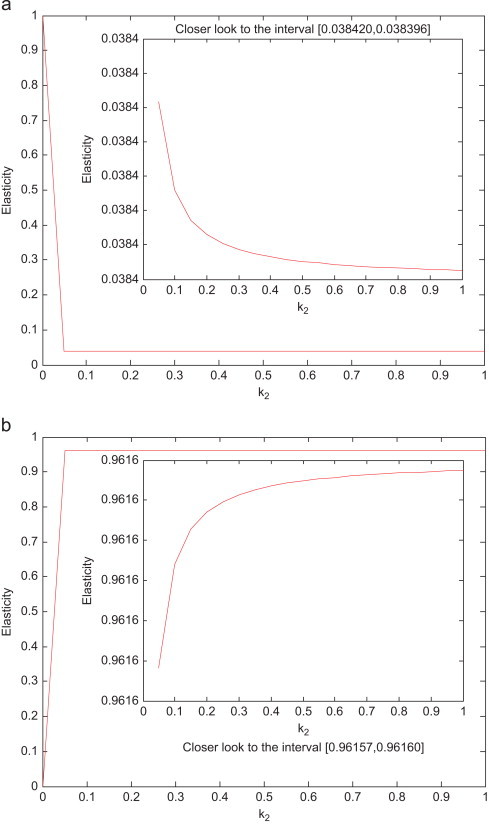
Effects of air travel. (a) Effect of air travel on . (b) Effect of air travel on .
The elasticity of is when there is no air travel. This is a very high sensitivity in the opposite direction, meaning that control measures that decrease the infectious period (e.g., vaccination) result in a large reduction of the basic reproduction number for City 1. When the two cities are connected, but the travel rate from City 1 is assumed to be zero (i.e., and ), then the elasticity remains unchanged. However, if the travel rates for both cities are positive, then the elasticity increases as k 2 increases and decreases as k 1 increases. As Fig. 24 (a) suggests, control measures focused on reducing the infectious period are a waste of time and money if the travel rate out of City 1 is high and the travel rate into City 1 is low. In such a case, the best strategy is to vaccinate individuals in City 2 (see Fig. 24(b)).
Fig. 24.

Plot of elasticities and as a function of travel rates k1 and k2. (a) . (b) and .
4. Conclusions
The two-city model presented in this paper was developed to express and reason about the spread of pandemic influenza from cities in Asia and Australia to the U.S. via air travel. Data obtained from the U.S. Department of Transportation and WHO were used to estimate fixed model parameters such as the travel rate, birth rate and natural death rate. Model parameters such as transmission rates and hypothetical pandemic death rates were obtained or estimated from fitted values in the literature.
The reproduction numbers computed for the bird and human populations (r 0 and R 0) are important threshold values. If either or , then the disease-free equilibrium is unstable, meaning the disease will continue to persist within the populations. In all the cases considered, although the computed R 0 values are small (10−2 or less), the r 0 value is 1.06, which suggests that the DFE is unstable; this agrees with the numerical simulation results.
The sensitivity analysis involving elasticities helps understand the effects of various parameters on R 0 and pandemic prevalence. The results show that culling, which increases the natural death rate of birds and significantly affects the r 0 value, is the most effective control measure that can be applied to poultry. Additionally, control measures such as isolation, quarantine and vaccination should be applied to the human population to reduce pandemic prevalence. Isolation and quarantine decrease the transmission rate, while vaccination affects the transmission rate as well as the infectious period. The effectiveness of the control measures, however, depends strongly on the air travel rate. For instance, if the travel rate out of a city is large (i.e., greater than 0.2), then isolating and quarantining infected and susceptible individuals are not very effective at reducing pandemic prevalence.
An expected result is that air travel has a large impact on R 0. When cities are not connected, the elasticities of the reproduction numbers with respect to recruitment rates are constant (i.e., equal to one). However, when the cities are connected, the elasticities are strongly impacted by air travel. Specifically, when the travel rates are positive, the reproduction number for the origin city is very sensitive to changes in destination city recruitment rate, and vice versa. Generally, the effects of air travel on the elasticities are different for the origin city and destination city. However, upon examining the effect of the induced pandemic death rate, we discovered that when the travel rate out of an origin city is small, vaccination and other similar control measures in the origin city are ineffective, but vaccination in the destination city is much more effective. Thus, combining disease control measures and restricting travel to the appropriate cities is a promising strategy for eradicating pandemic avian influenza.
We hope that this paper will stimulate renewed research on understanding the dynamics of the spread of pandemic disease. Such research can help public health officials and policy-makers select the appropriate disease control measures, and also provide valuable guidance on where to implement control measures while conserving precious resources.
Acknowledgments
This research was supported by NSF Grant DMS-1220342.
References
- 1.N. Ferguson, D. Cummings, S. Cauchemez, C. Fraser, S. Riley, A. Meeyai, S. Iamsirithaworn, D. Burke, Strategies for containing an emerging influenza pandemic in Southeast Asia, Nature 437 (7056) (2005) 209–214. [DOI] [PubMed]
- 2.B. Fields, D. Knipe, P. Howley (Eds.), Fields Virology, Lippincott-Raven, Philadelphia, Pennsylvania, 1996.
- 3.Food and Agriculture Organization, CountrySTAT, Rome, Italy (www.fao.org).
- 4.T. Germann, K. Kadau, I. Longini, C. Macken, Mitigation strategies for pandemic influenza in the United States, Proceedings of the National Academy of Sciences 103 (15) (2006) 5935–5940. [DOI] [PMC free article] [PubMed]
- 5.R. Grais, J. Ellis, G. Glass, Assessing the impact of airline travel on the geographic spread of pandemic influenza, European Journal of Epidemiology 18 (11) (2003) 1065–1072. [DOI] [PubMed]
- 6.S. Iwami, Y. Takeuchi, A. Korobeinikov, X. Liu, Prevention of avian influenza epidemic: What policy should we choose? Journal of Theoretical Biology 252 (4) (2008) 732–741. [DOI] [PubMed]
- 7.S. Iwami, Y. Takeuchi, X. Liu, Avian-human influenza epidemic model, Mathematical Biosciences 207 (1) (2007) 1–25. [DOI] [PubMed]
- 8.S. Iwami, Y. Takeuchi, X. Liu, Avian flu pandemic: Can we prevent it? Journal of Theoretical Biology 257 (1) (2009) 181–190. [DOI] [PubMed]
- 9.K. Kim, Z. Lin, L. Zhang, Avian-human influenza epidemic model with diffusion, Nonlinear Analysis: Real World Applications 11 (1) (2010) 313–322.
- 10.I. Longini, A. Nizam, S. Xu, K. Ungchusak, W. Hanshaoworakul, D. Cummings, M. Halloran, Containing pandemic influenza at the source, Science 309 (5737) (2005) 1083–1087. [DOI] [PubMed]
- 11.J. Lucchetti, M. Roy, M. Martcheva, An avian influenza model and its fit to human avian influenza cases, in: J. Tchuenche, Z. Mukandavire (Eds.), Advances in Disease Epidemiology, Nova Science Publishers, New York, 2009, pp. 1–30.
- 12.M. Martcheva, Avian flu: Modeling and implications for control, Journal of Biological Systems 22 (1) (2014) 1450009.
- 13.C. Mills, J. Robins, C. Bergstrom, M. Lipsitch, Pandemic influenza: risk of multiple introductions and the need to prepare for them, Public Library of Science Medicine 3 (6) (2006) 769–773. [DOI] [PMC free article] [PubMed]
- 14.S. Ruan, W. Wang, S. Levin, The effect of global travel on the spread of SARS, Mathematical Biosciences and Engineering 3 (1) (2006) 205–218. [DOI] [PubMed]
- 15.N. Tuncer, M. Martcheva, Modeling seasonality in avian influenza H5N1, Journal of Biological Systems 21 (4) (2013).
- 16.U.S. Department of Transportation, U.S. International Air Passenger and Freight Statistics Report, Washington, DC (www.dot.gov/policy/aviation-policy/us-international-air-passenger-and-freight-statistics-report), 2013.
- 17.P. van den Driessche, J. Watmough, Reproduction numbers and sub-threshold endemic equilibria for compartmental models of disease transmission, Mathematical Biosciences 80 (1/2) (2002) 29–48. [DOI] [PubMed]
- 18.World Health Organization, Influenza at the Human-Animal Interface, Geneva, Switzerland (www.who.int/influenza/human_animal_interface/en), 2013.
- 19.World Health Organization, Influenza at the Human-Animal Interface, Summary and Assessment as of 4 July 2013, Geneva, Switzerland (www.who.int/influenza/human_animal_interface/Influenza_Summary_IRA_HA_interface_03July13.pdf), 2013.
- 20.World Health Organization, Overview of the Emergence of and Characteristics of the Avian Influenza A (H7N9) virus, Geneva, Switzerland (www.who.int/influenza/human_animal_interface/influenza_h7n9/WHO_H7N9_review_31May13.pdf), 2013.