Abstract
This chapter describes methods for growing, purifying, counting, and characterizing viruses. It also provides general principles of diagnostic virology. As obligate intracellular parasites, viruses require cell in which to replicate. The cells must express appropriate receptors and other proteins required by the virus. Cultured cells are often used to study basic steps in virus replication. Viruses can be purified away from cellular proteins and organelles using centrifugation techniques. Most viruses cannot be seen using standard light microscopes, but are often imaged using electron microscopy. Methods that combine image collection and computationally demanding image processing can provide incredible details about virus architecture. Another common way to visualize viruses is to use fluorescent tags or dyes. Although these techniques do not show detailed virus structures, they can be used to follow the progress of a virus through a cell and can provide a direct window into protein–protein interactions required for virus replication. A more indirect method to detect viruses is to look for virally induced changes to cell morphology. A variety of basic biochemical techniques are useful for analyzing viral proteins and nucleic acids. As the viral genomes are relatively simple, they can be manipulated/mutated to study the function of virtually any viral protein. Powerful genetic techniques can also be used to generate “designer” cells or organisms. There are a variety of methods for quantitating viruses. Infectivity assays measure the ability of a virus to productively infect a cell. Techniques that identify specific viral proteins or genomes provide ways to rapidly identify viruses. Some of these assays can be used at the bedside, or in the field. Powerful and inexpensive DNA sequencing technologies are being used to identify new viruses, many of which could not be found by other methods. The challenge is to understand how or if these viruses impact their hosts.
Keywords: Electron microscopy, fluorescence microscopy, hemagglutination, immunoassay, plaque assay, infectivity assay, polymerase chain reaction, cell culture, centrifugation
This chapter describes methods for growing, purifying, counting, and characterizing viruses. It also presents general principles of diagnostic virology. After studying this chapter, you should be able to:
-
•
Describe general requirements for culturing cells and tissues.
-
•
Describe differences between cultures of primary and transformed cells.
-
•
Describe how centrifugation is used to purify viruses.
-
•
Understand the types of information provided by negative staining electron microscopy (EM), thin sectioning EM, cryo-EM, and confocal microscopy.
-
•
Understand what is being measured by each of the following techniques: plaque assays, PCR, ELISA, hemagglutination, and hemagglutination inhibition assays.
Growing Viruses
Viruses replicate only within living cells, thus many early studies of viruses were done in bacteria or plants. Tobacco mosaic virus (TMV) was an early “model virus” as it replicates in a variety of plants, at levels sufficient for biochemical analysis and imaging. Growing TMV is as simple as applying virus to abraded leaves of a susceptible plant. The earliest studies of animal viruses were limited to using whole animals. When possible animal pathogens were adapted to small animals such as mice, rats, and rabbits. These small animal models provided a means to study viral pathogenesis and vaccine efficacy. Fertile chicken and duck eggs were, and continue to be, widely used for propagating viruses. In the 1940s and 1950s development of robust cell culture techniques revolutionized the study of animal viruses. Today, most animal viruses are grown in cultured cells.
Generating Cell Cultures
The following steps describe an overall strategy for generating primary cell cultures. It is of utmost importance that all work is done under sterile conditions (Fig. 4.1 ):
-
1.
The desired tissue is removed from the animal and is chopped or minced.
-
2.
Tissue fragments are treated with enzymes such as collagenase to degrade the extracellular matrix and release single cells and small aggregates of cells.
-
3.
Cells are pelleted by centrifugation and are resuspended in buffered saline or cell culture media.
-
4.
Additional centrifugation steps may be performed to separate single cells from cell aggregates.
-
5.
Cells and growth media are added to culture dishes and are maintained in a humidified incubator (37°C, 5% CO2).
-
6.
Cells attach to the bottom of the dish where they grow and divide to form a monolayer.
-
7.
The cells can be removed with trypsin, washed, and divided among new culture plates or dishes. This is called a passage, and is done to increase cell number.
Figure 4.1.
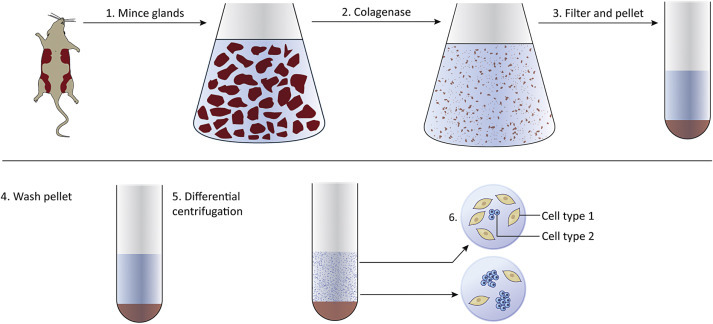
Generating cell cultures begins with removing tissues (normal or tumor) from an animal. Tissues are minced and treated with enzymes to degrade the extracellular matrix. Centrifugation is used to pellet the cells. Cells are resuspended in media and placed in culture vessels.
Primary cells can be propagated for only a limited number of passages before the cells undergo a crisis and the culture dies. Embryonic cells can be passaged many more times than cells taken from adults. Some types of cells (for example, fibroblasts) divide more readily than do cells that are normally nondividing in the adult animal (for example, neurons). Tumors provide another source of cells for virus culture. Tumor-derived cells can often be passaged indefinitely. These immortalized cells are excellent tools for the virologist. They are relatively easy to culture, many types are commercially available and they can be genetically modified. Multiple genes can be introduced, mutated, or deleted to generate an unlimited supply of “designer” cells.
Purifying Viruses
Viruses grown in cultured cells can be purified, quantitated, imaged, and biochemically analyzed. The higher the initial virus concentration the easier it is to purify virus away from cell debris and media components. If a virus is cytopathic it is present amongst the cell debris and media from the dish or plate. In contrast, if the virus is highly cell-associated, the cells must be gently lysed to release the virus. Mixtures of virus and cell debris are subjected to low-speed (~5000×g) centrifugation to pellet cell debris, but not the much smaller virions. At the end of the low-speed centrifugation, the liquid supernatant, containing the virus, is saved and the pellet (containing the cell debris) is discarded. Separating larger from smaller molecules is called differential centrifugation (Fig. 4.2 ).
Figure 4.2.
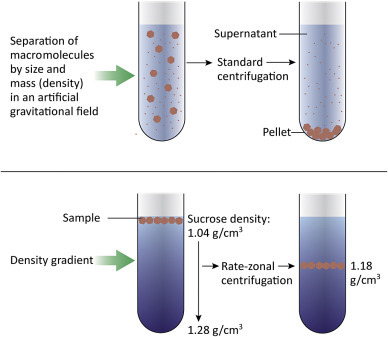
Centrifugation is a common technique used to purify viruses away from cell debris and other small molecules. Low-speed centrifugation (~5000×g) is used to remove cells and large cell debris, leaving virions in the supernatant. Virus can be further purified and concentrated by centrifugation at higher speeds. A gradient of sucrose or glycerol can be used to achieve further purification as materials in the sample will separate into layers depending on their buoyant density.
The virus-containing supernatant can then be recentrifuging at a much higher speed (~30,000–100,000×g) to pellet the virus. After the centrifugation is completed, the supernatant is discarded and the virus pellet is saved. If desired, the virus can be further purified by centrifugation through a density gradient. Sucrose and glycerol gradients are commonly used; a sucrose gradient might range from 40% sucrose at the bottom of the tube to 5% sucrose at the top of the tube. The gradient is prepared and the virus sample layered carefully onto the top. During centrifugation, the components of the sample will separate into layers depending on their buoyant density. By using a gradient, one can achieve a finer separation of the different macromolecules within a sample. If sufficient virus is present in the sample, a visible band forms, and can be carefully removed from the tube.
Visualizing Viruses
Optical Microscopy
Light Microscopes
Light microscopes use visible light (400–700 nm wavelengths) to image objects. They are seldom used to visualize viruses, as they lack sufficient magnifying or resolving power to do so. However, the largest known viruses can be seen with a light microscope. Examples of these very large viruses include Mimivirus, Pithovirus, Megavirus, and Pandoravirus, all of which infect amoebas.
Even though many viruses are far too small to be seen with the light microscope one can often observe virally induced changes to infected cells. A classic example is the Negri body, which was once used as a diagnostic test for rabies virus infection. The Negri body is not “a virus” but is a structure (a type of inclusion body) that is seen in rabies virus-infected neurons. Some inclusion bodies are in fact densely packed virus factories that form at discrete locations in the infected cell.
Fluorescence Microscopy
Fluorescence is the emission of light by a substance that has absorbed light (or other electromagnetic radiation). The basic function of a fluorescence microscope is to irradiate a specimen with high-energy excitation light and detect the much weaker emitted fluorescence. The microscope is designed so that only the emission light (fluorescence) reaches the eye or detector, allowing fluorescent structures to be seen with high contrast against a dark background. This is achieved by use of filters of specific wavelength. The advantage of fluorescence microscopy is that a single fluorescein molecule can emit as many as 300,000 photons before it is destroyed, thus making it theoretically possible to detect a single molecule in a field of view.
Fluorochromes (also termed fluorophores) are stains used in fluorescence microscopy. As in light microscopy, the most useful of these stains attach themselves to specific targets in the cell. For example, DAPI (4′,6-diamidino-2-phenylindole) is a fluorescent stain that binds strongly to A-T rich regions in DNA. DAPI (Fig. 4.3 ) can pass through an intact cell membrane thus can be used to stain both live and fixed cells. It is used extensively in fluorescence microscopy to label the cell nucleus because it binds to ds DNA. Different fluorochromes are excited by specific wavelengths of irradiating light and emit light of defined wavelength and intensity. Thus multiple fluorochromes can be used simultaneously to identify different target molecules within a cell.
Figure 4.3.

Chemical structure of DAPI (top) a fluorescent stain used to stain nuclei. Bottom left, bovine caruncular epithelial cell line (BCEC) stained with DAPI and showing blue nuclei. Bottom right, BCEC infected with bovine viral diarrhea virus (BVDV) showing cell nuclei stained with DAPI and fluorescence cy3-conjugated antibody to detect BVDV (red).
Alternatively, fluorochromes can be chemically attached to molecules, such as antibodies, to specifically label their ligands. Alexa dyes (Fig. 4.4 ) are a series of fluorescent molecules that are widely used as fluorochromes. Among the Alexa dyes, there are choices of molecules with a variety of excitation and emission spectra. If different Alexa dyes are attached to different molecules, cell images can be collected using filters specific for each color. The relationship of one macromolecule to another can be determined by overlaying the images. For example, if a green image and a red image are superimposed, yellow pixels are seen where the tagged macromolecules colocalize in the cell.
Figure 4.4.

Chemical structure of Alexa dye (top). Smooth muscle actin (αSM actin, in red Alexa 594) (bottom left) and neurofilament M200 (NF-M200, in green Alexa 488) (bottom middle); merged shows αSM actin-negative cells (white arrows) (bottom right) (magnification 20×).
From Bouchez et al. 2008.
A viral diagnostic assay called an immunofluorescence assay (IFA) uses tagged antibodies to detect viral proteins in infected cells. IFAs often include DAPI to stain cell nuclei. The result is that all cells have blue DAPI-stained nuclei and infected cells glow green. If cells have fused together due to virus infection, one may see a large cell (syncytium) containing many blue nuclei.
Another way to add a fluorescent tag to a protein is to use genetic engineering (cloning) to add the coding sequence for a fluorescent protein to the coding sequence of a protein of interest. Green fluorescent protein (GFP), isolated from a jellyfish, is a 238 amino acid protein (Fig. 4.5 ) that folds to create a fluorescent center that emits green light. Genes encoding cellular or viral proteins can be modified by addition of the GFP gene to create a “tagged” protein. If the engineered gene is introduced into a cell, the protein product is visible when cells are exposed to UV light. This is a very powerful imaging technique; however, one drawback is that the addition of a relatively large protein tag can alter the trafficking, localization, or enzymatic activity of the protein of interest.
Figure 4.5.
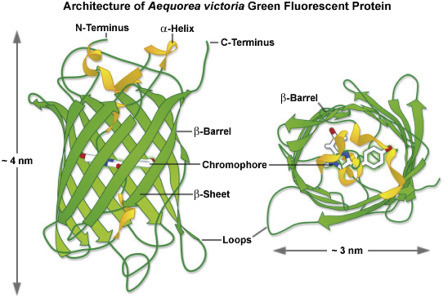
Ribbon diagram showing the structure of the GFP protein.
From Zeiss Education in Microscopy and Digital Imaging. Contributing Authors Richard N. Day and Michael W. Davidson.
Confocal microscopy offers several advantages over conventional fluorescent microscopy. Confocal microscopy uses “point-like” illumination and detection to reduce out-of-focus glare. The method provides the ability to collect serial optical sections through a thick specimen by collecting and measuring the light intensity originating from numerous thin focal areas in a cell. Confocal microscopy can image either fixed or living cells that have been labeled with one or more fluorescent probes. The excitation energies required to reach deep into the cells are very high and specimen damage can result. In contrast deconvolution methods employ conventional widefield fluorescence microscopes for image acquisition. Excitation intensities can be kept low, resulting in less damage to the specimen. Deconvolution is often used to image monolayers of living cells. Deconvolution methods have high computational demands as the images are computationally processed.
Electron Microscopy
The development of EM in the 1930s allowed individual viruses to be seen for the first time. EM uses an electron beam in place of light, and the beam is focused by electromagnets, rather than by glass lenses. EM has great resolving power and can magnify objects by up to ~10,000,000 times. Disadvantages of EM are that fixed and processed samples are dead, and biological samples are heavily damaged by the electron beam even as they are being imaged (sample damage results from the interaction of electrons with organic matter). However, the simple structures and crystalline nature of viruses were first revealed by EM and it remains a common tool of the virologist. In a process called negative staining, heavy metals are used to coat the surface of virus particles to make a “cast” or “relief map” (Fig. 4.6 ). The heavy metal coating is much less sensitive to radiation damage than the biological sample, thus the coated surface structures are well preserved. However, information about internal structures is poor.
Figure 4.6.

Negative stain of bovine coronavirus.
Courtesy: HR Payne.
Thin sectioning is a method that reveals structures inside viruses and cells. Samples are fixed, embedded in resin, and sliced with a diamond knife and a microtome. The sections are carefully placed onto small carbon grids and can be processed in a variety of ways. Samples can be treated with electron dense stains such as uranyl acetate or lead citrate to provide contrast, or samples might be incubated with gold-labeled antibodies. Use of gold-labeled antibodies is a powerful technique that allows the localization of specific molecules within a virus or cell. Micrographs showing the process of virus budding from a cell are produced by thin sectioning (Fig. 4.7 need permissions).
Figure 4.7.
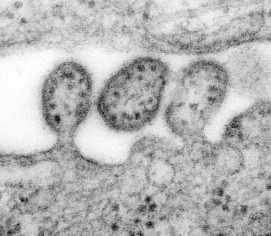
Highly magnified transmission electron microscopic (TEM) image depicting some ultrastructural details of three Lassa virus virions. The virion in the middle has completely budded from its host cell, while the two other particles are in the process of budding. Content provider: CDC/C.S Goldsmith, D. Auperin. Public Health Image Library, Image 8699.
Electron cryomicroscopy (cryo-EM) uses ultralow temperatures (liquid nitrogen or liquid helium) to preserve biological samples. Cryofixation of samples produces a glass-like (vitrified) material rather than crystalline ice. Cryo-EM allows the observation of specimens that have not been chemically stained or fixed, thus showing them in their native aqueous environment. Low temperatures provide for better images with less specimen damage, but cryo-EM micrographs have less contrast than stained images. Cryo-EM images are more complex than negative stains because the entire particle (including the interior) is seen in the image. However, thicker frozen specimens can be cut into thin sections using a cryoultramicrotome. Images generated by cryo-EM are often enhanced by collecting and computationally averaging multiple images. This allows use of lower and less damaging doses of electrons. Tomography is a process whereby a series of images are taken with the specimen tilted at different angles relative to the direction of the electron beam. The images are computationally combined to create 3D images (tomograms) of the sample. Extremely high-resolution (<4 Å) images have been achieved for icosahedral viruses because they are constructed from many repeating subunits that can be computationally averaged. Cryo-EM, while a powerful technique, requires expensive and specialized equipment and highly trained personnel (Fig. 4.8 ).
Figure 4.8.
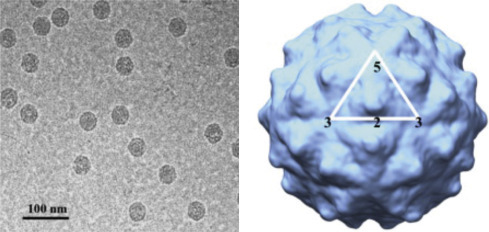
Cryo-EM structure of Flock house virus, virus like particle (VLP). Left panel: Electron cryomicrograph of frozen hydrated VLPs. Right panel: 3D reconstruction using image processing and viewed down the 2-fold axis of symmetry. The icosahedral asymmetric unit is highlighted by the white triangle, showing the 5-, 2-, and 3-fold axes of symmetry.
From: Bajaj et al. 2016.
Counting Viruses
Methods of counting or quantitating viruses fall into two discrete categories. Infectivity assays, as the name implies, measure virions that can successfully infect a cell to produce infectious progeny. Inactivated (noninfectious) virions are not counted. The second category of techniques measures specific virion components, often a specific viral protein, or the viral genome. These techniques are chemical/physical measures of virus quantification and they include serologic assays, polymerase chain reaction (PCR), and hemagglutination assays (HA). Negative staining EM can also be used as a chemical/physical assay to detect and count virus particles. Chemical/physical assays do not distinguish between infectious and inactivated (noninfectious) virions. For example, if one were to take two identical samples and expose one to UV radiation (to damage viral genomes), the amount of viral protein measured would be the same for both samples, even though the irradiated sample contains no infectious virus.
Infectivity Assays
Infectivity assays require cell cultures, embryonated eggs, or animals (or plants or bacteria). An infectivity assay measures particles capable of replicating in a particular cell type or animal.
Plaque assays are a common type of infectivity assay, used to count discrete “infectious centers.” Samples containing virus are serially diluted and aliquots of each dilution are added to a dish of cultured cells (or a plant leaf in the case of a plant virus) (Fig. 4.9 ). Each dilution is usually tested in triplicate. The process is:
-
•
An individual virion infects a cell.
-
•
The virus replicates, producing progeny virions.
-
•
Second generation virions infect and kill surrounding cells to generate a hole or plaque in the cell monolayer that is visible to the naked eye (or at low magnification). Often the live cells are stained, providing a dark background for the clear plaques (Fig. 4.10 ).
Figure 4.9.
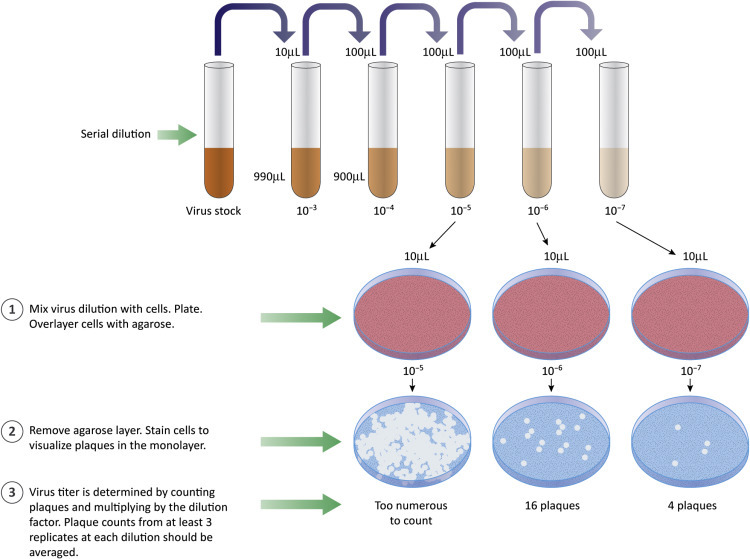
Plaque assays are used to count infectious particles. Samples are diluted and aliquots of each dilution are added to cultured cells. The cells are covered with an agaroseoverlay. Virus produced from an infected cell can infect nearby cells. If infected cells are killed, a region free of cells (the plaque) develops.
Figure 4.10.

Stained cell monolayer with plaques. Living cells are stained purple leaving clear areas (plaques) where cells are absent.
From: Cromeans et al. 2008.
The purpose of making and testing serial dilutions is to achieve a “countable” number of plaques in the cell monolayer. If too many infectious particles are present, individual cells are likely to be infected with more than one virion or individual plaques will merge to form large areas lacking cells. Plots of the number of plaques versus the dilution factor are linear if a single virion is sufficient to initiate a replication cycle (“single hit” kinetics). Results of plaque assays are reported as plaque forming units (PFU) per volume of measure (usually a mL). The term PFU acknowledges that we cannot know, with certainty, that the visualized plaques were formed by infection with a single virus of interest. Use of the term PFU should also remind us that variables such as type of host cell, type of culture media, ion concentration, or pH might affect the apparent concentration of virus. For example, a sample with a titer of 103 PFU/mL on mouse cells might have a titer of 106 PFU/mL on human cells.
What if the virus of interest does not kill infected cells? Can plaque assays be performed? The answer is yes, if there is a method for counting groups of infected cells. Groups of infected cells are called foci and the assays are focus-forming assays. Results are reported as focus-forming units (FFU). It is common to take advantage of antiviral antibodies to stain groups of infected cells. The antibodies can be detected if they are tagged with a either a fluorescent molecule or with an enzyme that can cleave an uncolored substrate to produce a colored product. There are several variations on the focus-forming assays but all have in common the identification of small, discrete groups of infected cells in a monolayer culture (Figure 4.11, Figure 4.12 ).
Figure 4.11.
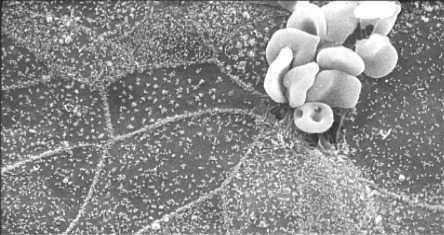
Red blood cells (RBCs) binding to coronavirus infected cells. Bovine coronavirus infected cells are not killed but do express the viral envelope protein on their surface. The viral glycoprotein binds to RBCs. The RBCs serve to “mark” infected area in this electron micrograph.
Courtesy: HR Payne.
Figure 4.12.

Focus-forming assay for hepatitis C virus (HCV). Infected cells were stained with an HCV-specific primary antibody followed by a horse radish peroxidase (HRP)-conjugated secondary antibody.
Endpoint dilution assays are another type of infectivity assay. The general protocol is as follows:
-
1.
Prepare serial dilutions of the virus stock.
-
2.
Use aliquots of each dilution to infect 3–6 test units. A test unit might be a culture dish, a single well on a multiwell plate, a leaf on a plant, or an animal.
-
3.
Incubate test units to allow virus replication.
-
4.
After a predetermined period of time, check each test unit and determine if virus has replicated. If virus can be detected, the unit is scored positive. If no virus is detected, the unit is scored negative.
-
5.
Count the total number of infected and uninfected units at various dilutions.
When the endpoint dilution assay is done in cell cultures, the titer is reported in Tissue Culture Infectious Doses 50% (TCID50) where one TCID50 is the amount of sample that will infect 50% of the test units. For example, if 1 mL of virus sample is added to each of six units, and three of those units are positive at the end of the assay, the TCID50 is 1. However, the results of endpoint dilution assays are seldom “perfect” and calculations based on summing all of the data should be used to derive a titer. End-point dilution assays can be performed using animals and results are reported as Infectious Dose 50% (ID50) or Lethal Dose 50% (LD50), if death is the endpoint. For a given virus sample, the TCID50 titer is often higher than the ID50 titer which is often greater than LD50 titer. Note that virus titers are not absolute values, but rather depend on the type of cells or animals used for the assay.
Chemical/Physical Methods of Virus Quantitation
Chemical/physical methods of virus quantitation measure the amount (or relative amount) of a viral protein, genome, or enzyme, in a sample. Types of chemical/physical methods include:
-
•
Direct visualization of virions by EM.
-
•
Hemagglutination (HA) assay.
-
•
Serological assays (based on antigen–antibody interactions, see Box 4.1). Examples of serologic assays include enzyme-linked immunosorbent assays (ELISA), fluorescent-tagged antibody assays, and precipitation assays.
-
•
Genome quantification by PCR.
Box 4.1. Serologic Assays.
Serologic assays use the power of antibody–antigen interactions (the ability of an antibody to bind its cognate antigen with high specificity).
A primary antibody is one that binds a specific antigen. If HIV is the antigen, the primary antibodies are those that bind to HIV proteins. For a direct ELISA, the primary antibodies are chemically linked to a fluorescent tag or an enzyme tag.
A secondary antibody is one that binds to a primary antibody. If the primary antibody is human-anti-HIV (from an infected patient, for example), the secondary antibody recognizes the human antibody. The secondary antibody might be rabbit, mouse, or goat antihuman IgG. The benefit of using a secondary antibody is that a single aliquot of secondary antibody can be used to detect many different human antibodies, regardless of what antigen those antibodies bind.
The readouts from chemical/physical assays provide no information about the amount of infectious virus in a sample, but they are often convenient, quick, and quite reproducible. They can often be correlated back to infectivity assays as a quick way to estimate the infectivity of a sample. However, if a virus sample is prepared or stored incorrectly, the protein or genome concentration might remain unchanged despite a significant decrease in the infectivity titer.
Hemagglutination Assay
Some viruses bind to red blood cells (RBCs). Hemagglutinating viruses bind to sialic acid residues on the RBCs. A single virion can bind to several different RBCs, and an RBC can be bound by multiple virions to form a large network, or web, of cell and virus that is easily visualized. The HA is fast and inexpensive and does not require either sophisticated instrumentation or extensive training. It is done by preparing serial dilutions of a virus sample. An aliquot of each dilution is added to RBCs in a microtiter plate well or test tube. One well contains RBCs and saline (negative control) and another contains a known positive reference sample of virus. The samples are gently mixed and allowed to sit at room temperature. In the negative wells the RBCs will slide down to form a tight button at the bottom of the tube. In positive wells the RBCs and virions will bind to each other to form a mesh of cells on the bottom of the tube. The reciprocal of the highest dilution of virus that give a positive HA is the HA titer (Fig. 4.13 ).
Figure 4.13.

Some viruses bind to RBCs, causing the cells to form a lattice. Note that positive hemagglutination is the presence of a lacey layer of RBCs. If virus is not present, the RBCs slide to the bottom of the tube to form a tight “button.”
Serologic Techniques
Hemagglutination Inhibition Assay
HIA is a serologic assay that be used either to detect antibody to a virus or to identify a suspect virus. The HIA is performed by first mixing virus samples with dilutions of serum. Antibody is allowed time to bind the virus and then RBCs are added to the mix. Viruses that have bound to antibody will be unable to bind to RBCs. Thus in the HIA, the absence of hemagglutination is a positive result. If a hemagglutinating virus is the known reagent, the HI assay can be used to detect antibody. If the hemagglutinating virus is unknown, it can be identified by using a panel of known antibodies.
Virus Neutralization Assay
A virus neutralization assay is used in conjunction with an infectivity assay, such as the plaque assay described above. This assay detects antibody that is capable of inhibiting virus replication (or in other words, antibody that can neutralize virus infection). Virus neutralization is a specialized type of immunoassay because it does not detect all antigen–antibody reactions. It only detects antibody that can block virus replication. This is important because related groups of viruses may share common antigens, but only a fraction of these antigens are targets of neutralizing antibody. A virus serotype is usually based on virus neutralization (although this is not always specified). For example, there are three major poliovirus serotypes (neutralization serotypes). In order to protect against poliovirus infection, a successful vaccine must induce neutralizing antibodies to poliovirus Types 1, 2, and 3.
Enzyme-Linked Immunosorbent Assays
Interaction of antibodies with their cognate antigens can be visualized if the antibody is “tagged” (Fig. 4.14 ). The tag can be an enzyme that cleaves a substrate (substrate turns color upon cleavage), a radioactive isotope, or a fluorescent molecule. Serologic assays are commonly used in research and diagnostic laboratories. ELISAs (See Box 4.2) require that either antigen or antibody be adsorbed onto a plate or tube (often plastic). As proteins readily bind to many types of glass or plastic, the adsorption part of the assay is straightforward. The enzyme used for detection is often either horseradish peroxidase (HRP) or alkaline phosphatase (AP). These enzymes relatively stable, cheap, and easy to purify, and they can be chemically linked to an antibody to aid in detection of an immune complex. There are inexpensive substrates that change from colorless to colored when cleaved by these enzymes. ELISAs can be used to detect either antigen (a virus, for example) or antibody (from a potentially infected individual). Antigen detection ELISAs can be used to quantitate the amount of virus in a cell culture supernatant or patient sample. In this case the primary antibody is a purchased and/or standardized reagent. Antibody detection ELISAs demonstrate the presence of antibodies to a specific pathogen (i.e., human immunodeficiency virus, HIV) in patient sera. In this case the antigen is the standardized reagent. The presence of antibody signifies that the patient has either been infected (or vaccinated) with the agent in question.
Figure 4.14.
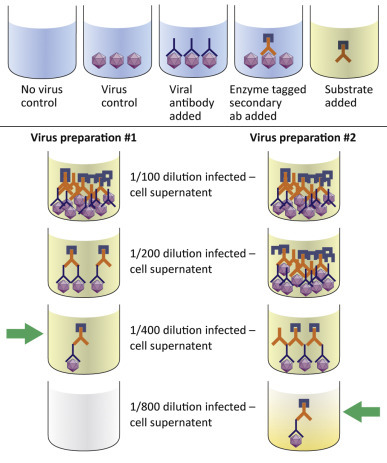
An ELISA can be used to determine the relative titer of a virus stock. The titer is expressed as the reciprocal of the highest dilution at produces a positive color.
Box 4.2. Variations of the ELISA can be used for Antigen or Antibody Detection.
Direct ELISA. Primary antibodies (i.e., anti-influenza virus antibodies) are chemically linked to enzymes such as horseradish peroxidase (HRP) or alkaline phosphatase (AP). These reagents facilitate detection of viral antigens in a sample. If a fluorescent molecule is attached to the primary antibody, the assay is a fluorescence-linked immunosorbent assay.
Indirect ELISA. The primary antibody is untagged, but a tagged secondary antibody is used to detect the presence of primary antibody. For example, if the primary antibody is developed in an immunized rabbit, the secondary antibody is anti-rabbit IgG (perhaps obtained from mice immunized with rabbit IgG). Indirect ELISAs are common because it is cheaper to tag one batch of antirabbit IgG than to tag the specific antibodies directed against hundreds of different viral (or other) proteins.
Sandwich ELISA. The antigen of interest is “sandwiched” between two antibodies. An antibody or a serum sample is used to coat the dish or tube. A sample containing an antigen is added and allowed to bind to the antibody. A second antibody is added to the wells. It will bind to the antigen (if present). In this example the antigen must be able to interact with two antibodies. Requiring that two different antibodies react with the same antigen can improve the specificity of the assay.
Cell-Based Fluorescent Antibody Assays
Highly specific antibodies tagged with fluorescent molecules can be used to detect the presence of viral antigens in cells. Assays can be direct (using labeled primary antibody) or indirect (using labeled secondary antibody) (Fig. 4.15 ). The technique allows one to distinguish infected from uninfected cells, thus can be used to perform focus-forming assays.
Figure 4.15.

Cell-based IFAs use tagged antibodies to mark infected cells. Direct immunofluorescence used tagged primary (antiviral) antibodies. Indirect immunofluorescence uses a secondary antibody that is tagged.
Western Blots
Western blots are labor intensive and expensive, but provide a method of confirming the identity of a reactive antigen. Western blots are done by electrophoresis of antigen (i.e., purified virus) by sodium dodecyl sulfate (SDS) polyacrylamide gel electrophoresis (PAGE). The proteins in a mixture are separated by size in the gel and are transferred from the gel to a solid (paper-like) substrate often called a membrane. The membrane is incubated with patient sera and the presence of patient antibodies is detected by subsequently incubating the membrane with labeled secondary antibodies. The specificity of the western blot lies in its ability to demonstrate the molecular weights (sizes) of the proteins recognized by patient sera. False positive reactions can be identified when the immunoreactive protein band does not correspond in size to known viral proteins. For diagnostic purposes, a positive western blot may require that more than one viral protein be bound by patient antibodies.
Immunohistochemistry
The basis of immunohistochemistry is that a tissue section is incubated with enzyme-tagged antibodies. A colorless substrate is added to the sample. If enzyme-tagged antibodies are present, the substrate is cleaved to produce a colored precipitate. This is a powerful technique as it allows one to examine individual virus-infected cells in a tissue section. Patient samples (biopsies) are often preserved in formaldehyde or are stored frozen at ultracold temperatures. If these samples are archived, they can be tested for the presence of viral antigen even after years or decades (Fig. 4.16 ).
Figure 4.16.

Immunohistochemistry is a technique used to detect viral antigens in tissue sections. In this example a brain section has been treated with antibodies to a bornavirus. The antibodies are tagged with an enzyme, producing a brown precipitate that indicates bornavirus-infected cells.
Courtesy: I. Tizard.
Detecting Viral Nucleic Acids
Polymerase Chain Reaction
PCR can be used to identify and/or quantitate viral genomes in a sample. PCR is a very sensitive method and uses oligonucleotide primers designed to detect suspect viruses. Advantages of PCR include: (1) The PCR product (DNA) can be rapidly sequenced providing genetic information about the virus. (2) Primer sets can be designed to recognize sequences common among groups of related viruses or can be used detect a specific member of a virus group. (3) Multiple primer sets can be used to look for more than one suspect virus in a sample.
PCR assays are very sensitive, but sensitivity can be a disadvantage as well as an advantage. When performing PCR for diagnostic purposes, it is essential that every precaution be taken to avoid contaminating patient samples. This often requires separate equipment and work areas. For example, a “clean” area to process the patient sample, another area to set up the assays and a third area where the PCR products are synthesized and analyzed. It is also important to test all purchased reagents for the presence of contaminating nucleic acids. This requires multiple negative controls. For example, one might apply sterile buffer or water to a nucleic acid purification column to check the column for contamination with viruses that might have been introduced during the manufacturing process.
High Throughput Sequencing
While PCR amplification requires some prior knowledge of a viral sequence, it is now routine to sequence all nucleic acid (DNA and RNA) in a sample, using high throughput, unbiased sequencing techniques. Sequencing technologies can provide a genome’s worth of data (billions of nucleotides) in a day. Powerful algorithms are used to analyze the data and compare it to information stored in public databases. Sequences of no interest (human DNA in a patient sample) can be ignored, allowing the investigator to quickly focus on any viral sequences that may be present. As in the case of PCR, the sensitivity of the assay is both a positive and a negative, and the most careful researchers will include multiple negative controls in their assays. Use of unbiased sequencing has resulted in an explosion of new viruses from humans, animals, and environmental samples. The current challenge is to develop an understanding of which viruses might be threats and which are part of our normal viral flora.
Basic Principles of Diagnostic Virology
The purpose of diagnostic virology is to identify the agent most likely responsible for causing disease in a human or animal patient. Virus identification can be used to:
-
•
Determine treatment strategies (although there are only a handful of antiviral medications are available).
-
•
Predict disease course and expected outcome.
-
•
Predict the potential for virus spread.
-
•
Allow identification of, and vaccination of, susceptible individuals.
-
•
Trace the movement of a virus through a community, or world-wide.
For the medical practitioner, methods for identifying the virus in an infected patient ideally should be sensitive, specific, and rapid, as once a patient has recovered (or died) diagnosis has less practical value (although a diagnosis could benefit family and community members). On the other hand, epidemiologic studies may include hundreds or thousands of samples requiring use of low cost, high throughput modalities.
Common targets for diagnostic tests are viral proteins (antigens), viral genomes, and/or antiviral antibodies. Some are designed to detect viral proteins, enzymes, or genomes directly from a patient sample (blood, throat swab) and these are useful in a clinical setting. One type of rapid diagnostic assay design (lateral flow immunoassay) uses the process of diffusion to move a sample across a test chamber. The liquid sample contacts various dried reagents as it flows through the chamber. Among the strengths of the lateral flow immunoassay is the ability provide rapid diagnostic capabilities in a medical/veterinary setting. Tests can be designed to detect either antigen or antibody from a patient sample. An example of an antigen capture assay is shown in Fig. 4.17 . The test strip contains three key assay reagents (dried on the strip). Closest to the sample addition chamber is an antiviral antibody. In our example the antibody is conjugated to gold nanoparticles. When the liquid from the patient sample is applied, it flows, by capillary action, across the slide and will encounter the labeled antibody. The labeled antibody is picked up in the flowing liquid and will bind to any viral antigen present in the sample. The liquid continues to move across the slide (by capillary action) until it hits the Test (T) strip. In our example the T strip contains antibody to the virus in question. If the labeled antibody is bound to virus, it will be stopped (captured) at the test strip. If the labeled antibody is not bound to virus, it will move past the T strip and reach the control (C) strip. Anti-immunoglobulin antibodies are bound at the C strip and will capture any labeled immunoglobulin in the liquid. Thus if the sample is positive for virus, a colored line should appear at the T strip and the C strip (because there is excess labeled antibody). If the sample is negative for virus, the T strip will remain colorless but the C strip will be positive.
Figure 4.17.
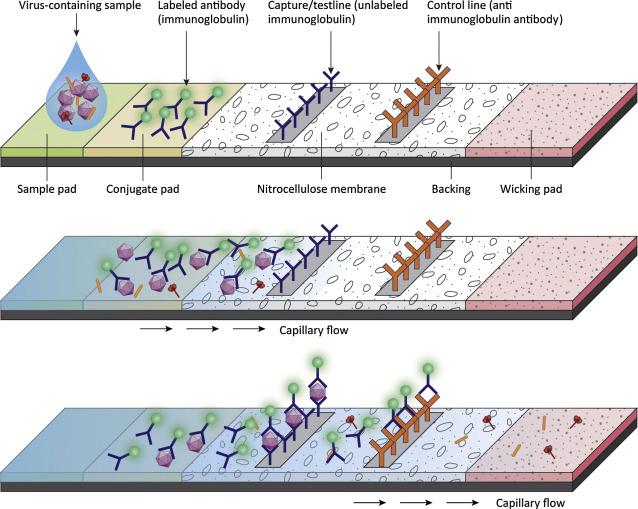
An antigen capture, lateral flow immunoassay. The test strip contains three key assay reagents. In this example a gold-conjugated antibody binds to virus in the test sample. The liquid moves across the slide by capillary action to the Test (T) strip. The T strip contains membrane bound antiviral antibody. It will bind to capture the virus particles and their associated gold tagged antibodies to generate a visible signal at the T strip. If no virus is present in the sample, the gold-labeled antibody travels past the T strip and binds to anti-immunoglobulin antibodies bound at the C strip. A positive sample must show color reactions at both the T strip and the C strip. A negative sample must show a color reaction at the C strip (to validate that the test worked correctly).
Often there is not enough virus present in the infected host to allow for direct detection in a patient sample. In that case the sample may be sent to a diagnostic laboratory for inoculation into cultured cells (or fertile eggs) to generate higher concentrations of virus. The infected cultures are closely observed for visible changes, such as cell killing (cytopathic effects), changes in cell morphology, or formation of syncytia (fused cells). Any of these changes in the infected cell cultures (as compared to uninfected controls) provides an indication that an agent is replicating, and that further testing is warranted to identify the agent. Growing viruses is labor intensive, takes days to weeks, and presents biosafety issues. Patient samples are often inoculated into several different types of cells in the hopes that at least one type will be susceptible. Infected cultures can provide abundant material for detection of viral antigens by ELISA, IFA, immunohistochemistry, or western blots. They can also provide material for PCR or direct sequencing, or EM can be used to look for the presence of virus particles in samples. (EM is not usually helpful for direct examination of patient samples as the amount of sample on one microscope grid is very small and it can be tedious to survey more than a handful cells at the highest magnifications. (However, some enteric viruses, for example, rotaviruses, are present in high enough concentrations in stool samples and can be visualized by EM.)
Recent or past exposure to viruses (or immunization) can be determined by detecting antiviral antibodies in patient samples. This type of assay requires a panel of viral antigens against which antisera can be tested. It is possible to detect not only antiviral antibody, but also to determine the class of antibodies in the sample. Detection of IgM indicates recent or acute infection, as these are the first antibodies produced in response to infection. Detection of antiviral IgG indicates that the patient is, or has been, infected with a particular virus; however, IgG may also be present due to prior immunization. Measuring IgG levels can be helpful for diagnostic purposes if two patient samples are available: one collected early in the disease process (acute serum sample) and one collected after recovery (convalescent serum sample). If the IgG titer in the convalescent serum is higher (>fourfold higher) than in the acute sample, a diagnosis can be made.
Immunoglobulin titers can be measured using ELISA or IFA. Immunoglobulin can also be measured by its ability to precipitate a particulate antigen (precipitation assays), to block hemagglutination (HIA) or to inhibit virus infectivity (virus neutralization assay).
A few biochemical and molecular techniques commonly used by virologists are described in Box 4.3, Box 4.4.
Box 4.3. Common Biochemical and Molecular Techniques for Investigative Virology (1).
In addition to the techniques described above, the virologist has a wide array of molecular and biochemical tools that can be used to study virus replication and/or pathogenesis. The scope of this text does not allow a complete discussion of these techniques but short descriptions of some common techniques are provided.
Electrophoresis. Charged molecules can be separated in an electric field. Often the electric field is applied to a semisolid gel (agarose or polyacrylamide) so the components in a sample can be separated by charge and/or size. Addition of SDS to a protein sample coats the proteins with a uniform negative charge so they are separated based on size alone. Nucleic acids have a uniform net negative charge, thus are easily separated by size using agarose or polyacrylamide gels. Gels are treated with specific stains to detect the presence of proteins or nucleic acids. Materials in the semisolid gel can be transferred to a solid support, or membrane, for additional manipulations, such as incubation with antibodies (western blot).
Chromatography is the collective term for a group of techniques used to separate molecules in a mixture. A liquid mixture is applied to material packed in a column (column chromatography), or layered onto plate (thin layer chromatography). Separation is based on the relative ability of the components in the mixture to move through or across the support materials. Chromatography can be applied to any mixture of molecules but the research virologist most often uses column chromatography to separate viral proteins.
Size exclusion chromatography employs beads with pores of defined sizes. Larger molecules are excluded from the beads, thus move quickly through the column. Smaller molecules enter the pores in the beads and this slows down their passage through the column. The result is that larger molecules are eluted from the column before smaller molecules. Thus molecules (i.e. different viral proteins) are separated by size.
Ion exchange chromatography uses charged materials in a column to separate macromolecules based on their charge. If the material in the column is negatively charged, molecules with a positive charge will be retained in the column. By changing buffer conditions (pH and ion concentrations), macromolecules can be separated on the basis of charge.
The basis of affinity chromatography is the very specific interaction between two molecules (for example, the interaction of an antibody to its cognate antigen). If an antibody is attached to a solid support, it can be used to capture antigen from a dilute solution. After washing away unbound material, the antigen can be released from the column by changing salt and or pH of the buffer. Proteins A and G are bacterial proteins that bind to immunoglobulins. They are used to affinity purify antibodies and antibody/antigen complexes.
Box 4.4. Common Biochemical and Molecular Techniques for Investigative Virology (2).
Flow Cytometry. Cells are suspended in a stream of fluid and flow past an electronic detection apparatus. The number of cells passing the detector is counted. Thousands of cells per second can be counted. Often cells are labeled with fluorescent dyes (tagged antibodies, for example) and are not only counted, but are separated into different collection tubes based on labeling patterns. The process is often used to get pure populations of cells from a mixture. Immunologists take advantage of the fact that different types of proteins are found on the surfaces of different types of lymphocytes. Thus labeled antibodies can be used to quantitate and separate different lymphocyte subsets from a blood sample. Not only can the presence of a molecule on the cell surface be detected, but the relative amounts can be determined as well. Flow cytometry is also used for viral diagnostics. Cells infected with an unknown agent can be incubated with panels of antibodies.
Reverse Genetics. Virologists study viral genes to determine their functions. Historically this was accomplished by finding and purifying mutant viruses to determine how they differed from their “wild-type” parents. With the development of gene cloning technologies, virologists are able to clone entire viral genomes, manipulate them in the laboratory (introduce specific mutations) and examine the effects on virus replication or disease. Introducing specific mutation is the “reverse” of traditional genetic method of identifying a mutant phenotype and then determining the genetic cause. In order to do reverse genetics, the virologist usually starts with a cloned viral genome that can be introduced into cells to produce infectious virus.
Designer Cells and Designer Animals. In addition to mutating viral genes, virologists manipulate the hosts as well. It is relatively easy to add, delete, or modify the genetic makeup of cultured cells. Animal genomes can be modified as well. Systems to create designer mice are reasonably efficient and hundreds of types of genetically modified mice are commercially available. What is gained by modifying the host? At every step in the virus life cycle, viral proteins interact with cellular proteins and a single viral protein may interact with dozens of cellular proteins. To analyze the effects of just one type of interaction, it may be preferable to modify the host genome. It is also possible to genetically alter a resistant host to render it susceptible to a virus. For example, the receptor for a human virus could be added to mouse cells to generate a tractable animal model. It can be challenging for a student of virology, new to reading scientific literature, to determine the types of virus or host mutations that have been used to obtain data for a specific study. But this is critical to understanding and evaluating experimental results.
In this chapter we have learned:
-
•
A general method for obtaining and culturing cells. Primary cultures contain cells obtained from an animal and they have a limited lifespan. Tumors are a source of immortalized or transformed cells that can divide continuously.
-
•
A basic method for virus purification using centrifugation.
-
•
Methods to visualize viruses including negative staining EM, thin sectioning. EM, cryo-EM, and confocal microscopy.
-
•
Methods to count infectious virus particles (plaque assays and endpoint dilution).
-
•
The basic features of common techniques used to detect viruses and antibodies.
References
- Bajaj S., Dey D., Bhukar R., Kumar M., Banerjee M. Non-enveloped virus entry: structural determinants and mechanism of functioning of a viral lytic particle. J. Mol. Biol. 2016;428:3540–3556. doi: 10.1016/j.jmb.2016.06.006. http://dx.doi.org/10.1016/j.jmb.2016.06.006 [DOI] [PubMed] [Google Scholar]
- Barretto N., Uprichard S.L. Hepatitis C virus cell-to-cell spread assay. Bio-Protocol. 2014;4(24):e1365. doi: 10.21769/BioProtoc.1365. http://dx.doi.org/10.21769/BioProtoc.1365 [DOI] [PMC free article] [PubMed] [Google Scholar]
- Bouchez G., Sensebe L., Vourc’h P., Garreau L., Bodard S., Rico A. Partial recovery of dopaminergic pathway after graft of adult mesenchymal stem cells in a rat model of Parkinson’s disease. Neurochem. Int. 2008;52:1332–1342. doi: 10.1016/j.neuint.2008.02.003. [DOI] [PubMed] [Google Scholar]
- Bridger P.S., Menge C., Leiser R., Tinneberg H.-R., Pfarrer C.D. Bovine caruncular epithelial cell line (BCEC-1) isolated from the placenta forms a functional epithelial barrier in a polarised cell culture model. Placenta. 2007;28:1110–1117. doi: 10.1016/j.placenta.2007.07.002. [DOI] [PMC free article] [PubMed] [Google Scholar]
- Cromeans T.L., Lu X., Erdman D.D., Humphrey C.D., Hill V.R. Development of plaque assays for adenoviruses 40 and 41. J. Virol. Methods. 2008;151:140–145. doi: 10.1016/j.jviromet.2008.03.007. http://dx.doi.org/10.1016/j.jviromet.2008.03.007 [DOI] [PubMed] [Google Scholar]


