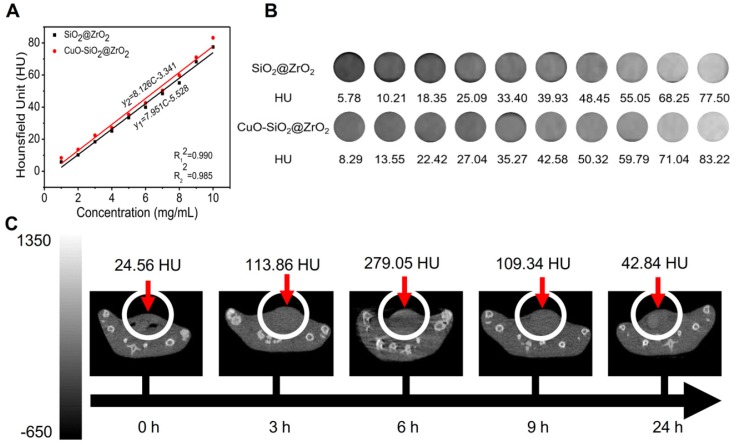
Figure 6.
The CT imaging effect of IQuCS@Zr-PEG NSPs in vitro and in vivo. (A,B) The CT effect of different concentrations of SiO2@ZrO2 NSPs and CuO-SiO2@ZrO2 NSPs aqueous solutions in vitro. (C) After injection of 50 mg/kg of the IQuCS@Zr-PEG NSPs into tail vein of mice, the CT imaging results in vivo were measured at 0, 3, 6, 9 and 24 h, respectively.

