

Abstract
Cancer survivorship has increased greatly as therapies have become more advanced and effective. Thus, we must now focus on improving the quality of life of patients after treatment. After chemotherapy, many patients experience chemotherapy-induced cognitive decline, indicating a need to investigate pathologies associated with this condition. In this study, we addressed cognitive impairment after thioTEPA treatment by assessing behavior and assaying cytokine production and the structure of dendrites in the hippocampus. Male mice were given 3 intraperitoneal injections of thioTEPA. Five weeks later, the mice underwent behavior testing, and brains were collected for Golgi staining and cytokine analysis. Behavior tests included y-maze and Morris water maze and licking behavioral task. Cytokines measured include: IL-1α, IL-1β, IL-2, IL-3, IL-4, IL-5, IL-10, IL-12p70, MCP-1, TNF-α; GMCSF; and RANTES. We observed decreased memory retention in behavioral tasks. Also, dendritic arborization and length were decreased after chemotherapy treatment. Finally, thioTEPA decreased cytokine production in animals treated with chemotherapy, compared to saline-treated controls. Here, we used a mouse model to correlate the decreases in dendritic complexity and inflammatory cytokine production with cognitive impairment after chemotherapy.
Introduction
Increase in cancer survivorship can be attributed to advancements in the treatment and diagnosis of disease. Patients are living longer than before, with more than 60% of patients surviving for more than 20 years after treatment (1)—it is expected that there will be 70 million survivors by 2020 (2). Because more patients are experiencing the long-term effects of chemotherapy, it is imperative that the post-treatment side effects are assessed. In fact, 17-34% of cancer and chemotherapy patients experience long-term cognitive deficits post-treatment (3). These cognitive deficits, or “chemobrain,” are defined as neurological side effects that occur years after treatment (4, 5). Symptoms include memory impairment and decreases in learning, concentration, executive function, reasoning, and attention and visuospatial skills (5).
ThioTEPA is a chemotherapeutic agent that has been used for more than 50 years to treat breast, ovarian, and bladder cancers (4, 6). It prevents cell division by alkylating DNA, producing cytotoxic DNA–DNA cross-links (7); specifically, thioTEPA adds alkyl groups to guanine residues, preventing the proper replication of DNA strands. thioTEPA becomes active in cells when it is converted to TEPA (N,N’,N”-triethylenethiophosphoramide) by cytochrome P450 isozymes (8). Importantly, TH can form cross-links between helices of DNA and between DNA and protein, making it a bifunctional agent (8).
The clinical use of thioTEPA has been reduced due to bone marrow toxicity. However, in situations where such toxicity is not a factor, such as when bone marrow transplantation is an option, thioTEPA use has grown in popularity (8, 9) (10-12). thioTEPA treatment is also associated with mucositis and central nervous system toxicity, leading to nausea, vomiting, and diarrhea (8, 13). Skin rashes and dermatitis have also occurred during treatment with thioTEPA; however, these are reversible (8, 14). It is usually given at 12–24 mg/m2 and administered every 4 weeks in low-dose therapy protocols (15). However, in high-dose protocols, thioTEPA is given at 200-300 mg/m2 (13, 16) The metabolite TEPA penetrates into the cerebral spinal fluid (CSF) after intravenous or intraventricular administration of thioTEPA, with intraventricular administration producing more rapid absorption (6, 8). ThioTEPA and TEPA can cross the blood-brain barrier, producing concentrations in the CSF that are similar to those in plasma (17) and increasing the potential for neurotoxicity.
The hippocampus is a major sites of neurogenesis, with implications for learning and memory (18). ThioTEPA targets neural progenitor cells by preventing the differentiation of new neurons and, therefore, the formation of new connections (19). ThioTEPA also impairs the proliferation of new neurons in the dentate gyrus, the major site of neurogenesis within the hippocampus. The dentate gyrus is also a major site of spatial learning and recognition (20). Murine studies have found impairment of recognition memory during a novel-object recognition test 8–12 weeks after thioTEPA treatment and impairment of spatial memory during a Morris water-maze task 20 weeks after TH treatment (20). Previous studies have been associated with cognitive decline, however few of such studies have used histological techniques to observe changes in neurophysiology after chemotherapy administration. In our study, we aim to show cognitive deficits after thioTEPA and also observe potential histological changes in the hippocampus.
Dendrites are projections of neuronal cells that make connections between neurons (21). These connections are made through the branches of dendrites, which can be generated by multiple mechanisms: 1) the splitting of a growth cone or 2) new dendrites branching off of existing ones via alterations in actin and other microtubules (22-24).
ThioTEPA has previously been found to cause potent neurotoxic effects in vitro and in several brain regions in vivo by causing dendritic swelling as a result of glutamate excitotoxicity (25). Moreover, intrathecal administration of thioTEPA combination chemotherapy causes severe polyneuropathy and loss of motor function (26). The study reported here was designed to assess how a relatively low dose of thioTEPA would affect cognition and motor coordination, dendritic complexity and cytokine production levels. Such data could provide critical information about the mechanism by which neural circuitry is disrupted after chemotherapy.
Materials and methods
Animals
Two-month-old male mice C57BL/6J were given intraperitoneal (IP) injections of thioTEPA (10 mg/kg) (27) or saline weekly for 3 weeks. Five weeks after the TH injections, animals underwent behavior testing. Y-maze testing was conducted first, followed by a Morris water-maze paradigm. The mice were housed under a constant 12-hour light/12-hour dark cycle and were cared for in compliance with the guidelines set forth by the Institutional Animal Care and Use Committee at the University of Arkansas for Medical Sciences.
Y-maze
To assess short-term spatial memory and novel-environment exploration, we used a Y-maze behavioral paradigm. The Y-maze consists of 3 arms (each 45 x 15 x 30 cm)—the start, familiar, and novel arms—and a unique object is placed at the end of each arm. During the training trial, mice were exposed to the start and familiar arms for 5 minutes. During the testing trials, the mouse was allowed to explore all 3 arms for 5 minutes. The time spent in the novel arm was compared to the amount of time spent in the familiar and start arms. An intertrial period of 4 hours was observed between the training and testing trials. Each session was recorded on a CCD video camera located above the maze for automatic behavioral analysis with EthoVision software version 11 (Noldus Information Technology).
Morris water maze
We measured spatial memory with the Morris water-maze paradigm (MWM). A circular pool (140 cm diameter) was filled with opaque water kept at 24°C, and mice were trained to locate a visible platform in the pool (luminescence, 200 lux). To determine if thioTEPA treatment affected the ability of mice to complete the MWM, mice were trained to find the visible platform (days 1 and 2) using visual cues placed around the pool. The platform was moved around the pool to different quadrants during training trials. On days 3 through 5, the platform was placed under the water (hidden) to test the ability of the mice to use visual cues to locate the platform. The platform was placed in the same location for each group during the hidden-platform trials.
There were 2 daily sessions spaced 2 hours apart. Each session consisted of 3 trials, with the start location changing for each trial. Trials terminated when mice either found the platform or swam around the pool for 60 seconds. If a mouse did not find the platform, the examiner would place their finger in the pool in front of the mouse to guide the animal to the platform. In this scenario, mice had to stay on the platform for 10 seconds before being removed from the pool. Distance moved during the visual/hidden trials and probe trials were recorded with the EthoVision XT video tracking system (Noldus Information Technology), which was set at 6 samples/second.
To assess spatial memory retention, the platform was removed from the pool, and probe trials were performed by allowing the mice to swim around the pool for 60 seconds. Mice were placed in the quadrant opposite of the target quadrant, and the amount of time spent in each quadrant was compared. Average velocity and distance to the platform were used to measure performance in the visual- and hidden-platform sessions.
Analysis of motor control through licking paradigm
Mice were deprived of food and water for approximately 24 hours before their licking activity was recorded. Licking tests were performed in the afternoon while the light was on in the laboratory. A solution of 10% sucrose was prepared (500 g of sucrose in 5 L tap water), and the mice were placed in testing cages for 5 minutes before introducing the bottles of sucrose. Mice were weighed 3 times: before food deprivation, before testing, and after testing.
Bottles were filled almost completely (~400 ml) with sucrose solution to decrease the possibility of dripping from the spout. The bottles were stored in the refrigerator and taken out 60 minutes before being put in the cage to equilibrate to room temperature.
New paper towels (3 in x 2 in) were put on the bottom of each cage to absorb any dripping sucrose solution. Then, an aluminum screen (Brite Aluminum Screen, Phifer 36 in x 84 in, Model # 3000043, Home Depot) was cut to fit the bottom of each cage and connected to the top metal grid and the ground of Bayonet Neill–Concelman (BNC) cables.
To record licking activity, we used methods similar to those published previously (30-32). The central pin (core) of a BNC cable input connector of an analog/digital converter (Digidata 1322A, Molecular Devices, Sunnyvale, CA) was connected to a silver wire (0.5 mm diameter) that was introduced into the sipper tube from within the drinking bottle; the wire exited the bottle via the stopper, which firmly closed the bottle. The grounded housing (shield) of the BNC cable was connected to the aluminum screen that served to ground the animal while moving freely inside the cage.
Each lick closed the electrical circuit for the duration of the tongue–sipper tube contact, and the junction potential between the sipper tube or the fluid and the saliva of the mouse was recorded. We chose an unrestricted configuration (i.e., access to water similar to that in its normal cage when housed in the animal facility). In our setup, the stainless steel sipper tube was covered with a transparent hard plastic tube to prevent the mouse from making contact unless it was actually drinking. Spouts were made by drilling a hole (7/64 inch, 2.78 mm drill bit) at the bottom of plastic collection tubes (2 ml, Qiagen GmbH). The metallic spouts were coated with 2-Ton Clear Epoxy, and the plastic collection tubes were placed on top of the metallic spouts.
Licks were recorded as junction potentials created when the mouse touched the spout with its tongue (30), and no current or voltage was applied to the animal when the circuit was closed. The baseline noise was typically < 5 mV, and a positive voltage step of 50 mV to 800 mV with rise time < 1 ms could be measured whenever the mouse’s tongue touched the fluid at the tip of the sipper tube. The Digidata 1322A has an input range of ± 10 V, and each channel has an input resistance of 1 MΩ and 16-bit analog-to-digital acquisition resolution, resulting in a voltage resolution of about 0.3 mV. Therefore, the voltage signal induced by each licking event did not need further amplification; it was directly acquired, low-pass filtered at 2 kHz, and digitized at 5 kHz using pClamp9 software (Molecular Devices, Sunnyvale, CA). Licking activity from up to 10 mice (each mouse was placed in a different cage) was obtained simultaneously by acquiring the voltage signals induced by the licking contacts on 10 separate channels of the analog/digital converter.
Cytokine and chemokine analysis
Immediately after behavior was completed hippocampi were dissected from saline (n = 10) and thioTEPA-treated mice (n = 8); the samples were homogenized individually in 200 μl PBS (Roche, Switzerland) containing Complete Protease Inhibitor (Roche) using a Kontes cordless pestle at 4°C. Homogenized samples were centrifuged at 500 g at 4°C for 10 minutes. Supernatants were transferred to new Eppendorf tubes on ice and centrifuged at 15,000 g at 4°C for 5 minutes. Supernatants were collected and shipped to Quansys Biosciences (Logan, UT) for analysis with Q-Plex Array kits for mouse cytokines: IL-1α, IL-1β, IL-2, IL-3, IL-4, IL-5, IL-10, IL-12p70, MCP-1, TNF-α; GMCSF; and RANTES. All cytokine data are expressed as pg/mg protein.
Golgi staining and tissue preparation
Immediately after sacrifice, half-brains (n = 6) were subjected to Golgi-Cox staining. Samples were immersed in mercuric chloride solution for impregnation for 2 weeks. Next, samples were immersed in post-impregnation buffer for 2 days. Half-brains were sectioned at 150 μm in 1X PBS with a microtome, and samples were placed into wells and washed with 0.01M PBS buffer (pH 7.4) with Triton X-100 (0.3%) (PBS-T). Samples were then stained with ammonium hydroxide solution and immersed in a post-staining buffer (superGolgi Kit; Bioenno Tech, LLC). Sections were washed in PBS-T, mounted on 1% gelatin-coated slides, and allowed to dry. The sections were then dehydrated with ethanol solutions, cleaned in xylenes, and coverslipped with Permount™ mounting medium (Thermo Fisher Scientific).
Quantification of dendrite morphology
The following were assayed or performed with the Neuroexplorer component of the Neurolucida program: Sholl analysis, total dendritic length, number of branch points, and dendritic-complexity index (DCI). First, we performed the Sholl analysis, which is used to assess the amount and distribution of the arbor at increasing distances from the cell body (28). For our experiments, we set the distance between each radius to 20 μm. The length of the dendritic branch within each progressively larger circle is counted from the soma, and this value reflects the amount and distribution of dendritic material. Next, we performed branch-point analysis; a branch point is a bifurcation of the dendrite into two sub-branches, and branch-point analysis quantifies the number of bifurcations and the order of the points (29). Lower branch-point orders represent proximal regions of the tree, whereas larger orders characterize distal regions. The complexity of the dendritic tree is an important phenotypic component of the branching analysis, and we used branch-point analysis to determine the complexity of the dendritic arborization. We determined DCI with the following equation, DCI = ∑ (branch tip orders + # branch tips) x (total dendritic length/total number of primary dendrites). In the Cornu Ammonis 1 (CA1), we analyzed apical and basal dendrites separately.
Analysis of interlick intervals
Licking events were detected with the Mini Analysis program (Synaptosoft Inc, Decatur, GA). Consecutive epochs of data (e.g., 100 ms) were searched for at peak voltage, and the average baseline voltage was calculated for an interval (e.g., 45-50 ms) before the peak. The event amplitude was calculated by subtracting the average baseline voltage from the peak voltage, and the event was rejected if the amplitude did not exceed a given threshold (e.g., 50 mV). The parameters characterizing the events were then imported into OriginLab 7.0 (Microcal Software Inc., Northampton, MA) for further analysis. The interlick intervals were calculated as the time difference between the onset times of occurrence of consecutive events. The Mini Analysis software does not generate the event onset times automatically. Therefore, the onset time of each event was calculated as the time of peak minus the rise time.
Typically, mice lick in bursts, with the number of licks per burst and the pauses between bursts being highly variable. When constructing a histogram of interlick intervals (ILIs), we were interested in analyzing relatively short ILIs, so we ignored all ILIs longer than 1000 ms. We also ignored ILIs shorter than 60 ms (which resulted when the mouse touched the sipper tube with the paw or face without licking; these intervals constituted less than 1% of the total intervals). We defined (N) as the total number of ILIs (i.e., total number of licks minus 1) collected during each 90-minute session.
Using Origin software, we calculated the statistical parameters for the ILIs for each mouse. We wrote an algorithm using the “Labtalk” scripting language in OriginLab software to automate the analysis and calculate all of the statistical parameters. These parameters included the mean, median, standard deviation (SD), and coefficient of variation (CV = SD/mean).
We constructed histograms of the ILIs using 90 minutes of recordings. The histograms were binned at 1 ms and smoothed by adjacent averaging of 10 points (i.e., each point was replaced by the average of itself, 10 points before, and 10 points after) to easily detect the peak of the distribution, which enabled us to find the mode (the ILI that occurs with the highest probability). To compare the ILI distributions in different mice and in different treatment conditions, the histograms were normalized to the number of ILIs collected during each recording session. Because of this normalization, the integral of each histogram (i.e., the area under the curve) was always equal to one, and a larger peak at the mode indicates a narrower distribution.
We used the skewness coefficient to determine how much the histograms deviated from a normal Gaussian distribution and to quantify the degree of their asymmetry around the mean. Positive skewness indicates a distribution with an asymmetric tail extending toward more positive values. In OriginLab software, skewness is computed as: , where. n is the number of values and SD is the standard deviation.
We also designed an algorithm to calculate a parameter called “count asymmetry,” which is the ratio (N2/N1) of the number of ILIs that were longer than the mode (N2) over those that were shorter than the mode (N1). Our algorithm separated the ILIs within the selected range of interest (N3 = number of total intervals that were > 60 ms and ≤ 1000 ms) into 2 groups: those shorter than the mode (N1) and those longer than the mode (N2). This parameter would be 1 if the distribution was symmetric, such as in a Gaussian distribution, and would be higher or lower than 1 depending on the skewness of the distribution. Two separate standard deviations (SD1 and SD2) were also calculated for intervals > 60 ms and ≤ mode and intervals > mode and ≤ 1000 ms. OriginLab software was used for statistical analysis. Data were compared between the 2 groups using independent t-test comparisons.
Data analysis
Data were expressed as means +/− the standard error of the mean (SEM). We conducted all statistical analyses with Prism 6.0 software (GraphPad), and P < 0.05 was considered significant. For measures of dendritic intersections, a paired t-test was conducted for the effects of TH (between-subjects variable) and distance from the cell soma (Sholl radius, repeated-measures variable); Fisher’s least significant difference (LSD) post-hoc tests followed, when appropriate. For Y-maze, we conducted Grubb’s outlier test (Alpha = 0.1000). Visible- and hidden-platform water-maze learning curves were analyzed by two-way repeated-measures ANOVA. We used Holm’s correction to control for multiple comparisons, and separate analyses were conducted for the visible- and hidden-platform learning curves. For analysis of performance in the MWM probe trials, we used one-way ANOVAs with Holm’s post-hoc test, when appropriate.
Results
Spatial memory and exploratory activity assessment
Y-maze
Figure 1 shows the amount of time that saline- or thioTEPA-treated animals spent in each arm of the Y-maze. Saline-treated mice spent significantly more time exploring the novel arm compared to the familiar or start arms (F (2,26) = 16.10; P < 0.0001) (Fig 1). However, thioTEPA-treated mice did not spend significantly more time in the novel arm compared to the start and familiar arms (F (2, 21) = 3.08; P = 0.067) (Fig 1).
Figure 1: TH-treatment significantly decreased the amount of time mice spent in the novel arm of the Y-maze.
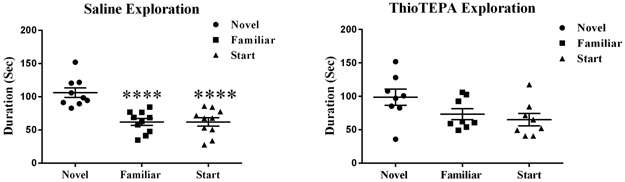
Saline-treated mice spent significantly more time exploring the novel arm compared to the start or familiar arms. ThioTEPA-treated mice spent their time randomly exploring the familiar, start, and novel arms. Each bar represents the mean of 8–10 mice; error bars are the SEM. ****P < 0.0001
Morris water maze
Distance Moved
Following Y-maze testing, Morris water-maze (MWM) test was conducted to compare learning and spatial-memory retention in saline- and thioTEPA-treated mice. To determine if treatment affected the ability to swim or learn the water maze task, mice were first trained to locate a clearly marked platform (visible platform, Days 1 and 2). Mice were subsequently trained to locate the platform when it is hidden beneath the surface of the opaque water (Days 3-5). Swim velocity can influence latency to the target during training sessions. The repeated-measures ANOVA revealed there was no significant treatment-by-day interaction for velocity (F (4,64) = 1.198, P = 0.32). During the visible platform training, there was no significant statistical evidence that TH-treatment (F (1, 16) = 2.78, P = 0.60) distance moved was used as a performance measure. Hidden platform training (acquisition) requires the mice to learn the location of the hidden platform based on extra-maze spatial cues. There were no significant treatment-by-day interaction (F (4, 64) = 1.29, P = 0.28) for the hidden platform sessions.
Probe Trials
To measure spatial memory retention, probe trials (platform removed) are conducted 1 hr after the last trial on each day of hidden platform training (i.e. 3 separate probe trials). For the probe trials, mice are placed into the water in the quadrant opposite from the target quadrant. The time spent in the target quadrant, i.e. where the platform was previously located during hidden platform training, is compared to the time spent in the 3 non-target quadrants. Probe trials were conducted on days 3 through 5 to assess the spatial-memory retention of mice treated with TH versus saline (Figs 2a-2f). Saline-treated animals showed spatial memory retention in the probe trial and searched significantly longer in the target quadrant than in any other quadrant day 3 (F (3, 32) = 5.80; P < 0.01; Fig 2a), day 4 (F (3, 32) = 6.34; P < 0.01; Fig 2b) and day 5 (F (3, 28) = 3.46; P < 0.05; Fig 2c). However, a significant memory impairment was observed in the TH-treated animals who did not demonstrate a preference for any of the quadrants on day 3 (F (3, 28) = 1.28; P = 0.30; Fig 2d), day 4 (F (3, 28) = 1.26; P = 0.31; Fig 2e), or day 5 (F (3, 28) = 0.53; P = 0.67; Fig 2f).
Figure 2: Spatial memory retention during probe trials on days 3–5 of Morris water-maze testing.

(a, b, and c) Saline probe trials; saline-treated animals spent significantly more time in the target quadrant than other quadrants. (d, e, and f) ThioTEPA-treated mice spent the same amount of time in each of the quadrants in probe trials. Each bar represents the mean of 8–10 mice; error bars are the SEM. * P < 0.05; ** P < 0.01
Effects of thioTEPA treatment on motor control
To determine the effects of TH treatment on motor control, mice were divided into 2 groups: 8 mice were treated with TH, and 10 mice were treated with saline (control). When the mice were weighed before testing, there was no significant difference (P = 0.47, independent t-test) in the weights of TH-treated mice (25.4 ± 0.7 , n = 8) and controls (26.1 ± 0.6 , n = 10). Moreover, there was no significant difference (P = 0.10, independent t-test) between the weight gained after the 90-minute licking session for the TH-treated mice (0.8 ± 0.1 , n = 8) and control mice (0.5 ± 0.1 , n = 10). These results indicate that TH treatment did not significantly affect the weight of the mice or their fluid consumption.
We studied the variation in interlick intervals (ILIs) between the 2 groups by analyzing the ILI distribution histogram (Fig 7), a conventional method that is widely used (31, 33-35). To determine whether the ILI distributions of each group differed from each other, we calculated several statistical parameters that characterize the distribution of ILIs (. When the mean licking frequency was calculated over the 90-minute recording sessions (Fig 8a & b), it was found that mice in both groups produced an almost identical number of licks (i.e., the amount of fluid consumed was not different between the 2 groups). We then generated statistical parameters (Fig 9a), using ILIs > 60 ms and ≤ 1000 ms, which constitute between 79% and 85% of the total number of ILIs obtained in each recording session (Fig 9b). The mean and mode of the ILI in the TH group were significantly larger than those of the control group. (Fig 9c-i)Because the thioTEPA-treated animals failed to produce licks at regular intervals, the mean peak of distribution was smaller in amplitude, and this resulted in a larger variability in ILI (i.e., larger SD, increased skewness coefficient, and larger N2/N1 ratio). Taken together, our investigation of the microstructure of licking indicates that there were significant differences in the ILI distribution histograms between thioTEPA-treated and control mice. Specifically, the ILIs in thioTEPA-treated mice were much more variable because these animals failed to extend their tongues at a regular interval.
Figure 7: Frequency of licking during 90-min recording sessions that were preceded by 24 h of food and water deprivation.

(A) Eight and 10 traces are shown from ThioTEPA and control mice, respectively. The frequency histograms were binned at 1 s. ThioTEPA mice showed a non-significant increase in licking at the beginning of the recording session. (B) Averaged frequency histograms from each group of mice. Top panel: Group data (mean + SEM) frequencies were calculated after binning at 1 s and smoothing with 181 s of adjacent averaging. Lower panel: Group data (mean ± SEM) were calculated using long-duration bins (1 min) and adjacent averaging of 3 min. Each graph represents the mean of 8–10 mice.
Figure 8: ILI distribution histograms.

(A) The histograms were generated for ILIs between 60 ms and 1000 ms and binned at 1 ms (only the range of 60–300 ms is shown). Then, they were smoothed by adjacent averaging of 21 ms (i.e. each bin is the average of itself, 10 bins before it, and 10 bins after) and normalized to the total number of ILIs (between 60 ms and 1000 ms). Each panel represents histograms obtained from one group of mice, as indicated. (B) Superimposed average histograms of ILIs for comparing the 2 groups. (C) Representative licking traces from a ThioTEPA-treated mouse and saline mouse. Note that the ThioTEPA-treated mouse has more irregular ILIs with missing licks. Each graph represents the mean of 8–10 mice.
Figure 9: Differences in the ILI distribution histograms between mice treated with ThioTEPA or saline.

Data (means ± SEM) were collected during 90-min recording sessions and averaged from 8 mice (ThioTEPA group) and 10 mice (control group). P values indicate significant differences between treated and control groups (independent t-test). (a) Mean licking frequency over the entire recording session indicates that TH-treated mice and mice did not a significant difference in the number of licks produced during the 90-min session. (b) A schematic representation of the statistical parameters that were quantified in panels (c-i) (see Materials and methods for additional details). (c-i) Group data of the different statistical parameters that characterize the ILI distribution histograms. Each graph represents the mean of 8–10 mice.
Changes in dendritic spine density and morphology
Dentate Gyrus Granule Neurons.
The quantitative analysis showed that overall spine density in the DG after thioTEPA treatment was not significantly changed (t = 0.87, P = 0.39). Next, we analyzed the density of different types of dendritic spines, finding that the density of neither thin spines (t=0.46, P = 0.66) nor stubby spines (t = 0.91, P = 0.37) was significantly modulated. However, in the DG, we observed a decrease in the number of mushroom spines in thioTEPA-treated animals compared to controls (t = 2.09, P = 0.06), but it did not reach significance.
CA1 Pyramidal Neurons.
Similar to what was observed in the DG spine analysis, thioTEPA-treatment did not significantly modulate overall density in the CA1 apical spines (apical: t = 0.81, P = 0.43). In addition, when we analyzed the density by spine type, we did not find significant changes in thin (t = 2.25, P = 0.07), stubby (t = 0.13, P = 0.89) or mushroom (t = 1.77, P = 0.13) spine types. In CA1 basal there were also no changes in spine density when thioTEPA-treated animals were compared to controls (t = 1.60, P = 0.17). There no significant changes in mushroom spines (t = 0.57, P = 0.96). However there were decreases that didn’t reach significance in the stubby (t=2.06, P = 0.09) and thin spines (t=2.25, P = 0.07).
CA3 Pyramidal Neurons.
In the CA3 apical pyramidal dendrites, there were no significant changes in the overall density of spine (apical: t = 0.54, P = 0.61). When we analyzed spine type we also found no significant changes in thin (t = 0.25, P = 0.82), stubby (t = 0.49, P = 0.67) or mushroom spines (t = 1.09, P = 0.28). In the CA3 basal, there was a decrease in spine density however, it did not reach significance (t = 2.35, P = 0.07). However similar to the apical spines, there were no significant changes in thin (t = 1.08, P = 0.33), stubby (t = 1.18, P = 0.29 or mushroom spines (t = 0.45, P = 0.67).
Changes in dendritic morphology in granular neurons of the dentate gyrus
Dentate Gyrus Granule Neurons.
To further investigate the effects of thioTEPA-treatment on dendrite morphology we performed a segmental Sholl analysis to examine the changes in dendritic length as a function of radial distance from the cell soma. In the DG, there was a significant interaction between treatment and segmental dendritic length after thioTEPA-treatment (F (25,78) = 2.88 p<0.001), indicating that the effect of thioTEPA-treatment is associated with a different distribution of dendritic branches over the entire tree. The ANOVA also detected a significant main effect of treatment (F (1,18) = 30.18; p <0.0001) and distance (F (25,450) = 174.1; p <0.0001). Post-hoc analysis revealed that thioTEPA-treatment decreased dendritic arborization compared to the sham controls. We observed significant decreases in the dendritic length from 50-150 μm from the soma (Fisher’s LSD, P < 0.05) (Fig 3). In addition, we observed significant decreases in the number of branch points (t = 6.29, P < 0.001), dendritic length (t = 4.77, P < 0.01), and dendritic complexity (t = 4.07, P < 0.01) in TH-treated animals compared to saline-treated. These data indicate that thioTEPA decreased dendritic complexity in the DG region of the hippocampus.
Figure 3: TH- treatment significantly decreased dendritic complexity throughout the DG region of the hippocampus.

a) Dendritic length measured by Sholl analysis revealed a decrease in arborization particularly evident at distances between 50-150 μm from the soma b) TH-treatment significantly decreased complexity. Average ± SEM (n = 5); * P < 0.05; ** P < 0.01; ‡ P < 0.001.
CA1 Pyramidal Neurons.
We performed a similar analysis on the apical and basal region of the CA1 pyramidal neurons. There was a significant interaction between treatment and segmental dendritic length in the CA1 apical area (F (25,200) = 7.011: P < 0.0001). A two-way ANOVA also detected a significant main effect of treatment (F (1,8) = 8.65 P < 0.0001) and distance (F (25,200) = 41.87; P < 0.0001). Post-hoc analysis revealed that thioTEPA-treatment decreased dendritic arborization compared to the sham controls. We observed significant decreases in dendritic length in the apical region of CA1 50-130 μm away from the soma (Fisher’s LSD, P < 0.05).
In the basal dendrites of CA1 pyramidal cells, there was a significant interaction between treatment and sham segmental dendritic length (F (25,104) =11.46; P < 0.0001). The ANOVA also detected a main effect of treatment (F (1,104) = 250.2; P < 0.001) and distance (F (25,104) = 67.62; P < 0.0001). Post-hoc analysis revealed that irradiation decreased dendritic arborization at 30 - 120 μm from the soma (Fisher’s LSD, P < 0.0001) as well as at 130-140 μm (Fisher’s LSD, P < 0.05) compared to the sham controls (Fig 4b).
Figure 4: Sholl analyses of CA1 pyramidal neurons.

(a) Dendritic length measured by Sholl analysis in CA1 apical revealed a decrease in arborization at 40–130 μm from the soma after exposure to ThioTEPA. (b) ThioTEPA exposure greatly decreased overall dendrite complexity. (c) In the CA1 basal, mice exposed to ThioTEPA showed a decrease in arborization at 30–130 μm from the soma. (d) ThioTEPA exposure greatly decreased overall dendrite complexity in CA1 basal area. Average ± SEM (n = 5); * P < 0.05; **** P < 0.0001; ‡ P < 0.001.
In addition, we observed significant decreases in branch points in the CA1 region of the hippocampus in thioTEPA-treated animals (apical: t = 9.04, P < 0.001; basal: t = 7.19, P < 0.01), and we observed significant decreases in the length of dendrites (apical: t = 6.08, P < 0.01; basal: t = 5.95, P < 0.01). Dendritic complexity was also significantly compromised by thioTEPA treatment (apical: t = 8.22, P < 0.01; basal: t = 6.04, P < 0.01) (Fig 4).
CA3 Pyramidal Neurons.
There was a significant interaction between treatment and segmental dendritic length in the CA3 apical areal (F (25, 78) = 11.80, P < 0.001). Two-way ANOVA revealed a significant main effect of thioTEPA-treatment (F (1,78) = 249.9, P < 0.001) and an effect of length (F (1,78) = 95.69, P < 0.001). Further analysis with Fisher’s LSD showed thioTEPA treatment decreased dendritic arborization 60-160 μm (Fisher’s LSD, P < 0.001; Fig 5a) and 170 μm (Fisher’s LSD, P < 0.05; Fig 5a) away from the soma when compared to saline treated controls.
Figure 5: Analysis of dendritic complexity in CA3 apical region of thioTEPA-treated mice versus saline-treated animals.


(a) Dendritic length measured by Sholl analysis in CA3 apical revealed a decrease in arborization at 60–160 μm from the soma that was particularly evident after exposure to ThioTEPA. (b) ThioTEPA exposure greatly decreased overall dendritic complexity. (c) In the CA3 basal, mice exposed to ThioTEPA showed a decrease in arborization at 60–170 μm from the soma. (d) ThioTEPA exposure greatly decreased overall dendrite complexity in CA3 basal area. (e-f) Representative tracings of CA3 neurons superimposed over concentric rings (10 μM) used for Sholl analyseAverage ± SEM (n = 5); * P < 0.05; ‡ P < 0.001.
In the basal dendrites of CA3 pyramidal cells, there was a significant interaction between treatment and sham segmental dendritic length (F (25,156) =10.43; P < 0.0001). The ANOVA also detected a main effect of treatment (F (1,6) = 23.33; P < 0.01) and distance (F (25,156) = 72.27; P < 0.0001). Post-hoc analysis revealed that chemotherapy decreased dendritic arborization at 70 - 150 μm from the soma (Fisher’s LSD, P < 0.0001) as well as at 160-190 μm (Fisher’s LSD, P < 0.05) compared to the sham controls (Fig 5c).
Further, we observed significant changes in dendritic complexity in the CA3 region of the hippocampus. Branch points were significantly decreased in thioTEPA-treated animals when compared to saline controls (apical: t = 13.22, P < 0.001; basal: t = 21.63, P < 0.001). Dendrite length was compromised (apical: t = 5.09, P < 0.01; basal: t = 5.52, P < 0.01), and the dendritic complexity was significantly reduced after TH treatment (apical: t = 3.68, P < 0.05; basal: t = 4.28, P < 0.05).
Changes in cytokine production
Hippocampal homogenates from thioTEPA-treated (n=10) and saline-treated (n=8) mice were tested to determine levels of 16 cytokines and chemokines using the Q-Plex™ Mouse Cytokine Screen Cytokine levels decreased in thioTEPA-treated animals compared to controls: IL-2 (t = 2.28, P < 0.05), IL-3 (t = 2.91, P < 0.05), IL-5 (t = 2.80, P < 0.05), and GM-CSF (t = 2.62, P < 0.05) (Fig 6).
Figure 6: ThioTEPA treatment significantly decreased the amount of IL-2, IL-3, IL5, and GM-CSF in the hippocampus.

Each data point represents the mean of 8–10 mice; error bars are the SEM; P < 0.05.
Discussion
In the current study, we examined the effects of thioTEPA treatment on cognition, hippocampal dendritic morphology, and cytokine production. From behavioral testing, we observed deficits in short-term memory retention in thioTEPA-treated mice versus controls. thioTEPA-treated mice did not spend more time in any one arm of the Y-maze, indicating that they did not recognize the novel arm as being a new stimulus. In the MWM, we observed a significant deficit in spatial memory retention in thioTEPA-treated mice versus saline-treated controls. Saline-treated mice spent much of the trial in the target quadrant during the probe trials, while the thioTEPA-treated mice did not. These results indicate that the animals did not remember which quadrant housed the platform during hidden platform trials. In the licking behavior test, we observed a decreased interlick interval in chemotherapy animals compared to saline-treated controls. Finally, we observed a decrease in dendritic complexity and morphology and a decrease in cytokine production in the hippocampi of chemotherapy-treated mice versus controls.
Cognitive decline after chemotherapy has been demonstrated in both human patients and rodents. Our findings of behavioral deficits are aligned with previous studies that examined cognitive decline after thioTEPA treatment in rodents. Mondie et al. observed significant decreases in memory retention during a novel object recognition task, and a decrease in hippocampal neurogenesis was also observed (20). In another study, thioTEPA-treated mice were shown to experience anhedonia, depression-like behaviors, and cognitive decline after treatment (36).
Although rodent fluid-licking has no resemblance to human drinking, it has been studied extensively to understand how rhythmic movements are coordinated and to reveal the mechanism and neuronal pathways that control ingestive behavior. Fluid licking in rodents is a rhythmic behavior that is controlled by a network of brainstem neurons forming a central pattern generator (50) (reviewed by Travers et al. 1997) located in the lateral medullary reticular formation (51). This central pattern generator is controlled by olivocerebellar neuronal firing that is time-locked to licking events (31, 52, 53). The cerebellum does not control or cause licking; it only modulates or fine-tunes the licking activity (54). In mice, the firing of Purkinje cells is correlated with licking, and these cells are scattered throughout the cerebellum; a loss of cerebellar function, due to cerebellectomy or pharmacological inactivation, significantly increases the mean interlick intervals, leading to a slower licking rhythm (31). The licking behavior of rodents is synchronized with the much slower breathing rhythm (2-3 Hz) (55) and is periodically interrupted by swallowing (56, 57). Because the cerebellum is essential for coordinating the licking pattern, the functional capacity of the cerebellum in pathological conditions can be assessed by testing whether there is a dysfunctional licking pattern. Unlike other behavioral tests, no training is required because licking is an innate behavior that does not require complex neuronal circuits involved in learning and memory. We therefore hypothesize that a change in the licking pattern after thioTEPA treatment reflects alterations in the cerebellar circuits that provide modulatory inputs to the brainstem central-pattern generator of licking. Our findings indicate that the ILIs in thioTEPA-treated mice were much more variable due to a failure to extend the tongue at regular intervals. This could indicate dysfunction at the level of the central pattern generator in the brainstem and/or impairment in the role of the cerebellum in fine-tuning and coordinating motor activity.
However, cognitive decline after chemotherapy is not specific to thioTEPA. Many different chemotherapy drugs are associated with cognitive decline (37)—doxorubicin, cyclophosphamide, cisplatin, and 5-fluorouracil (5-Fu) are all associated with cognitive dysfunction (38-40). Previously, we showed that 5-Fu decreases dendritic arborization in the mouse hippocampus (41). Dendritic complexity can be indicative of cognitive function—decreased complexity is associated with cognitive decline and increased complexity is associated with increased function (42, 43). Although many studies have demonstrated cognitive decline after chemotherapy, mechanisms and ameliorative strategies remain elusive.
In the current study, we measured dendritic morphology, specifically assessing differences in branch points after thioTEPA treatment. We found that dendrites from animals that received chemotherapy had significantly fewer branch points than controls. Fewer branch points suggest that there is decreased dendritic complexity; therefore, fewer synaptic connections are possible producing cognitive deficits. These findings are compatible with previous studies assessing cognitive decline after chemotherapy treatment. One such study tested the effects of 5-Fu on cognition in an aged-mouse model. In this study, mice were administered intraperitoneal injections of 5-Fu, brains were collected, and Golgi staining was performed. Analogous to our results with thioTEPA, 5-Fu significantly decreased dendritic branching and complexity (41). Cisplatin, another chemotherapy drug, also contributes to cognitive decline. In a study by Andres et al., Sprague-Dawley rats were given low doses of cisplatin, and hippocampal dendritic morphology was assessed. They found a significant decrease in the complexity of dendrites in cisplatin-treated mice, compared to controls (1). Likewise, our Sholl analyses indicate significant decreases in dendritic arborization, akin to previous studies that assessed cognitive decline.
Mechanisms of cognitive decline are currently being investigated. Candidate mechanisms include: neuroinflammation, oxidative stress and loss of blood brain barrier integrity (Winocur G, Neurobiological mechanisms of chemotherapy-induced cognitive impairment in a transgenic model of breast cancer, Neuroscience, 2018). To investigate potential mechanisms of cognitive decline, we evaluated cytokine production in the hippocampus after thioTEPA treatment. We found significantly lower levels of IL-2, IL-3, IL-5, and GM-CSF in thioTEPA-treated animals compared to controls. However, previous studies generally observed an increase in cytokines during cognitive decline (38, 41, 44, 45). Because our data indicate a decrease in proinflammatory cytokines in thioTEPA-treated mice, cognition should have been spared. Our reasoning for this phenomenon is that the initial damage was done when chemotherapy was administered, and cytokine levels returned to normal in response to a negative-feedback mechanism. GM-CSF, for example, is immunomodulatory—it can suppress or stimulate the immune response. Here, the animals were sacrificed a month after chemotherapy was administered, and this time period could have been sufficient to recruit myeloid suppressor cells and downregulate the immune response (46-48). This reveals one caveat of our study. Decreased cytokines would indicate decreased inflammation, which would allow for increased neurogenesis and brain recovery. An analysis of cytokine expression at different time points, closer to the time of thioTEPA injection, could determine if there is an initial increase in proinflammatory cytokines, followed by a decrease in cytokine production. In addition, it would be useful to assess other mechanisms of cognitive dysfunction that could lead to deficits in learning and memory after thioTEPA treatment. Mitochondrial dysfunction, free-radical generation and oxidative stress, and excitotoxicity are all implicated in cognitive impairment after CNS injury (49). Further, mechanisms of cognitive decline following systemic chemotherapy include: oxidative stress, microglia activation, apoptosis and inhibition of neuronal proliferation. (Kovalchuk A, Chemobrain: from discerning mechanisms to lifting the brain fog-an aging connection, Cell Cycle, 2017) (Vichaya EG, Mechanisms of chemotherapy-induced behavioral toxicities, Front Neuroscience, 2015) Thus, it will be useful to evaluate other mechanisms of decline in order to characterize the mechanism of thioTEPA-induced cognitive impairment.
Conclusions
We used adult male mice to measure the effects of thioTEPA on learning and memory. From our studies, we observed decreased memory retention in behavioral paradigms for thioTEPA-treated animals compared to controls. We also found alterations in dendritic morphology in thioTEPA-treated mice. Taken together, these data indicate that thioTEPA treatment induces cognitive dysfunction, and future studies should address the mechanisms underlying such cognitive decline. Measuring oxidative stress and other proposed mechanisms of cognitive decline will help us understand the manner in which this decline occurs and how it can be prevented. Because patients are living longer after cancer treatment, quality of life has become increasingly important. Thus, identifying ameliorative strategies that help prevent cognitive dysfunction will add significantly to the well-being of patients in remission.
TABLE 1.
Effects of ThioTEPA on Dendritic Complexity in Hippocampal DG
| Cell types and measurements | Salinea | ThioTEPAa | P value |
|---|---|---|---|
| Total dendritic length (μm) | 1115 ± 71.00 | 681.6 ± 39.83 | P < 0.01 |
| Total branch points (no.) | 10.04 ± 0.61 | 5.82 ± 0.22 | P < 0.001 |
| Dendritic complexity | 42468 ± 5500 | 17575 ± 1211 | P < 0.01 |
Mean ± SEM.
Values in boldface are significant.
TABLE 2.
Morphological Analysis of Apical and Basal Dendrites in CA1
| Cell types and measurements | Salinea | ThioTEPAa | P value |
|---|---|---|---|
| CA1 apical | |||
| Total dendritic length (μm) | 1014 ± 65.42 | 500.4 ± 32.61 | P < 0.01b |
| Total branch points (no.) | 13.16 ± 0.54 | 4.89 ± 0.43 | P < 0.001 |
| Dendritic complexity | 78201 ± 6509 | 13304 ± 2978 | P < 0.01 |
| CA1 basal | |||
| Total dendritic length (μm) | 1329 ± 132.2 | 496.5 ± 39.15 | P < 0.01 |
| Total branch points (no.) | 14.72 ± 1.13 | 3.28 ± 0.76 | P < 0.01 |
| Dendritic complexity | 30076 ± 4437 | 2467 ± 624.6 | P < 0.01 |
Mean ± SEM.
Values in boldface are significant.
TABLE 3.
Morphological Analysis of Apical and Basal Dendrites in CA3
| Cell types and measurements | Salinea | ThioTEPAa | P value |
|---|---|---|---|
| CA3 apical | |||
| Total dendritic length (μm) | 1421 ± 142.0 | 667.4 ± 58.05 | P < 0.05b |
| Total branch points (no.) | 13.10 ± 0.70 | 5.20 ± 0.60 | P < 0.001 |
| Dendritic complexity | 61172 ± 10834 | 13482 ± 2940 | P < 0.05 |
| CA3 basal | |||
| Total dendritic length (μm) | 1522 ± 111.6 | 755.5 ± 39.75 | P < 0.05 |
| Total branch points (no.) | 15.40 ± 0.077 | 5.69 ± 0.85 | P < 0.001 |
| Dendritic complexity | 54597 ± 10889 | 8273 ± 1927 | P < 0.05 |
Mean ± SEM.
Values in boldface are significant.
Acknowledgements
This work was supported by a Pilot Grant under NIH P20 GM109005 (ARA) and by core facilities of the Center for Translational Neuroscience IDeA program award P30 GM110702. The funders had no role in study design, data collection and analysis, decision to publish, or preparation of the manuscript. This manuscript was edited by the Science Communication Group at the University of Arkansas for Medical Sciences.
References
- 1.Andres AL, Gong X, Di K, Bota DA. Low-doses of cisplatin injure hippocampal synapses: a mechanism for 'chemo' brain? Experimental neurology. 2014;255:137–44. Epub 2014/03/07. [DOI] [PMC free article] [PubMed] [Google Scholar]
- 2.Weiss B Chemobrain: a translational challenge for neurotoxicology. Neurotoxicology. 2008;29(5):891–8. Epub 2008/05/16. [DOI] [PMC free article] [PubMed] [Google Scholar]
- 3.Simo M, Rifa-Ros X, Rodriguez-Fornells A, Bruna J. Chemobrain: a systematic review of structural and functional neuroimaging studies. Neuroscience and biobehavioral reviews. 2013;37(8):1311–21. Epub 2013/05/11. [DOI] [PubMed] [Google Scholar]
- 4.Moore HC. An overview of chemotherapy-related cognitive dysfunction, or 'chemobrain'. Oncology. 2014;28(9):797–804. Epub 2014/09/17. [PubMed] [Google Scholar]
- 5.Argyriou AA, Assimakopoulos K, Iconomou G, Giannakopoulou F, Kalofonos HP. Either called "chemobrain" or "chemofog," the long-term chemotherapy-induced cognitive decline in cancer survivors is real. Journal of pain and symptom management. 2011;41(1):126–39. Epub 2010/09/14. [DOI] [PubMed] [Google Scholar]
- 6.Strong JM, Collins JM, Lester C, Poplack DG. Pharmacokinetics of intraventricular and intravenous N,N',N"-triethylenethiophosphoramide (thiotepa) in rhesus monkeys and humans. Cancer research. 1986;46(12 Pt 1):6101–4. Epub 1986/12/01. [PubMed] [Google Scholar]
- 7.Sioka C, Kyritsis AP. Central and peripheral nervous system toxicity of common chemotherapeutic agents. Cancer chemotherapy and pharmacology. 2009;63(5):761–7. Epub 2008/11/27. [DOI] [PubMed] [Google Scholar]
- 8.Maanen MJ, Smeets CJ, Beijnen JH. Chemistry, pharmacology and pharmacokinetics of N,N",N"-triethylenethiophosphoramide (ThioTEPA). Cancer treatment reviews. 2000;26(4):257–68. Epub 2000/07/29. [DOI] [PubMed] [Google Scholar]
- 9.Ferreri AJ, Cwynarski K, Pulczynski E, Ponzoni M, Deckert M, Politi LS, et al. Chemoimmunotherapy with methotrexate, cytarabine, thiotepa, and rituximab (MATRix regimen) in patients with primary CNS lymphoma: results of the first randomisation of the International Extranodal Lymphoma Study Group-32 (IELSG32) phase 2 trial. The Lancet Haematology. 2016;3(5):e217–e27. [DOI] [PubMed] [Google Scholar]
- 10.Massimino M, Gandola L, Luksch R, Spreafico F, Riva D, Solero C, et al. Sequential chemotherapy, high-dose thiotepa, circulating progenitor cell rescue, and radiotherapy for childhood high-grade glioma. Neuro-oncology. 2005;7(1):41–8. [DOI] [PMC free article] [PubMed] [Google Scholar]
- 11.Osorio DS, Dunkel IJ, Cervone KA, Goyal RK, Steve Lo K, Finlay JL, et al. Tandem thiotepa with autologous hematopoietic cell rescue in patients with recurrent, refractory, or poor prognosis solid tumor malignancies. Pediatric blood & cancer. 2018;65(1). [DOI] [PMC free article] [PubMed] [Google Scholar]
- 12.Qualls D, Sullivan A, Li S, Brunner AM, Collier K, Hochberg E, et al. High-dose Thiotepa, Busulfan, Cyclophosphamide, and Autologous Stem Cell Transplantation as Upfront Consolidation for Systemic Non-Hodgkin Lymphoma With Synchronous Central Nervous System Involvement. Clinical Lymphoma Myeloma and Leukemia. 2017;17(12):884–8. [DOI] [PubMed] [Google Scholar]
- 13.Scordo M, Morjaria SM, Littmann ER, Bhatia A, Chung HH, Maloy M, et al. Distinctive Infectious Complications in Patients with Central Nervous System Lymphoma Undergoing Thiotepa, Busulfan, and Cyclophosphamide–Conditioned Autologous Stem Cell Transplantation. Biology of Blood and Marrow Transplantation. 2018. [DOI] [PMC free article] [PubMed] [Google Scholar]
- 14.Maritaz C, Lemare F, Laplanche A, Demirdjian S, Valteau-Couanet D, Dufour C. High-dose thiotepa-related neurotoxicity and the role of tramadol in children. BMC cancer. 2018;18(1):177. [DOI] [PMC free article] [PubMed] [Google Scholar]
- 15.O'Dwyer PJ, LaCreta F, Engstrom PF, Peter R, Tartaglia L, Cole D, et al. Phase I/pharmacokinetic reevaluation of thioTEPA. Cancer research. 1991;51(12):3171–6. Epub 1991/06/15. [PubMed] [Google Scholar]
- 16.Lee SH, Son MH, Sung KW, Choi YB, Lee NH, Yoo KH, et al. Toxicity of tandem high-dose chemotherapy and autologous stem cell transplantation using carboplatin-thiotepa-etoposide and cyclophosphamide-melphalan regimens for malignant brain tumors in children and young adults. Journal of neuro-oncology. 2014;120(3):507–13. [DOI] [PubMed] [Google Scholar]
- 17.Heideman RL, Packer RJ, Reaman GH, Allen JC, Lange B, Horowitz ME, et al. A phase II evaluation of thiotepa in pediatric central nervous system malignancies. Cancer. 1993;72(1):271–5. Epub 1993/07/01. [DOI] [PubMed] [Google Scholar]
- 18.Mignone RG, Weber ET. Potent inhibition of cell proliferation in the hippocampal dentate gyrus of mice by the chemotherapeutic drug thioTEPA. Brain research. 2006;1111(1):26–9. Epub 2006/08/02. [DOI] [PubMed] [Google Scholar]
- 19.Dietrich J Chemotherapy associated central nervous system damage. Advances in experimental medicine and biology. 2010;678:77–85. Epub 2010/08/27. [DOI] [PubMed] [Google Scholar]
- 20.Mondie CM, Vandergrift KA, Wilson CL, Gulinello ME, Weber ET. The chemotherapy agent, thioTEPA, yields long-term impairment of hippocampal cell proliferation and memory deficits but not depression-related behaviors in mice. Behavioural brain research. 2010;209(1):66–72. Epub 2010/01/26. [DOI] [PMC free article] [PubMed] [Google Scholar]
- 21.Tavosanis G Dendritic structural plasticity. Developmental neurobiology. 2012;72(1):73–86. Epub 2011/07/16. [DOI] [PubMed] [Google Scholar]
- 22.Jan YN, Jan LY. Branching out: mechanisms of dendritic arborization. Nature reviews Neuroscience. 2010;11(5):316–28. Epub 2010/04/21. [DOI] [PMC free article] [PubMed] [Google Scholar]
- 23.Scott EK, Luo L. How do dendrites take their shape? Nature neuroscience. 2001;4(4):359–65. Epub 2001/03/29. [DOI] [PubMed] [Google Scholar]
- 24.Yuste R, Bonhoeffer T. Morphological changes in dendritic spines associated with long-term synaptic plasticity. Annual review of neuroscience. 2001;24:1071–89. Epub 2001/08/25. [DOI] [PubMed] [Google Scholar]
- 25.Rzeski W, Pruskil S, Macke A, Felderhoff‐Mueser U, Reiher AK, Hoerster F, et al. Anticancer agents are potent neurotoxins in vitro and in vivo. Annals of neurology. 2004;56(3):351–60. [DOI] [PubMed] [Google Scholar]
- 26.Algarra SM, Henriquez I, Rebollo J, Artieda J. Severe polyneuropathy and motor loss after intrathecal thiotepa combination chemotherapy: description of two cases. Anti-cancer drugs. 1990;1(1):33–6. [DOI] [PubMed] [Google Scholar]
- 27.Wilson CL, Weber ET. Chemotherapy drug thioTEPA exacerbates stress-induced anhedonia and corticosteroid responses but not impairment of hippocampal cell proliferation in adult mice. Behavioural brain research. 2013;236(1):180–5. Epub 2012/09/18. [DOI] [PMC free article] [PubMed] [Google Scholar]
- 28.Sholl DA. Dendritic organization in the neurons of the visual and motor cortices of the cat. Journal of anatomy. 1953;87(4):387–406. Epub 1953/10/01. [PMC free article] [PubMed] [Google Scholar]
- 29.Morley BJ, Mervis RF. Dendritic spine alterations in the hippocampus and parietal cortex of alpha7 nicotinic acetylcholine receptor knockout mice. Neuroscience. 2013;233:54–63. Epub 2012/12/29. [DOI] [PMC free article] [PubMed] [Google Scholar]
- 30.Hayar A, Bryant JL, Boughter JD, Heck DH. A low-cost solution to measure mouse licking in an electrophysiological setup with a standard analog-to-digital converter. Journal of neuroscience methods. 2006;153(2):203–7. [DOI] [PMC free article] [PubMed] [Google Scholar]
- 31.Bryant JL, Boughter JD, Gong S, LeDoux MS, Heck DH. Cerebellar cortical output encodes temporal aspects of rhythmic licking movements and is necessary for normal licking frequency. European Journal of Neuroscience. 2010;32(1):41–52. [DOI] [PMC free article] [PubMed] [Google Scholar]
- 32.Lin XB, Pierce DR, Light KE, Hayar A. The fine temporal structure of the rat licking pattern: what causes the variabiliy in the interlick intervals and how is it affected by the drinking solution? Chemical senses. 2013;38(8):685–704. [DOI] [PMC free article] [PubMed] [Google Scholar]
- 33.Boughter JD Jr., , Baird JP, Bryant J, St John SJ, Heck D. C57BL/6J and DBA/2J mice vary in lick rate and ingestive microstructure. Genes, brain, and behavior. 2007;6(7):619–27. Epub 2007/01/11. [DOI] [PubMed] [Google Scholar]
- 34.HOUPT TA, FRANKMANN SP. Tongue twister: an integrated program for analyzing lickometer data. Physiology & behavior. 1996;60(5):1277–83. [DOI] [PubMed] [Google Scholar]
- 35.Boughter J, Baird JP, Bryant J, St John S, Heck D. C57BL/6J and DBA/2J mice vary in lick rate and ingestive microstructure. Genes, Brain and Behavior. 2007;6(7):619–27. [DOI] [PubMed] [Google Scholar]
- 36.Wilson CL, Weber ET. Chemotherapy drug thioTEPA exacerbates stress-induced anhedonia and corticosteroid responses but not impairment of hippocampal cell proliferation in adult mice. Behavioural brain research. 2013;236:180–5. [DOI] [PMC free article] [PubMed] [Google Scholar]
- 37.Moore H An overview of chemotherapy-related cognitive dysfunction, or ‘chemobrain’. Oncology. 2014;28(9):797–804. [PubMed] [Google Scholar]
- 38.Lyons L, ElBeltagy M, Bennett G, Wigmore P. Fluoxetine counteracts the cognitive and cellular effects of 5-fluorouracil in the rat hippocampus by a mechanism of prevention rather than recovery. PloS one. 2012;7(1):e30010. Epub 2012/01/25. [DOI] [PMC free article] [PubMed] [Google Scholar]
- 39.Kitamura Y, Hattori S, Yoneda S, Watanabe S, Kanemoto E, Sugimoto M, et al. Doxorubicin and cyclophosphamide treatment produces anxiety-like behavior and spatial cognition impairment in rats: possible involvement of hippocampal neurogenesis via brain-derived neurotrophic factor and cyclin D1 regulation. Behavioural brain research. 2015;292:184–93. [DOI] [PubMed] [Google Scholar]
- 40.Lomeli N, Di K, Czerniawski J, Guzowski JF, Bota DA. Cisplatin-induced mitochondrial dysfunction is associated with impaired cognitive function in rats. Free Radical Biology and Medicine. 2017;102:274–86. [DOI] [PMC free article] [PubMed] [Google Scholar]
- 41.Groves TR, Farris R, Anderson JE, Alexander TC, Kiffer F, Carter G, et al. 5-Fluorouracil chemotherapy upregulates cytokines and alters hippocampal dendritic complexity in aged mice. Behavioural brain research. 2017;316:215–24. [DOI] [PMC free article] [PubMed] [Google Scholar]
- 42.Dang V, Medina B, Das D, Moghadam S, Martin KJ, Lin B, et al. Formoterol, a long-acting β2 adrenergic agonist, improves cognitive function and promotes dendritic complexity in a mouse model of Down syndrome. Biological psychiatry. 2014;75(3):179–88. [DOI] [PubMed] [Google Scholar]
- 43.Dickstein DL, Brautigam H, Stockton SD, Schmeidler J, Hof PR. Changes in dendritic complexity and spine morphology in transgenic mice expressing human wild-type tau. Brain Structure and Function. 2010;214(2-3):161–79. [DOI] [PMC free article] [PubMed] [Google Scholar]
- 44.Wilson CJ, Finch CE, Cohen HJ. Cytokines and cognition--the case for a head-to-toe inflammatory paradigm. Journal of the American Geriatrics Society. 2002;50(12):2041–56. Epub 2002/12/11. [DOI] [PubMed] [Google Scholar]
- 45.Cheung YT, Ng T, Shwe M, Ho HK, Foo KM, Cham MT, et al. Association of proinflammatory cytokines and chemotherapy-associated cognitive impairment in breast cancer patients: a multi-centered, prospective, cohort study. Annals of oncology : official journal of the European Society for Medical Oncology / ESMO. 2015;26(7):1446–51. Epub 2015/04/30. [DOI] [PMC free article] [PubMed] [Google Scholar]
- 46.Serafini P, Carbley R, Noonan KA, Tan G, Bronte V, Borrello I. High-dose granulocyte-macrophage colony-stimulating factor-producing vaccines impair the immune response through the recruitment of myeloid suppressor cells. Cancer research. 2004;64(17):6337–43. Epub 2004/09/03. [DOI] [PubMed] [Google Scholar]
- 47.Parmiani G, Castelli C, Pilla L, Santinami M, Colombo MP, Rivoltini L. Opposite immune functions of GM-CSF administered as vaccine adjuvant in cancer patients. Annals of oncology : official journal of the European Society for Medical Oncology / ESMO. 2007;18(2):226–32. Epub 2006/11/23. [DOI] [PubMed] [Google Scholar]
- 48.Kuzhan O, Ozet A, Ulutin C, Komurcu S, Arpaci F, Ozturk B, et al. Survival benefit with GM-CSF use after high-dose chemotherapy in high-risk breast cancer. Tumori. 2007;93(6):550–6. Epub 2008/03/15. [DOI] [PubMed] [Google Scholar]
- 49.Walker KR, Tesco G. Molecular mechanisms of cognitive dysfunction following traumatic brain injury. Frontiers in aging neuroscience. 2013;5:29. Epub 2013/07/13. [DOI] [PMC free article] [PubMed] [Google Scholar]
- 50.Travers JB, Dinardo LA, Karimnamazi H. Motor and premotor mechanisms of licking. Neuroscience & Biobehavioral Reviews. 1997;21(5):631–47. [DOI] [PubMed] [Google Scholar]
- 51.Chen Z, Travers SP, Travers JB. Muscimol infusions in the brain stem reticular formation reversibly block ingestion in the awake rat. American Journal of Physiology-Regulatory, Integrative and Comparative Physiology. 2001;280(4):R1085–R94. [DOI] [PubMed] [Google Scholar]
- 52.Welsh JP, Lang EJ, Sugihara I, Llinás R. Dynamic organization of motor control within the olivocerebellar system. Nature. 1995;374(6521):453. [DOI] [PubMed] [Google Scholar]
- 53.Cao Y, Maran SK, Dhamala M, Jaeger D, Heck DH. Behavior-related pauses in simple-spike activity of mouse Purkinje cells are linked to spike rate modulation. Journal of Neuroscience. 2012;32(25):8678–85. [DOI] [PMC free article] [PubMed] [Google Scholar]
- 54.Lu L, Cao Y, Tokita K, Heck DH, Boughter JD Jr. Medial cerebellar nuclear projections and activity patterns link cerebellar output to orofacial and respiratory behavior. Frontiers in neural circuits. 2013;7. [DOI] [PMC free article] [PubMed] [Google Scholar]
- 55.Welzl H, Bureš J. Lick-synchronized breathing in rats. Physiology & behavior. 1977;18(4):751–3. [DOI] [PubMed] [Google Scholar]
- 56.Weijnen J, Wouters J, Van Hest J. Interaction between licking and swallowing in the drinking rat. Brain, behavior and evolution. 1984;25(2–3):117–27. [DOI] [PubMed] [Google Scholar]
- 57.Travers JB, Jackson LM. Hypoglossal neural activity during licking and swallowing in the awake rat. Journal of neurophysiology. 1992;67(5):1171–84. [DOI] [PubMed] [Google Scholar]