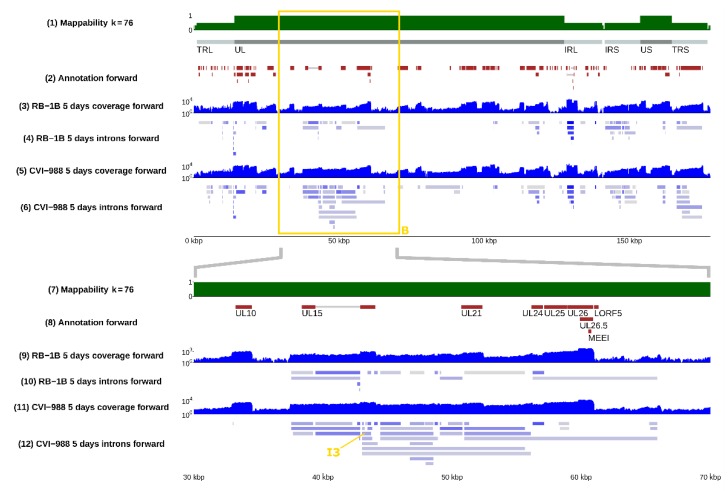
Figure 3.
The landscape of alternative splicing in the unique long region of MDV. Top panel: positive strand of the whole MDV genome; bottom panel: the region between positions 30 and 70 kb. The bottom panel is a magnified version of the content of the yellow frame B present in the top panel and in Figure 1. Although many annotated and unannotated introns were present along this area in RB-1B during its infection of CEF cells – track (9) – the complexity of the splicing landscape in the same region was vastly superior in CVI-988, which showed several times more introns being actively spliced – track (11). Intron I3, which is one of the several expressed in CVI-988 and not in RB-1B, is highlighted with a yellow arrow in the bottom panel. The bottom panel of this figure can be reproduced in the online MDV genome browser by accessing https://mallorn.pirbright.ac.uk/browsers/MDV-annotation/Figure-3.html.

