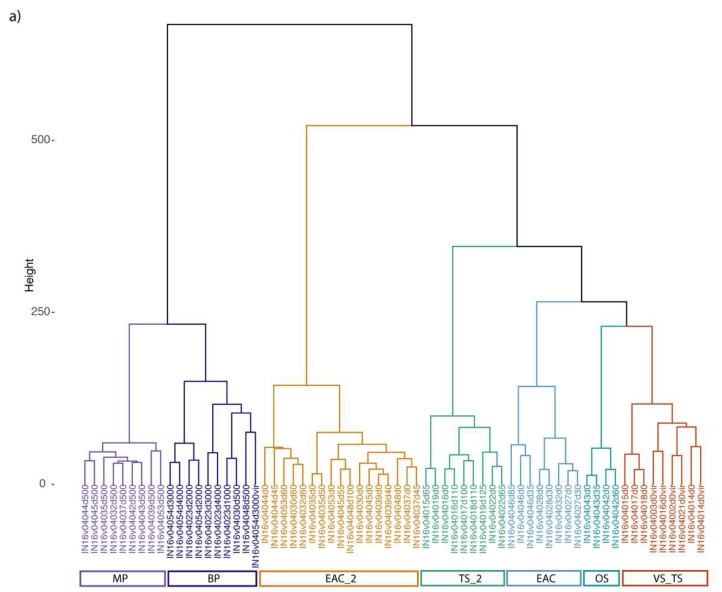
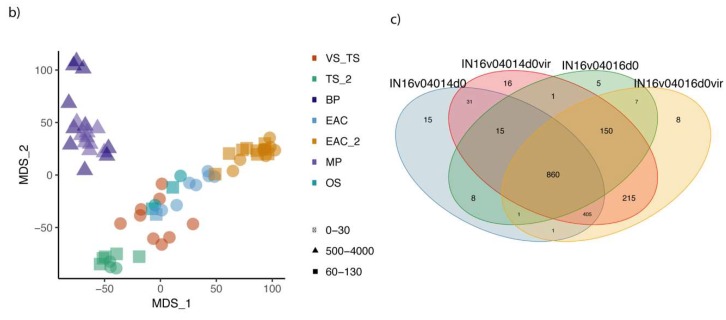
Figure 3.
(a) Hierarchical clustering of sites based on the normalized abundance of large viral contigs (n = 624). A SIMPROF analysis based on Bray–Curtis dissimilarity index was used to identify seven significant clusters. The relative abundance of viral contigs was normalized based on reads count and square root transformed. Sites are color-coded bases on significant clusters. VS_TS = Virome and surface Tasman samples, TS = Tasman Sea surface and DCM, EAC and EAC_2 = EAC, Tr_M and S.N, OS = Offshore samples from Tr_M, MP = Mesopelagic samples (500 m), BP = Bathypelagic samples and virome samples. (b) Non-metric multidimensional scaling plot of the bacteriophage diversity observed in the first two axes for all the stations and depths. Samples are color-coded based on hierarchal clusters calculated from the SIMPROF test (Clustsig). Shapes are related to different depth ranges. (c) Venn diagram showing the distribution of shared and unique viral contigs in the microbial fraction (>0.2 µm) (INv04014d0, IN16v04016d0) and the viral fraction (<0.2 µm) (INv04014d0vir, IN16v04016d0vir), from the same sites.


