Figure 6.
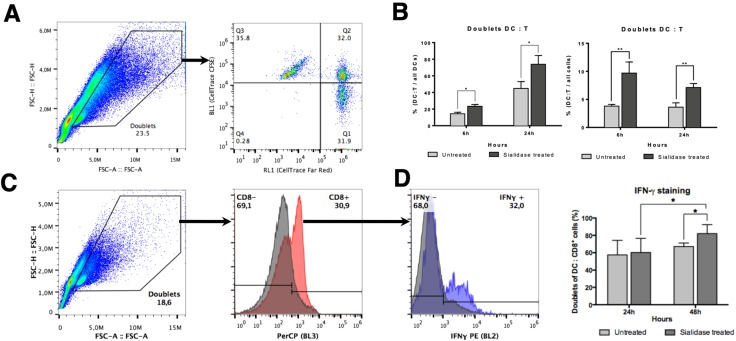
Co-cultures of DCs (untreated or sialidase treated) with autologous CD8+ T cells. (A) Gating strategy used to identify DC:T cell interactions. Co-cultures of FarRed®-labeled DCs with CFSE-labeled autologous CD8+ T cells were analyzed by flow cytometry. Single cells were excluded and doublet identification was considered when the two fluorescences co-localize. (B) Percentage of DC:T cell doublets in relation to all DCs.. The number of doublet DC:T cell and of the number of total DCs (as evaluated by staining with FarRed fluorescence) was quantified by flow cytometry at 6 h and 24 h of co-culture. The graph represents the percentage of DC:T cell doublets in relation to the total number of DCs (N = 6). (C) Percentage of DC:T cell doublets in relation to all cells.. The number of doublet DC:T cell and of the number of total events was quantified by flow cytometry at 6 h and 24 h of co-culture. The graph represents the percentage of DC:T cell doublets in relation to the total number of cells (doublet and non-doublet) (N = 6). (D) Intracellular IFN-γ production was evaluated at 24 h and 48 h of co-culture. The left panel shows the gating strategy, which considers doublet populations of DC:T cells stained with the anti-human CD8 (HIT8a) antibody and with anti-IFN-γ (B27). The right panel shows a graph representing the percentage of CD8+ cells that express IFN-γ in relation to the total number of DC:T cells interacting (N = 5). Values presented as mean ± SEM. Statistically significant differences are indicated by asterisks (* p ≤ 0.05, ** p ≤ 0.01).

