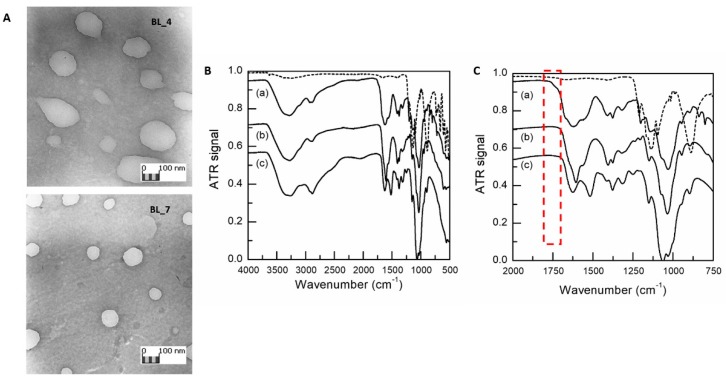
Figure 1.
(A) TEM images of BL_4 and BL_7 samples (obj. mag. 20 k×). (B) FTIR spectra from 500 to 4000 cm−1 of sodium tripolyphosphate (TPP) raw material (dashed line), freeze dried HA/CS NPs (Et_CS_7) (a), HA raw material (b) and CS raw material (c); (C) Enlargement of the fingerprint region from 750 to 2000 cm−1. HA and CS spectrum have been shifted vertically by -0.2 and -0.45, respectively, to clarify viewing.

