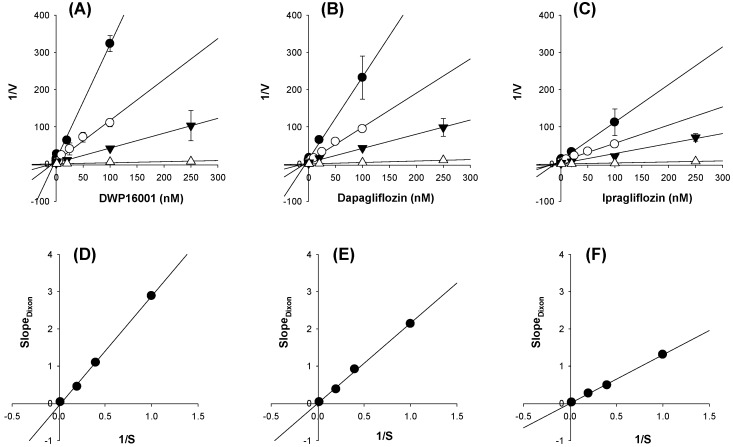
Figure 10.
Dixon plot for the inhibitory effect of (A) DWP16001, (B) dapagliflozin, and (C) ipragliflozin on the uptake of [14C]methyl-a-D-glucopyranoside (AMG) in CHO-SGLT2 cells. Each symbol represents the concentration of [14C]AMG: ●, 1 μM; ○, 2.5 μM; ▼, 5 μM; △, 50 μM. Replot of the slopes of Dixon plot (slopes vs 1/[S]) was shown for (D) DWP16001, (E) dapagliflozin, and (F) ipragliflozin. V indicates the SGLT2-mediated uptake rate of [14C]AMG and S indicates the concentration of [14C]AMG. The data are the means±standard deviations of triplicate measurements.

