

Abstract
Objective
To identify markers associated with in-hospital death in patients with coronavirus disease 2019 (COVID-19)–associated pneumonia.
Patients and Methods
A retrospective cohort study was conducted of 140 patients with moderate to critical COVID-19–associated pneumonia requiring oxygen supplementation admitted to the hospital from January 28, 2020, through February 28, 2020, and followed up through March 13, 2020, in Union Hospital, Wuhan, China. Oxygen saturation (SpO2) and other measures were tested as predictors of in-hospital mortality in survival analysis.
Results
Of 140 patients with COVID-19–associated pneumonia, 72 (51.4%) were men, with a median age of 60 years. Patients with SpO2 values of 90% or less were older and were more likely to be men, to have hypertension, and to present with dyspnea than those with SpO2 values greater than 90%. Overall, 36 patients (25.7%) died during hospitalization after median 14-day follow-up. Higher SpO2 levels after oxygen supplementation were associated with reduced mortality independently of age and sex (hazard ratio per 1-U SpO2, 0.93; 95% CI, 0.91 to 0.95; P<.001). The SpO2 cutoff value of 90.5% yielded 84.6% sensitivity and 97.2% specificity for prediction of survival. Dyspnea was also independently associated with death in multivariable analysis (hazard ratio, 2.60; 95% CI, 1.24 to 5.43; P=.01).
Conclusion
In this cohort of patients with COVID-19, hypoxemia was independently associated with in-hospital mortality. These results may help guide the clinical management of patients with severe COVID-19, particularly in settings requiring strategic allocation of limited critical care resources.
Trial Registration
Chictr.org.cn Identifier: ChiCTR2000030852
Abbreviations and Acronyms: AUC, area under the curve; COPD, chronic obstructive pulmonary diseases; COVID-19, coronavirus disease 2019; CRP, C-reactive protein; CT, computed tomography; HR, hazard ratio; IQR, interquartile range; RT-PCR, reverse transcriptase polymerase chain reaction; SpO2, oxygen saturation; WBC, white blood cell
The coronavirus disease 2019 (COVID-19) outbreak is now pandemic, straining medical infrastructure, personnel, and resources in much of Europe, the Middle East, and North America, with significant consequences for clinical management, including rationing of care.1 , 2 Contemporary statistics indicate that 14% of COVID-19–associated pneumonia cases are severe, and 5% of infected patients require intensive care.3 Mortality rates in severe and critically ill patients are staggering, with the disease being fatal in approximately two-thirds.4, 5, 6 Given the limited availability of critical care resources, it is imperative to identify simple but reliable predictors of survival in patients with COVID-19 who present with at least moderate disease severity. We thus sought to identify and compare differential predictive values of demographic, clinical, and laboratory measures in moderate to critically ill patients with COVID-19 from Wuhan, China. Because COVID-19 primarily attacks the respiratory system, measures that reflect respiratory function would more likely relate to outcomes, particularly in a rapidly progressive disease condition. We, therefore, focused particularly on dyspnea and systemic oxygenation as potential prognostic biomarkers.
Patients and Methods
Study Design and Patients
This single-center retrospective cohort study enrolled patients with moderate to critical COVID-19–associated pneumonia hospitalized and treated by the Beijing Medical Team in Union Hospital, Wuhan, from January 28, 2020, through February 28, 2020, with follow-up through March 13, 2020. The Beijing Medical Team consisted of physician volunteers from Beijing (J.X., W.G.). The Beijing Anzhen Hospital institutional review board approved this study.
National Health Committee of the People's Republic of China recommendations for diagnosis of COVID-19–associated pneumonia were used.7 Patients included in this study met the following criteria: confirmed COVID-19 infection based on real-time reverse transcriptase polymerase chain reaction (RT-PCR) testing from a throat swab sample; objective evidence of new-onset pneumonia from chest computed tomography (CT); typical symptoms of pneumonia, ie, fever, cough, dyspnea, etc; and pneumonia severity graded as moderate, severe, or critical. Disease severity was defined according to the classification proposed in the Chinese guidelines for COVID-19–associated pneumonia (Supplemental Table, available online at http://www.mayoclinicproceedings.org). Moderate cases presented with typical symptoms of pneumonia, ie, fever, cough, expectoration, and dyspnea, with definitive lesions confirmed by CT. Severe cases met 1 or more of the following criteria: respiratory rate of 30 bpm or more, oxygen saturation (SpO2) of 93% or less at rest or pressure of arterial oxygen to fractional inspired oxygen concentration of 300 mm Hg or less, or greater than 50% progression of lesions as evident from CT during the past 48 hours. Last, patients with COVID-19–associated pneumonia were regarded as critical if they satisfied 1 or more of the following: intubation needed due to respiratory failure, shock, and multiple organ dysfunction requiring intensive care unit treatment. Patients with a very high clinical suspicion of COVID-19–associated pneumonia, namely, definite epidemiologic exposure (such as family breakout) and other aforementioned features were clinically diagnosed by a specialist team, hospitalized in the same quarantine zone, and were included in this study despite the absence of documented confirmation from nucleic acid screening.
Importantly, regarding the appropriate recent concerns of inclusion of the same patients in different reports,8 we are aware of only 1 previous study of patients from Union Hospital that may have included approximately 20 of the 140 patients in the present study.9 In any event, this article makes no mention of the key findings in the present study, namely, the role of dyspnea and hypoxemia as predictors of mortality.
Clinical Management
All patients were treated following the Chinese guidelines.7 Although antibiotic drugs were not recommended as routine treatment, they were still considered if patients were found to have evidence of definite or suspected bacterial infection, such as abundant purulent sputum, based on clinical assessment by the responsible physician. Depending on disease severity and clinical assessment of patients at hospitalization, oxygen supplementation by nasal cannula was administered to all patients directly at hospital admission. The oxygen flow ranged from low (1-2 L/min) to high (10 L/min) and varied as per the patient’s response, with the goal of maintaining peripheral SpO2 of at least 95%. The SpO2 after oxygen supplementation was measured by finger oximetry 2 to 5 minutes after beginning oxygen support. If the SpO2 value fell below 95%, high-flow oxygen supplementation by mask, high nasal flow, and mechanical ventilation were considered as needed.
Clinical and Laboratory Data and Outcome Assessment
Demographic and clinical characteristics were collected from patients or their relatives, physical examination findings, and medical records. Measures of white blood cells (WBCs), neutrophils, lymphocytes, platelets, C-reactive protein (CRP), and D-dimer were acquired in blood. Dates of death were obtained from registration and verified by reviewing the medical record. Follow-up duration was computed as the interval (in days) from the date of admission to the date of death or the date of discharge, whichever occurred first. Stable patients who remained hospitalized at the end of follow-up were regarded to be alive.
Statistical Analyses
Continuous data are reported as median and interquartile range (IQR), and categorical data are expressed as frequency and percentage. Wilcoxon signed rank tests and Pearson χ2 tests were used to compare continuous and categorical data between patients with SpO2 values greater than 90% vs SpO2 values of 90% or less after oxygen supplementation. Survival was calculated using the Kaplan-Meier method and the log-rank test, using as exposures SpO2, dyspnea, and other demographic and clinical characteristics. Univariate and multivariable (age- and sex-adjusted) Cox proportional hazards models were run, with associations expressed as hazard ratios (HRs) and 95% CIs. We used a receiver operating characteristic curve analysis to determine the optimal cutoff value of SpO2 after oxygen supplementation for predicting survival based on the threshold yielding the best combination of sensitivity and specificity. Statistical analysis was performed using JMP software, Version 14.1 (SAS Institute Inc), and a 2-sided P<.05 was considered significant.
Results
Patient Characteristics
Generally, 140 patients were considered to have a very high likelihood of COVID-19–associated pneumonia based on exposure and clinical and radiologic criteria: 113 had RT-PCR–confirmed COVID-19 infection, 20 who were transferred for management of COVID-19–associated pneumonia did not have RT-PCR data available, and 7 were RT-PCR negative, presumably false-negatives. Thirty-six patients (26%) (25 of 72 men [34.7%] and 11 of 68 women [16.2%]) died in the hospital a median of 14 days (IQR, 6-26 days) after admission. Of 71 patients 60 years or older, 33 (46.5%) died; 9 of 13 patients (69.2%) died in the group of 80 years or older. Patients’ demographic, clinical, and laboratory characteristics and treatment information are presented in Table 1 . Forty-three (30.7%), 73 (52.1%), and 24 (17.1%) patients met the criteria for moderate, severe, and critical COVID-19–associated pneumonia, respectively. Patients with SpO2 values of 90% or less on oxygen supplementation were older (median [IQR] age: 67 years [61-78 years] vs 53 years [40-63 years]; P<.001) and were more likely to be men (64.71% vs 43.82%; P=.02) and to have hypertension (43.14% vs 20.22%; P=.004) than those with SpO2 values greater than 90%. Other comorbidities were similar between groups. Patients with more severe hypoxemia were more likely to present with dyspnea (64.71% vs 40.45%; P=.006) and to be classified as critical on hospital admission (45.10% vs 1.12%; P<.001). Regarding treatment, antibiotic agents (88.2% vs 67.4%; P=.006) and high nasal flow (9.80% vs 1.12%; P=.02) were more commonly administered in patients with SpO2 values of 90% or less. Mechanical ventilation was administered only to these patient groups. Analysis of laboratory biomarkers showed that WBC count, neutrophils, CRP, and D-dimer were higher and lymphocytes and platelets were lower in patients with SpO2 values of 90% or less vs those with SpO2 values greater than 90%.
Table 1.
Demographic, Clinical, and Laboratory Characteristics of Patients With Coronavirus Disease 2019–Associated Pneumoniaa
| Characteristic | Total (N=140) | SpO2 ≤90% (n=51) | SpO2 >90% (n=89) | P value |
|---|---|---|---|---|
| Demographics | ||||
| Age (y), median (IQR) | 60 (47-68) | 67 (61-78) | 53 (40-63) | <.001 |
| Male sex (No. [%]) | 72 (51.43) | 33 (64.71) | 39 (43.82) | .02 |
| Comorbidities (No. [%]) | ||||
| Any comorbidityb | 69 (49.29) | 39 (76.47) | 30 (33.71) | <.001 |
| Hypertension | 40 (28.57) | 22 (43.14) | 18 (20.22) | .004 |
| Diabetes | 20 (14.29) | 8 (15.69) | 12 (13.48) | .72 |
| Cardiovascular disease | 8 (5.71) | 5 (9.80) | 3 (3.37) | .12 |
| COPD/asthma | 2 (1.43) | 1 (1.96) | 1 (1.12) | .69 |
| Renal failure | 7 (5.00) | 4 (7.84) | 3 (3.37) | .24 |
| Cancer | 5 (3.57) | 2 (3.92) | 3 (3.37) | .87 |
| Clinical presentation (No. [%]) | ||||
| Fever | 112 (80.00) | 41 (80.39) | 71 (79.78) | .93 |
| Cough | 79 (56.43) | 30 (58.82) | 49 (55.06) | .67 |
| Dyspnea | 69 (49.29) | 33 (64.71) | 36 (40.45) | .006 |
| Diarrhea | 33 (23.57) | 12 (23.53) | 21 (23.60) | .99 |
| Disease severity | ||||
| Moderate (No. [%]) | 43 (30.71) | 0 | 43 (48.31) | <.001 |
| Severe (No. [%]) | 73 (52.14) | 28 (54.90) | 45 (50.56) | .62 |
| Critical (No. [%]) | 24 (17.14) | 23 (45.10) | 1 (1.12) | <.001 |
| Onset of symptom before hospitalization (d), median (IQR) | 10 (7-14) | 10 (7-14) | 10 (8-14) | .19 |
| SpO2 after oxygen supplementation (%), median (IQR) | 95 (84-97) | 80 (70-85) | 97 (95-98) | <.001 |
| Treatment (No. [%]) | ||||
| Antibiotics | 105 (75.00) | 45 (88.24) | 60 (67.42) | .006 |
| Nasal high flow | 6 (4.29) | 5 (9.80) | 1 (1.12) | .02 |
| Mechanical ventilation | 13 (9.28) | 13 (25.49) | 0 | <.001 |
| Invasive mechanical ventilation | 6 (4.29) | 6 (11.86) | 0 | <.001 |
| Blood biochemistry, median (IQR)c | ||||
| WBC count (×109/L) | 5.85 (4.17-8.33) | 8.54 (6.61-10.81) | 4.75 (3.94-6.78) | <.001 |
| Neutrophil count (×109/L) | 4.09 (2.65-6.36) | 7.46 (5.01-9.60) | 3.29 (2.28-4.77) | <.001 |
| Lymphocyte count (×109/L) | 0.92 (0.68-1.37) | 0.70 (0.44-0.98) | 1.03 (0.77-1.57) | <.001 |
| Platelet count (×109/L) | 203 (145-273) | 165 (112-240) | 215 (162-283) | .003 |
| C-reactive protein (mg/L) | 27.78 (5.64-75.55) | 76.51 (41.68-117.09) | 12.70 (3.49-32.10) | <.001 |
| D-dimer (μg/mL) | 0.45 (0.22-1.90) | 3.05 (0.45-8.00) | 0.30 (0.17-0.81) | <.001 |
| Hospital stay (d), median (IQR) | 14 (6-26) | 8 (4-20) | 16 (9-31) | .004 |
COPD = chronic obstructive pulmonary disease; IQR = interquartile range; SpO2 = oxygen saturation; WBC = white blood cell.
Presence of any comorbidity was defined as the presence of 1 or more of the following chronic diseases: hypertension, diabetes, cardiovascular disease, COPD, asthma, and end-stage renal failure.
The following variables had missing data: WBC count (n=136), neutrophil count (n=128), lymphocyte count (n=135), platelet count (n=127), C-reactive protein (n=105), and D-dimer (n=83).
Association Between Demographic and Clinical Characteristics and In-Hospital Mortality
Age 60 years or older (HR, 12.21; 95% CI, 3.74 to 39.84; P<.001), male sex (HR, 2.30; 95% CI, 1.13 to 4.68; P=.02), hypertension (HR, 1.97; 95% CI, 1.02 to 3.81; P=.04), and presence of any comorbidity (defined as ≥1 comorbidity among those shown in Table 1) (HR, 5.26; 95% CI, 2.19 to 12.64; P<.001) were associated with mortality in univariate analysis (Figure 1 and Table 2 ). Presence of any comorbidity remained a significant risk factor associated with death after adjusting for age and sex (HR, 2.65; 95% CI, 1.07 to 6.55; P=.04).
Figure 1.

Kaplan-Meier curves for in-hospital mortality by demographic and clinical data. A, Median (interquartile range [IQR]) follow-up for patients 60 years or older (n=71) was 12 days (5 to 19 days) and for those younger than 60 years (n=69) was 17 days (8 to 33 days). B, Median (IQR) follow-up for male patients (n=72) was 13 days (4 to 29 days) and for female patients (n=68) was15 days (8 to 24 days). C, Median (IQR) follow-up for patients with at least 1 comorbidity (n=69) was 14 days (6 to 32 days) and for patients without comorbidities (n=71) was 14 days (7 to 25 days). D, Median (IQR) follow-up for patients with hypertension (n=40) was 14 days (7 to 40 days) and for patients without hypertension (n=100) was 14 days (6 to 22 days).
Table 2.
Risk Factors for Mortality in 140 Patients With Moderate to Critical Coronavirus Disease 2019–Associated Pneumoniaa
| Risk factor | Unadjusted |
Adjustedb |
||
|---|---|---|---|---|
| HR (95%CI) | P value | HR (95%CI) | P value | |
| Demographic and clinical characteristics | ||||
| Age (≥60 y vs <60 y) | 12.21 (3.74-39.84) | <.001 | ||
| Sex (male vs female) | 2.30 (1.13-4.68) | .02 | ||
| Hypertension (yes vs no) | 1.97 (1.02-3.81) | .04 | 1.19 (0.61-2.33) | .61 |
| Any comorbidity (yes vs no) | 5.26 (2.19-12.64) | <.001 | 2.65 (1.07-6.55) | .04 |
| Hypoxemia indices | ||||
| SpO2 (per 1-U increase) | 0.92 (0.91-0.94) | <.001 | 0.93 (0.91-0.95) | <.001 |
| SpO2 ≤90% (≤90% vs >90%) | 77.06 (10.55-562.76) | <.001 | 47.41 (6.29-357.48) | <.001 |
| Dyspnea (yes vs no) | 2.94 (1.42-6.11) | .004 | 2.60 (1.24-5.43) | .01 |
| Blood biochemistryc | ||||
| WBC count (≥10×109/L vs <10×109/L) | 6.21 (3.04-12.69) | <.001 | 2.56 (1.17-5.63) | .02 |
| Neutrophil count (≥6×10⁹/L vs <6×10⁹/L) | 7.43 (3.17-17.42) | <.001 | 4.29 (1.74-10.58) | .002 |
| Lymphocyte count (<1×10⁹/L vs ≥1×10⁹/L) | 1.81 (0.84-3.92) | .13 | 1.10 (0.50-2.41) | .81 |
| Platelet count (<150×109/L vs ≥150×109/L) | 3.77 (1.79-7.94) | <.001 | 2.23 (1.01-4.92) | .05 |
| CRP (≥27.8 mg/L vs <27.8 mg/L) | 28.80 (3.91-212.30) | .001 | 17.02 (2.25-128.59) | .006 |
| D-dimer (≥0.45 μg/mL vs <0.45 μg/mL) | 5.41 (1.20-24.42) | .03 | 3.07 (0.59-15.98) | .18 |
CRP = C-reactive protein; HR = hazard ratio; SpO2 = oxygen saturation; WBC = white blood cell.
Adjusted for age and sex.
Laboratory data were dichotomized based on conventional clinical cutoff values (WBC count, neutrophil count, lymphocyte count, and platelet count) or on median value (CRP and D-dimer).
Association Between Dyspnea and Hypoxemia and In-Hospital Mortality
Those reporting dyspnea as initial symptom were more likely to die than those who did not report it (Figure 2 A) (38% vs 14%, log-rank P=.002; HR, 2.94; 95% CI, 1.42 to 6.11; P=.004; Table 2). Thirty-five of 51 patients (68.63%) with SpO2 values of 90% or less after oxygen supplementation did not survive, whereas 88 of 89 (98.9%) of those with SpO2 values greater than 90% did survive (log-rank P<.001) (Figure 2B). Modeling SpO2 as a continuous variable in the Cox model we found that for each 1-U increase in SpO2, mortality risk decreased by approximately 8% (HR, 0.92; 95% CI, 0.91 to 0.94; P<.001). Dyspnea (HR, 2.60; 95% CI, 1.24 to 5.43; P=.01) and SpO2 (HR, 0.93; 95% CI, 0.91 to 0.95; P < .001) were significantly associated with outcomes in multivariable models)(Table 2). Notably, sensitivity analysis restricted to patients with confirmed COVID-19 infection based on RT-PCR testing (n=113) showed that the independent association between dyspnea and death persisted in this sample (HR, 3.20; 95% CI, 1.26 to 9.79; P=.014), and no patients with SpO2 values greater than 90% died. An SpO2 value of 90% or less was also strongly associated with death, independently of age and sex (multivariable HR, 47.41; 95% CI, 6.29 to 357.48; P<.001). The receiver operating characteristic curve analysis showed that SpO2 of 90.5% was the optimal SaO2 cutoff point for predicting survival, demonstrating 84.6% sensitivity, 97.2% specificity, and 87.9% accuracy. The overall area under the curve was 96% (Figure 3 ). In a subgroup analysis of 13 patients 80 years or older, 9 (69.2%) died. All 80-year-old patients with SpO2 values greater than 90% (n=3) receiving supplemental oxygen survived.
Figure 2.

Kaplan-Meier curves for in-hospital mortality by hypoxemia indices. A, Median (interquartile range [IQR]) follow-up for patients with dyspnea (n=69) was 10 days (6 to 26 days) and for those without dyspnea (n=71) was 16 days (8 to 26 days). B, Median (IQR) follow-up for patients with oxygen saturation (SpO2) values of 90% or less (n=51) was 8 days (4 to 20 days) and for those with SpO2 values greater than 90% (n=89) was 16 days (9 to 31 days).
Figure 3.
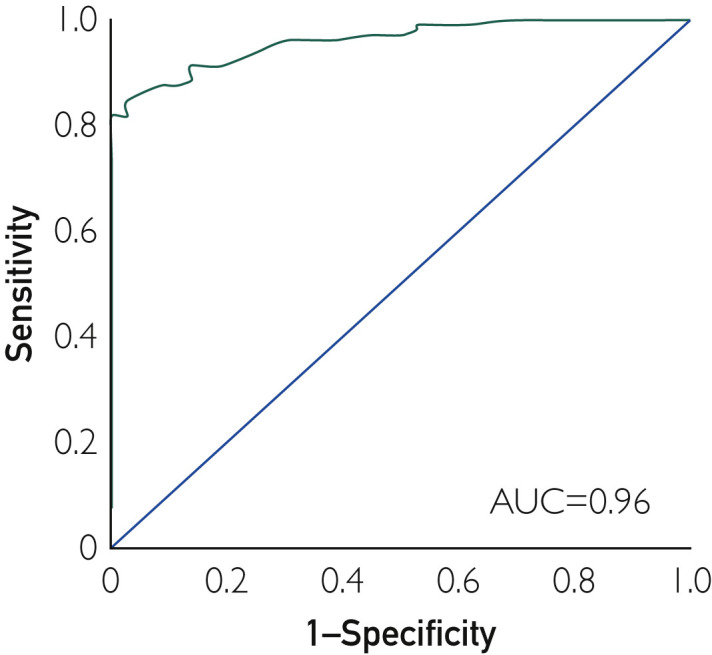
Receiver operating characteristic curve of the oxygen saturation threshold for predicting death in patients with moderate to critical coronavirus disease 2019–associated pneumonia. AUC = area under the curve.
Association Between Inflammatory and Hematologic Markers and In-Hospital Mortality
Laboratory biomarkers were proved to be associated with mortality by the Kaplan-Meier method (Figure 4 ) and univariate Cox regression analysis (Table 2). In adjusted models, a WBC count of at least 10×109/L (HR, 2.56; 95% CI, 1.17 to 5.63; P=.02), neutrophil count of at least 6×10⁹/L (HR, 4.29; 95% CI, 1.74 to 10.58; P=.002), and CRP level of at least 27.8 mg/L (HR, 17.02; 95% CI, 2.25 to 128.59; P=.006) retained significant associations with death (Table 2).
Figure 4.

Kaplan-Meier curves for in-hospital mortality by laboratory markers. A, Median (interquartile range [IQR]) follow-up for patients with white blood cell (WBC) counts of 10×109/L or higher (n=15) was 6 days (4 to 14 days) and for those with WBC counts less than 10×109/L (n=121) was 15 days (8 to 29 days). B, Median (IQR) follow-up for patients with neutrophil counts of 6×10⁹/L or greater (n=40) was 12 days (5 to 37 days) and for those with neutrophil counts less than 6×10⁹/L (n=88) was 15 days (8 to 27 days). C, Median (IQR) follow-up for patients with C-reactive protein (CRP) levels of at least 27.8 mg/L (n=52) was 14 days (4 to 24 days) and for patients with CRP levels less than 27.8 mg/L (n=53) was 14 days (8 to 32 days). D, Median (IQR) follow-up for patients with D-dimer levels of 0.45 μg/mL or greater (n=42) was 18 days (8 to 40 days) and for patients with D-dimer levels less than 0.45 μg/mL (n=41) was 18 days (9 to 42 days).
Discussion
These data provide insights into risk factors for mortality in a relatively large sample of moderately to critically ill patients with COVID-19–associated pneumonia. In line with previous reports,5 , 10 the present data confirm that age, sex, comorbidities, and inflammatory biomarkers are associated with mortality. We further report novel and clinically important findings of independent death-associated value of two very simple yet readily assessed characteristics: dyspnea and hypoxemia (SpO2 ≤90% despite oxygen supplementation).
The COVID-19 pandemic is sweeping across Europe and the Middle East and currently threatening North America. Our understanding of clinical presentations and optimal management strategies are evolving rapidly and are primarily based on experiences treating Chinese patients in the epicenter of the disease in Wuhan. Experiences initially in Wuhan, and subsequently all over the world, suggest that the rapid and life-threatening progression of the disease and the need for intense supportive measures have the potential to rapidly overwhelm hospital and other medical resources. The high mortality of the more severely ill patients also suggests that many patients die despite receiving intense care.4, 5, 6 Thus, outcome data using readily assessed clinical measures are required to better inform decisions regarding allocation of care resources, especially in situations requiring triage strategies and care rationing.
We found that dyspnea, an easily assessed symptom, is associated with death in patients with COVID-19–associated pneumonia independently of age and sex. However, a related and also easily acquired clinical measure, SpO2 of 90% or less despite oxygen supplementation, provides a more robust risk factor for fatal outcomes; indeed, this measure is the most powerful predictor of the multiple measures we obtained, including the more standard demographic and inflammatory measures reported in earlier studies.5 , 10
The present finding of the important prognostic value of dyspnea and hypoxemia for hospitalized patients with COVID-19–associated pneumonia provides a rationale for applying standard scoring strategies to estimate risk and guide treatment even in this patient population, ie, the CURB-65 Scale, the Pneumonia Severity Index, and the Acute Physiology and Chronic Health Evaluation II.11 Future studies assessing the prognostic significance of such models in COVID-19–associated pneumonia are needed.
Note that exploratory subgroup analysis of patients 80 years or older, in whom mortality is known to be especially high (69.2% in the present study), revealed that all 3 patients with SpO2 greater than 90% survived. Although these results must be interpreted with caution given the small sample size and possible confounding effects of age, they may be especially relevant considering the limited access to care in areas overwhelmed by COVID-19 cases, with older age possibly being used as a triage criterion for care prioritization.2
Because severe hypoxemia was associated with pronounced elevation of inflammatory markers (higher WBC counts, neutrophil counts, D-dimer levels, and CRP levels), acute inflammation of the respiratory system, caused by respiratory virus or secondary bacterial infection,12 may be mechanistically responsible for the significant pulmonary injury and, thus, persistent hypoxemia. Whether attenuating this inflammatory response early in the disease would improve oxygenation and possibly survival remains to be determined.
We acknowledge that the present study has limitations. A few patients (<6%) had negative RT-PCR testing for infection despite a high clinical probability of COVID-19–associated pneumonia based on clinical and radiographic assessment and epidemiologic exposure. Because the proportion of unconfirmed cases is consistent with reported sensitivity data of RT-PCR testing for COVID-19,13 we presume that these were false-negatives. The robustness of the present findings is further supported by results of a sensitivity analysis showing that dyspnea and SpO2 values of 90% or less remained independently associated with mortality in the sample including only patients with confirmed COVID-19 from RT-PCR testing. Second, these data were acquired under emergency situations operating under crisis conditions, as with many other contemporaneous studies from Wuhan. Therefore, completeness of data recording, particularly at the time of hospital admission, was less than optimal. For example, while oxygen supplementation at admission was administered with the goal of achieving SpO2 of at least 95%, the specific amount of oxygen supplementation administered to each patient on admission was not recorded. Therefore, we cannot incorporate comparisons of administered inspired oxygen concentration into the analyses. Similarly, while recognizing that dyspnea has the inherent limitation of subjectivity, no consistent data relative to dyspnea severity, time to intubation/high-flow oxygen and time on mechanical ventilation, and changes in SpO2 during hospitalization were available. The impact of these variables on outcomes in patients with COVID-19 warrants further investigation.
Conclusion
We report that in moderate to critically ill patients with COVID-19, SpO2 values greater than 90% with oxygen supplementation indicate a very high likelihood of survival. These patients should, thus, receive maximal supportive care during the acute illness. We further speculate that patients with SpO2 values less than 90% despite oxygen supplementation, in whom there is a particularly high mortality risk, may be more likely to benefit from experimental therapies such as investigational drugs and antibody drug therapy.
Acknowledgments
We thank all the patients involved in this study.
Footnotes
For editorial comment, see page 1094
Potential Competing Interests: The authors report no competing interests.
Supplemental Online Material
Supplemental material can be found online at http://www.mayoclinicproceedings.org. Supplemental material attached to journal articles has not been edited, and the authors take responsibility for the accuracy of all data.
References
- 1.Grasselli G., Pesenti A., Cecconi M. Critical care utilization for the COVID-19 outbreak in Lombardy, Italy: early experience and forecast during an emergency response. https://doi.org/10.1001/jama.2020.4031 [published online March 13, 2020]. JAMA. [DOI] [PubMed]
- 2.White D.B., Lo B. A framework for rationing ventilators and critical care beds during the COVID-19 pandemic. https://doi.org/10.1001/jama.2020.5046 [published online March 27, 2020]. JAMA. [DOI] [PubMed]
- 3.Wu Z., McGoogan J.M. Characteristics of and important lessons from the coronavirus disease 2019 (COVID-19) outbreak in China: summary of a report of 72314 cases from the Chinese Center for Disease Control and Prevention. https://doi.org/10.1001/jama.2020.2648 [published online February 24, 2020]. JAMA. [DOI] [PubMed]
- 4.Arentz M., Yim E., Klaff L. Characteristics and outcomes of 21 critically ill patients with COVID-19 in Washington State. https://doi.org/10.1001/jama.2020.4326 [published online March 19, 2020]. JAMA. [DOI] [PMC free article] [PubMed]
- 5.Wu C., Chen X., Cai Y. Risk factors associated with acute respiratory distress syndrome and death in patients with coronavirus disease 2019 pneumonia in Wuhan, China. https://doi.org/10.1001/jamainternmed.2020.0994 [published online March 13, 2020]. JAMA Intern Med. [DOI] [PMC free article] [PubMed]
- 6.Yang X., Yu Y., Xu J. Clinical course and outcomes of critically ill patients with SARS-CoV-2 pneumonia in Wuhan, China: a single-centered, retrospective, observational study. https://doi.org/10.1016/S2213-2600(20)30079-5 [published online February 24, 2020]. Lancet Respir Med. [DOI] [PMC free article] [PubMed]
- 7.National Health Committee of the People’s Republic of China New coronavirus pneumonia diagnosis and treatment plan. http://www.nhc.gov.cn
- 8.Bauchner H., Golub R.M., Zylke J. Editorial concern-possible reporting of the same patients with COVID-19 in different reports. https://doi.org/10.1001/jama.2020.3980 [published online March 16, 2020]. JAMA. [DOI] [PubMed]
- 9.Jin J.-M., Bai P., He W. Gender differences in patients with COVID-19: focus on severity and mortality. https://doi.org/10.1101/2020.02.23.20026864 [published online March 5, 2020]. medRxiv. [DOI] [PMC free article] [PubMed]
- 10.Zhou F., Yu T., Du R. Clinical course and risk factors for mortality of adult inpatients with COVID-19 in Wuhan, China: a retrospective cohort study. Lancet. 2020;395(10229):1054–1062. doi: 10.1016/S0140-6736(20)30566-3. [DOI] [PMC free article] [PubMed] [Google Scholar]
- 11.Loke Y.K., Kwok C.S., Niruban A., Myint P.K. Value of severity scales in predicting mortality from community-acquired pneumonia: systematic review and meta-analysis. Thorax. 2010;65(10):884–890. doi: 10.1136/thx.2009.134072. [DOI] [PubMed] [Google Scholar]
- 12.Jochems S.P., Marcon F., Carniel B.F. Inflammation induced by influenza virus impairs human innate immune control of pneumococcus. Nat Immunol. 2018;19(12):1299–1308. doi: 10.1038/s41590-018-0231-y. [DOI] [PMC free article] [PubMed] [Google Scholar]
- 13.Corman V.M., Landt O., Kaiser M. Detection of 2019 novel coronavirus (2019-nCoV) by real-time RT-PCR. Euro Surveill. 2020;25(3) doi: 10.2807/1560-7917.ES.2020.25.3.2000045. [DOI] [PMC free article] [PubMed] [Google Scholar]
Associated Data
This section collects any data citations, data availability statements, or supplementary materials included in this article.