

Abstract
Background.
Fructose is distinct among common sugars in its ability to raise serum uric acid, and some studies suggest fructose-induced uric acid production may have a role in the ability of this sugar to induce metabolic syndrome. A fructose tolerance test has been previously developed to evaluate the relative ability of fructose to raise uric acid in individuals. However, the effect of fructose to raise uric acid in people with diabetes has not been studied.
Methods.
People with type 2 diabetes (n=143) and without diabetes controls (n=132) with similar body mass index (BMI) underwent an oral fructose tolerance test. As a comparison, participants also had their uric acid levels measured after an oral glucose tolerance test on a different day.
Results.
Serum uric acid was lower in people with type 2 diabetes compared to controls with similar degree of BMI, especially those with poor glucose control (HbA1C ≥ 8%). Fructose administration raised serum uric acid in both groups, with a lower absolute rise in people with diabetes. People with diabetes with a blunted rise in serum uric acid had higher baseline serum uric acid concentrations and higher BMI. People without diabetes with a higher BMI also showed a blunted serum uric acid response. Oral glucose administration lowered serum uric acid in both participants, with a greater fall in those with diabetes.
Conclusion.
Both the presence of diabetes and obesity blunt the serum uric acid response to fructose ingestion. These data demonstrate altered fructose-dependent urate metabolism in type 2 diabetes.
Keywords: ATP, Diabetes, Fructose, Obesity, Uric acid
Introduction
Serum uric acid is a risk factor for micro- and macrovascular complications in type 1 and type 2 diabetes.1–7 Lowering serum uric acid ameliorates renal disease in mice with type 2 diabetes.8 Pilot studies in humans suggest that lowering serum uric acid may be beneficial in people with diabetes those with kidney disease.9
Fructose, which is present in table sugar (sucrose) and high fructose corn syrup (HFCS), generates uric acid during its metabolism.10, 11 Indeed, an oral bolus of fructose will acutely raise serum uric acid in humans and has been developed as the oral fructose tolerance test (OFTT).12–15 For example, in hypertensive people, the administration of fructose results in an enhanced rise in serum uric acid compared to normal controls.15 Hyperinsulinemic men also show an enhanced response in serum uric acid to a diet high in fructose compared to controls.16
It is unknown how fructose administration affects serum uric acid concentrations in type 2 diabetes. Accordingly, the aim of this study was to examine the acute effects of oral fructose tolerance tests on serum uric acid concentrations in people with metabolic syndrome and type 2 diabetes. In addition, since fructose can be generated from glucose by the polyol pathway which is activated in type 2 diabetes,17 we also evaluated the effects of an oral glucose tolerance test on serum uric acid concentrations in people with type 2 diabetes. Our hypothesis were that ingestion of fructose would be associated with a greater rise in serum uric acid concentrations in people with type 2 diabetes compared to without diabetes peers of similar body mass index (BMI).
Materials and Methods
Patient population and eligibility criteria
One hundred and forty-three (143) people with type 2 diabetes and 132 without diabetes controls were recruited randomly through the Dasman Diabetes Institute in Kuwait City. Both groups were matched for age and Body Mass Index. All the participants were invited to participate in type 2 diabetes mellitus diagnosis was based on WHO clinical criteria. Informed consent was obtained from all participants and the study was approved by the local Institutional Review Board at the Dasman Institute. Male and female participants between 22 to 77 years of age with and without type 2 diabetes, who spoke Arabic or English and could conduct an interview with the dietician were eligible for inclusion. Exclusion criteria were history of cancer in the past 2 years, a blood pressure at screening ≥160/100 mm Hg or an eGFR less than 15 ml/min/1.73m2, treatment with uric acid lowering agents, or pregnancy. Subjects also met with a dietician who reviewed their diets and made general recommendations. If an individual did not agree to the overnight fast or to performing the fructose and glucose tolerance tests required for the study, they were also excluded.
Anthropometric measurements:
Participants’ weight (kg), height (measured to within 0.5cm) were taken by a trained nurse. BMI was calculated as weight/height2 (kg/m2) and used as an overall index of adiposity. Blood pressure was measured twice in the semi sitting position after being rested for 5 minutes.
Oral Fructose Tolerance Test (OFTT)
Participants were examined after an overnight fast. Each participant received a 75 g oral fructose and had serum samples collected at 60 minutes and 120 minutes for testing of serum uric acid and other laboratory parameters (glucose, LDL cholesterol, HDL cholesterol and VLDL cholesterol). Serum uric acid was measured by autoanalyzer (Siemens Dimension RXL Max), using the uricase method.
Oral Glucose Tolerance Test (OGTT)
On a separate day, at least one week apart, participants were fasted overnight and examined baseline blood glucose, uric acid level and other laboratory parameters. Subsequently received an oral glucose load (75 g) with the same sampling interval described for the OFTT. Oral hypoglycemic agents and insulin were held the day of study.
Statistical analyses
Data are presented as mean ± standard deviations (SD), unless otherwise specified. Physiological data were stratified by type 2 diabetes status. Comparative analysis of data obtained by OGTT and OFTT were performed using t-test for continuous outcomes and Chi Square tests of association for dichotomous outcomes. ANOVA (analysis of variance) were conducted when comparing baseline variables among quartiles of serum uric acid. Also, analysis of covariance (ANCOVA) were conducted to compared serum uric acid and glucose level after OGTT and OFTT, in which baseline value adjusted as covariant. Multinomial regression was used to adjust for potential confounding was conducted. A two-sided P< 0.05 was considered statistically significant. Data were analyzed with IBM SPSS Statistics Version 20.0.0 (IBM Corp., New York, NY, USA).
Results
Baseline characteristics of the study population
Baseline characteristics stratified by type 2 diabetes status are shown in Table 1. The number of male and female participants was similar in both diabetes and without diabetes groups. Both groups tended to be obese with no significant difference in mean BMI. People with type 2 diabetes had significantly higher systolic blood pressure and greater prevalence of hypertension, but lower HDL and LDL-cholesterol concentrations compared to people without diabetes. People with type 2 diabetes had lower serum uric acid concentrations compared to those without diabetes (Table 1). In people without diabetes, baseline serum uric acid levels correlated with features of metabolic syndrome. Specifically, hyperuricemia in people without diabetes was associated with higher prevalence of elevated VLDL, low HDL and elevated serum creatinine concentrations. The baseline serum uric acid and creatinine concentrations were significantly lower in people with type 2 diabetes with poor glycemic control (HbA1c ≥8%) compared to those with better glycemic control (Table 2).
Table 1:
Baseline characteristics of the participants.
| Baseline | Type 2 Diabetes | ||
|---|---|---|---|
| variables | No (n=132) | Yes (n=143) | p-value* |
| Age [Mean (range years)] | 41.12 (23–67) | 51.95 (22–77) | -- |
| Duration of diabetes (years) | -- | 1–30 | -- |
| Sex | n(%) | n(%) | |
| Male | 91(68.9) | 96(67.1) | 0.748 |
| Female | 41(31.1) | 47(32.9) | |
| Medicine use for glycemic control | |||
| Metformin | 119(83.2) | -- | |
| Insulin | 34(23.8) | -- | |
| Hypertension | |||
| Yes | 13(9.8) | 36(25.2) | 0.001 |
| No | 119(90.2) | 107(74.8) | |
| BMI | |||
| <25 | 28(21.2) | 30(21.0) | 0.25 |
| 25 -< 30 | 55(41.7) | 47(32.9) | |
| ≥30 | 49(37.1) | 66(46.2) | |
| mean (SD) | mean (SD) | ||
| BMI | 29.51(7.0) | 30.26 (5.8) | 0.335 |
| Hba1c (%) | 5.73(0.5) | 8.78(1.9) | <0.0001 |
| Creatinine (umol/L) | 80.72(18.0) | 81.87(26.0) | 0.674 |
| Urea (mmol/L) | 4.21(1.2) | 4.59(2.2) | 0.078 |
| G6PD (mU/RBC)) | 106.33(21.9) | 102.83(25.8) | 0.230 |
| SBP (mm Hg) | 119.87(12.4) | 126.85(14.7) | <0.0001 |
| DBP (mm Hg) | 72.59(10.1) | 74.50(10.1) | 0.118 |
| Baseline Serum uric acid (umol/L) | 317.64(74.7) | 291.46(75.3) | 0.004 |
| Baseline HDL (mmol/L) | 1.09(0.3) | 1.01(0.3) | 0.050 |
| Baseline LDL (mmol/L) | 3.51(0.9) | 3.12(1.0) | 0.001 |
| Baseline VLDL (mmol/L) | 0.64(0.4) | 0.79(0.6) | 0.029 |
Data shown as mean (SD) unless otherwise specified. BMI, Body mass index. G6PD, Glucose-6-phosphate dehydrogenase. SBP, Systolic blood pressure. DBP, Diastolic blood pressure
t-tests done for continuous variables and chi-squared tests done for categorical variables.
Table 2:
Baseline characteristics stratified by glycemic control in people with type 2 diabetes.
| Baseline | HbA1c ≥8 % | ||
|---|---|---|---|
| variables | No (n=51) | Yes (n=92) | p-value* |
| BMI (kg/m2) | 30.56(5.9) | 30.09(5.8) | 0.648 |
| Creatinine(umol/L) | 88.39(35.6) | 78.25(17.8) | 0.025 |
| SBP (mm Hg) | 124.39(15.6) | 128.21(14.1) | 0.138 |
| DBP (mm Hg) | 73.88(10.6) | 74.84(9.8) | 0.589 |
| Baseline Serum uric acid (umol/L) | 320.10(71.42) | 275.59(72.94) | 0.001 |
| Baseline HDL (mmol/L) | 1.10(0.3) | 0.96(0.3) | 0.009 |
| Baseline LDL (mmol/L) | 3.03(1.0) | 3.17(1.0) | 0.446 |
| Baseline VLDL (mmol/L) | 0.76(0.6) | 0.80(0.6) | 0.713 |
| Sex (n) | |||
| Male | 33(34.4%) | 63(65.6%) | 0.711 |
| Female | 18(38.3%) | 29(61.7%) | |
BMI, Body mass index. G6PD, Glucose-6-phosphate dehydrogenase. SBP, Systolic blood pressure. DBP, Diastolic blood pressure.
t-tests done for continuous variables and chi-squared tests done for categorical variables.
Relationship of risk factors to baseline serum uric acid quartiles
We further evaluated the relationship of serum uric acid quartiles to metabolic features in both participants with and without type 2 diabetes (Supplementary tables 1 and table 2). In people without diabetes, there was a direct relationship between serum uric acid with decreasing HDL cholesterol, increasing serum albumin and increasing serum creatinine concentrations (p< 0.05). Serum HbA1c also increased with each quartile of uric acid except for the highest uric acid quartile, (p= 0.05). In people with type 2 diabetes, serum creatinine and serum urea also increased stepwise with increasing serum uric acid. However, HbA1c increased stepwise with serum uric acid for the first two quartiles, but then HbA1c fell in the third, and especially the fourth quartile of uric acid (p= 0.003). However, no significant relationship was observed between serum uric acid and blood pressure, cholesterol (LDL and HDL) or albumin concentrations in the people with diabetes.
Fructose Tolerance Test (OFTT)
Figure 1A shows the change in blood glucose concentration in participants with and without type 2 diabetes, and Figure 1B shows the change in serum uric acid concentrations at the 60 and 120 minutes period. Serum uric acid level between people with and without type 2 diabetes was different at baseline, with lower levels in the diabetic subjects (p< 0.0001) (Supplementary Table 3). The administration of fructose resulted in a rise in serum uric acid at 60 and 120 minutes intervals in both groups. Interestingly, the rise in serum uric acid was blunted more in people with type 2 diabetes compared to their without diabetes counterparts. In people with type 2 diabetes with poorer glycemic control (HbA1c ≥8%, n=92), the mean serum uric acid concentration increased from 290.38 μM (baseline) to 340.90 μM (60 minutes) and 326.48 μM (120 minutes), and for those people with type 2 diabetes and better glycemic control (HbA1c < 8%), the mean serum uric acid concentration increased from 326.27 μM (baseline) to 373.82 μM (60 minutes) to 361.65 μM (120 minutes), suggesting a similar trend of change in serum uric acid in people with type 2 diabetes irrespective of glycemic control (Supplementary table 4). When stratifying participants into those whose serum uric acid increased by ≥30 μM (0.5 mg/dl) or not, the people with type 2 diabetes who had a lower rise in serum uric acid tended to have higher baseline serum uric acid concentrations and higher BMI (Supplementary table 5). By multivariable analysis the baseline BMI provided the strongest predictor of a blunted rise in serum uric acid in response to OFTT (OR 1.091, 95%CI 1.01–1.18, p= 0.008). Similarly, when subjects without diabetes were stratified into those with a blunted serum uric acid response (<30 μM) or not (≥30 μM), those with a blunted response had a greater BMI (Supplementary Table 6). Multivariable logistic regression analysis demonstrated a strong relationship between BMI and a blunted serum uric acid response to OFTT in people without diabetes (OR 1.167, 95%CI 1.05–1.24, p= 0.0001). These data provide novel evidence that both type 2 diabetes and obesity result in a blunted rise in serum uric acid response to fructose. In addition, the results demonstrated a significant correlation of uric acid level after 60 and 120 minutes of fructose administration with the concentration of baseline uric acid, creatinine and blood urea. However, no significant correlation was found based on age of diabetic subjects, diabetes duration, medication (metformin or insulin) and baseline albumin concentration (Supplementary table 7). When evaluated by gender, the male diabetes group exhibited a significant rise of serum uric acid from the base line (p= 0.004), however a blunted rise of uric acid was found in the female diabetes group in response to the OFTT (p= 0.697) (Supplementary table 8).
Figure 1A:
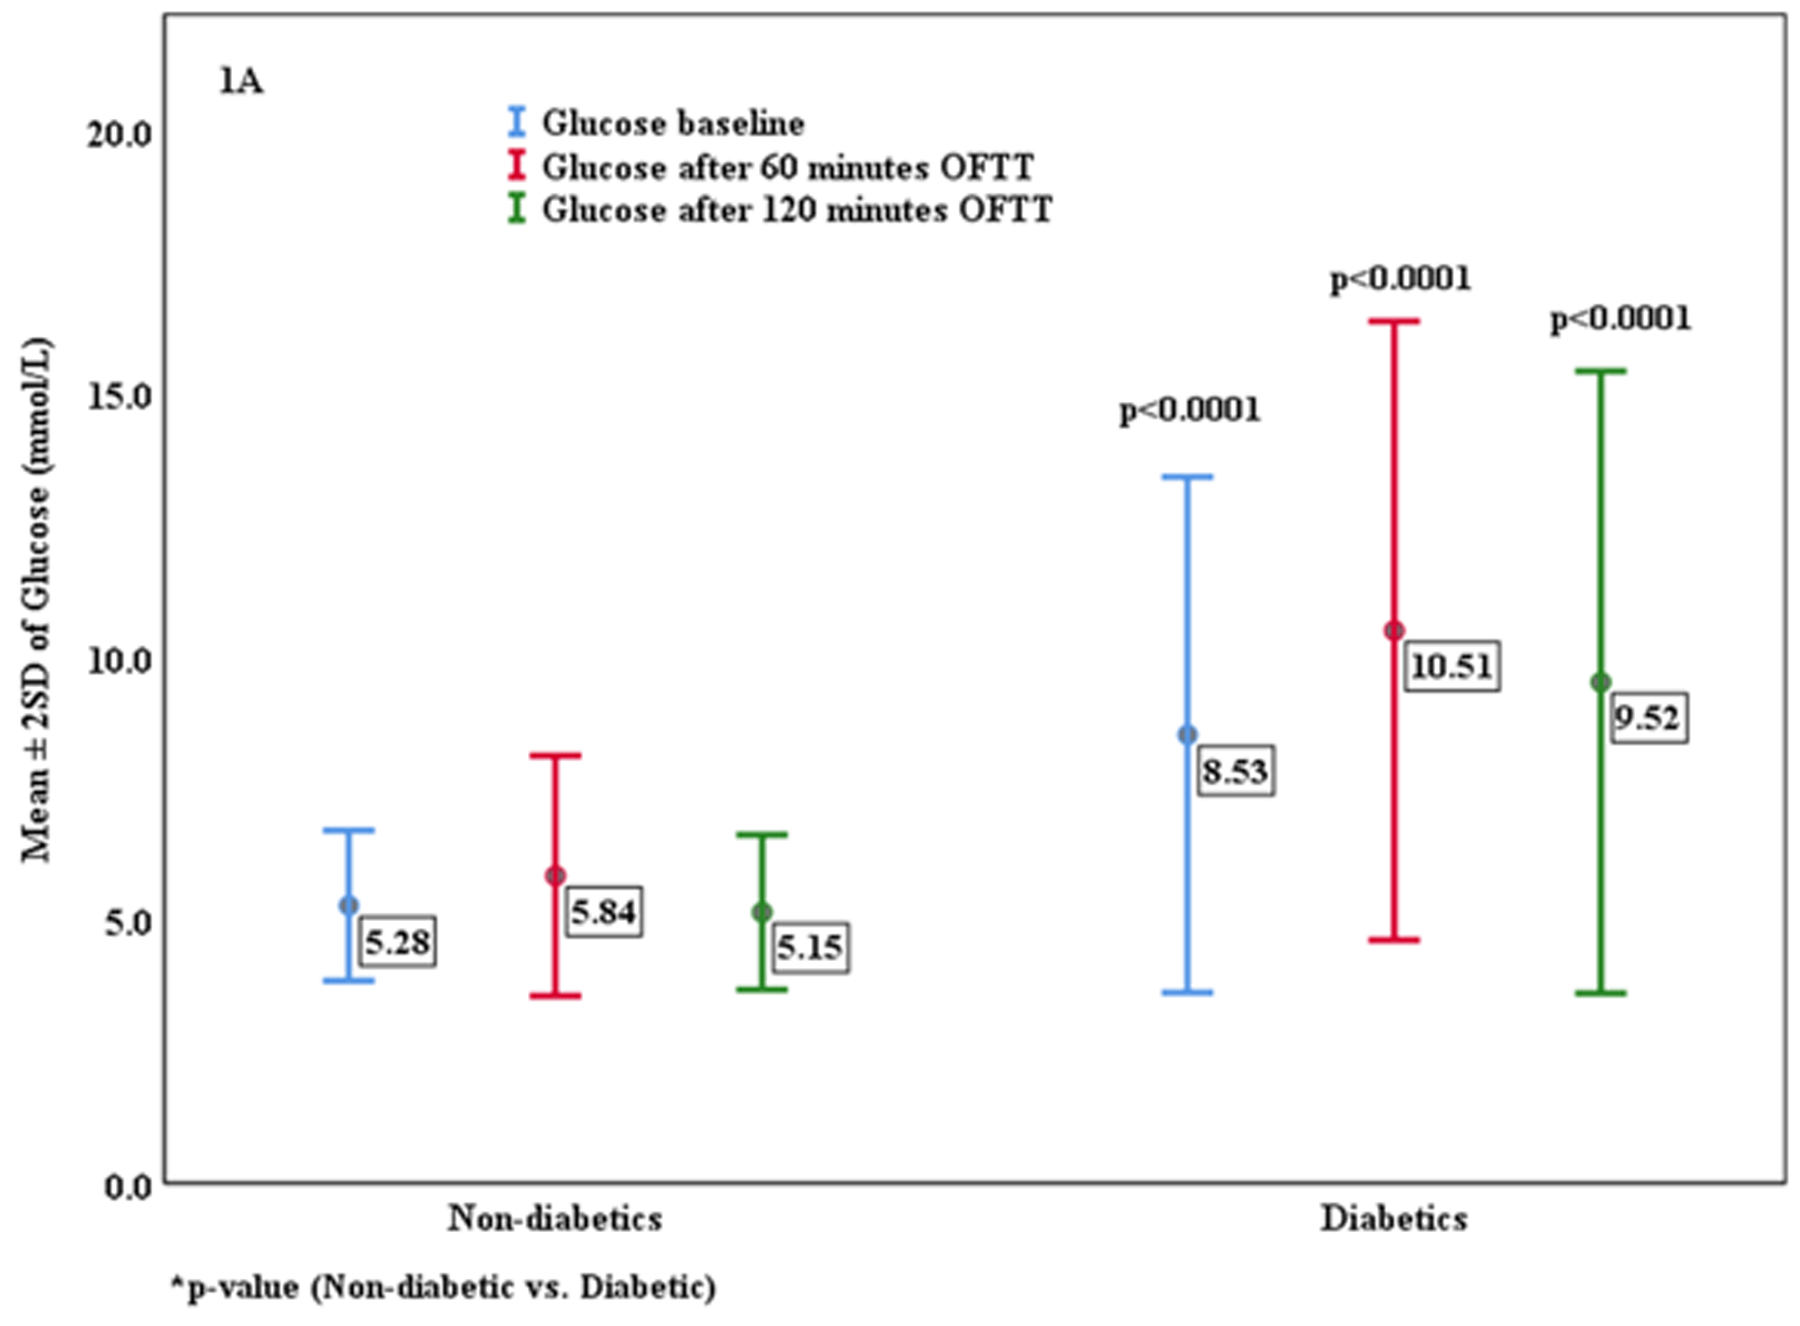
Change in Glucose concentration after Oral Fructose Tolerance Test (OFTT).
Figure 1B:

Change in Uric acid level after Oral Fructose Tolerance Test (OFTT).
Glucose Tolerance Test (OGTT)
Changes in serum glucose concentrations following OGTT for participants with and without type 2 diabetes are shown in Supplementary table 9. Serum uric acid concentrations fell slightly in both groups and fell significantly more in participants with type 2 diabetes. When people without diabetes were stratified into those whose serum uric acid concentrations fell by more than 5μM following the OGTT versus those whose serum uric acid either increased or fell less than 5 μM, no significant difference was in baseline serum uric acid concentrations (≤ 5 vs >5 μM groups: mean (SD) serum uric acid 310.99 (72.72) vs. 327.03 (74.075) μM, p= 0.213). When the analysis was stratified people with type 2 diabetes status, participants with type 2 diabetes who experienced a greater fall in serum uric acid following OGTT were those with the higher baseline serum uric acid (≤ 5 vs >5 μM groups: 274.11 (74.30) vs 306.91 (73.17) μM, p= 0.009). In contrast, the baseline serum uric acid concentrations did not predict the severity of fall of uric acid in those without type 2 diabetes (data not shown). These studies suggest that the primary predictor for severity of fall in serum uric acid concentration in participants with type 2 diabetes was baseline serum uric acid, with a higher baseline level predicting a greater fall in serum uric acid concentration in response to OGTT.
Discussion
There is increasing evidence that the fructose present in added sugars has an important contributory role in driving the development of metabolic syndrome and diabetes, and that this is due in part to the generation of uric acid.18 Numerous studies have reported that both sugar intake19, 20 and elevated serum uric acid18can predict the development of type 2 diabetes. Furthermore, experimental studies also have reported that fructose-induced uric acid generation may play a role in increasing blood pressure, inducing insulin resistance, and driving the development of fatty liver18, 21–23. However, unlike people with metabolic syndrome, in which serum uric acid is high, in people with type 1 diabetes serum uric acid tends to be low.24 Even less is known about serum uric acid and fructose metabolism in type 2 diabetes despite the potential importance of uric acid as a therapeutic target.
Here we evaluated the effect of fructose on serum uric acid in both people with type 2 diabetes and obese subjects without diabetes who acted as controls. We had several new findings. First, we found that people with type 2 diabetes had lower serum uric acid levels compared to people without diabetes, and this was especially evident in those with worse glycemic control. This is consistent with studies in type 1 diabetes in which higher glucose levels were associated with greater uricosuria and lower serum uric acid levels (Table 2).24 One potential mechanism may be due to renal hyperfiltration that occurs with poor glycemic control24, and which is consistent with our finding of lower serum creatinine concentrations in the participants with poorer glycemic control (Table 2).
One of the main aims of this study was to investigate the acute effects of fructose ingestion on serum uric acid in adults with type 2 diabetes. We had hypothesized that people with diabetes might show an enhanced rise in serum uric acid compared to people without diabetes, but the unexpected finding was that the fructose-induced rise in serum uric acid was lower in people with type 2 diabetes, and this blunted rise also correlated with the presence of obesity. Peoples with diabetes showing a blunted rise in serum uric acid had higher baseline serum uric acid concentrations and higher BMI levels. People without diabetes with higher BMI also showed a blunted rise in serum uric acid concentration following OFTT. The observation that the rise in uric acid is blunted in people with diabetes and/or obesity does not necessarily mean that lowering uric acid will not be of benefit in these people. Indeed, serum uric acid has been found to predict the development of diabetic nephropathy in people with type 2 diabetes25, and there is also preliminary studies that lowering uric acid can reduce proteinuria in people with type 2 diabetes26 and reduce kidney damage in type 2 diabetic mice8.
These studies provide the novel finding that obesity is associated with an impaired uric acid response to fructose. This at first seems paradoxical as children with obesity and non-alcoholic fatty liver disease (NAFLD) tend to show enhanced fructose absorption and metabolism.27 Indeed, liver biopsies from adults with NAFLD show higher levels of fructokinase, the enzyme involved in fructose metabolism.28 People with type 2 diabetes with NAFLD with high fructose intake also have lower hepatic ATP levels, also consistent with enhanced fructose metabolism.29 Indeed, a recent study using 31P magnetic resonance spectroscopy documented that hepatic ATP concentrations were lowest in participants with higher BMI following OFTT.30 These studies suggest that fructose metabolism is likely enhanced in people with obesity, diabetes and/or NAFLD.
There are two potential explanations for why the increase in serum uric acid was blunted. One possible explanation is that there is less uric acid generation because baseline hepatic ATP levels are already low in both people with diabetes31 and in those with obesity.32 In these participants, mitochondrial dysfunction is commonly evident.33, 34 Since uric acid is generated during ATP degradation, lower basal levels could lead to lower generation. Second, those with higher baseline uric acid levels may have lower xanthine oxidase levels, as uric acid can inhibit xanthine oxidase expression.35 This would be consistent with our finding that those with higher baseline uric acid levels showed a lower rise in uric acid compared to those with lower baseline uric acid.
The final novel finding was that the oral glucose tolerance test was associated with a fall in serum uric acid concentrations in both participants with and without type 2 diabetes, but the magnitude of the decline was greatest in those with a higher serum uric acid concentration. This likely relates to the effects of glucose to stimulate uricosuria.24 The mechanism is not well understood, but it may relate to effects of glucose on the proximal tubule.36An important aspect of our study is that we were evaluating the acute effects of fructose on serum uric acid in people with type 2 diabetes, and this may be distinct from the chronic effects of fructose. Indeed, while the acute effects of fructose on uric acid appear to be mediated by fructose-dependent adenine nucleotide turnover37 fructose can also stimulate the synthesis of uric acid which could potentially be more important with long-term ingestion38.
In conclusion, we found that both people with type 2 diabetes and obesity show a blunted rise in serum uric acid concentration in response to a fructose challenge despite evidence that fructose may be undergoing enhanced metabolism in these conditions. These data document a previously unrecognized alteration in fructose-uric acid metabolism in people with type 2 diabetes. Also, this study proved the metabolic change during 2-hour after the fructose ingestion. Therefore, further research on the long-term relationship of glucose and fructose ingestion on uric acid metabolism in type 2 diabetes is needed.
Supplementary Material
Highlights.
Fructose raises uric acid but the effect in diabetes is not known; people with type 2 diabetes have a lower baseline uric acid than people without diabetes.
Fructose loading leads to a blunted uric acid rise in people with type 2 diabetes; this effect is greater in obese people and those with poor glucose control.
In contrast, glucose loading causes a fall in uric acid that is greater in diabetes and thus, people with diabetes have a different handling of uric acid than people without diabetes.
Acknowledgments:
We would like to thank all the participants for giving up their time to participate in this study. The authors wish to thank Dr Mohammad Irshad for technical support in data analysis and revision of this manuscript. The authors gratefully acknowledge the clinical service unit at Dasman Diabetes Institute. This study was supported by research funds from the Kuwait Foundation for the Advancement of Sciences (KFAS) via Dasman Diabetes Institute (DDI).
Footnotes
Disclosure:
MAL, LGL, CJR and RJJ are members of Colorado Research Partners LLC which is developing inhibitors of fructose metabolism for the treatment of metabolic diseases. LGL and RJJ are also inventors on several patent applications related to fructose metabolism and metabolic disorders. RJJ also has equity with XORT therapeutics and has several patents and patent applications related to lowering uric acid in hypertension and metabolic diseases.
References
- 1.Zoppini G, Targher G, Chonchol M, et al. Serum uric acid levels and incident chronic kidney disease in patients with type 2 diabetes and preserved kidney function. Diabetes Care. 2012; 35: 99–104. [DOI] [PMC free article] [PubMed] [Google Scholar]
- 2.Altemtam N, Russell J, El Nahas M. A study of the natural history of diabetic kidney disease (DKD). Nephrol Dial Transplant. 2012; 27: 1847–1854. [DOI] [PubMed] [Google Scholar]
- 3.Miao Y, Ottenbros SA, Laverman GD, et al. Effect of a reduction in uric acid on renal outcomes during losartan treatment: a post hoc analysis of the reduction of endpoints in non-insulin-dependent diabetes mellitus with the Angiotensin II Antagonist Losartan Trial. Hypertension. 2011; 58: 2–7. [DOI] [PubMed] [Google Scholar]
- 4.Ficociello LH, Rosolowsky ET, Niewczas MA, et al. High-normal serum uric acid increases risk of early progressive renal function loss in type 1 diabetes: results of a 6-year follow-up. Diabetes Care. 2010; 33: 1337–1343. [DOI] [PMC free article] [PubMed] [Google Scholar]
- 5.Hovind P, Rossing P, Tarnow L, et al. Serum uric acid as a predictor for development of diabetic nephropathy in type 1 diabetes: an inception cohort study. Diabetes. 2009; 58: 1668–1671. [DOI] [PMC free article] [PubMed] [Google Scholar]
- 6.Jalal DI, Rivard CJ, Johnson RJ, et al. Serum uric acid levels predict the development of albuminuria over 6 years in patients with type 1 diabetes: findings from the Coronary Artery Calcification in Type 1 Diabetes study. Nephrol Dial Transplant. 2010; 25: 1865–1869. [DOI] [PMC free article] [PubMed] [Google Scholar]
- 7.Bjornstad P, Maahs DM, Rivard CJ, et al. Serum uric acid predicts vascular complications in adults with type 1 diabetes: the coronary artery calcification in type 1 diabetes study. Acta Diabetol. 2014; 51:783–791. [DOI] [PMC free article] [PubMed] [Google Scholar]
- 8.Kosugi T, Nakayama T, Heinig M, et al. Effect of lowering uric acid on renal disease in the type 2 diabetic db/db mice. Am J Physiol Renal Physiol. 2009; 297: F481–488. [DOI] [PMC free article] [PubMed] [Google Scholar]
- 9.Liu P, Chen Y, Wang B, et al. Allopurinol treatment improves renal function in patients with type 2 diabetes and asymptomatic hyperuricemia: 3-year randomized parallel-controlled study. Clin Endocrinol (Oxf). 2015; 83: 475–482. [DOI] [PubMed] [Google Scholar]
- 10.Maenpaa PH, Raivio KO, Kekomaki MP. Liver adenine nucleotides: fructose-induced depletion and its effect on protein synthesis. Science. 1968; 161: 1253–1254. [DOI] [PubMed] [Google Scholar]
- 11.Morris RC Jr., Nigon K, Reed EB. Evidence that the severity of depletion of inorganic phosphate determines the severity of the disturbance of adenine nucleotide metabolism in the liver and renal cortex of the fructose-loaded rat. J Clin Invest. 1978; 61: 209–220. [DOI] [PMC free article] [PubMed] [Google Scholar]
- 12.Perheentupa J, Raivio K. Fructose-induced hyperuricaemia. Lancet. 1967; 2: 528–531. [DOI] [PubMed] [Google Scholar]
- 13.Stirpe F, Della Corte E, Bonetti E, et al. Fructose-induced hyperuricaemia. Lancet. 1970; 2: 1310–1311. [DOI] [PubMed] [Google Scholar]
- 14.Heuckenkamp PU, Zollner N. Fructose-induced hyperuricaemia. Lancet. 1971; 1: 808–809. [DOI] [PubMed] [Google Scholar]
- 15.Fiaschi E, Baggio B, Favaro S, et al. Fructose-induced hyperuricemia in essential hypertension. Metabolism. 1977; 26: 1219–1223. [DOI] [PubMed] [Google Scholar]
- 16.Hallfrisch J, Ellwood K, Michaelis OEt et al. Plasma fructose, uric acid, and inorganic phosphorus responses of hyperinsulinemic men fed fructose. J Am Coll Nutr. 1986; 5: 61–68. [DOI] [PubMed] [Google Scholar]
- 17.Harrison HE, Stribling D, Armstrong FM, et al. Aldose reductase in the etiology of diabetic complications: I. Introduction. J Diabet Complications. 1989; 3: 6–11. [DOI] [PubMed] [Google Scholar]
- 18.Johnson RJ, Nakagawa T, Sanchez-Lozada LG, et al. Sugar, uric acid, and the etiology of diabetes and obesity. Diabetes. 2013; 62: 3307–3315. [DOI] [PMC free article] [PubMed] [Google Scholar]
- 19.Hu FB, Malik VS. Sugar-sweetened beverages and risk of obesity and type 2 diabetes: epidemiologic evidence. Physiol Behav. 2010; 100: 47–54. [DOI] [PMC free article] [PubMed] [Google Scholar]
- 20.Malik VS, Popkin BM, Bray GA, et al. Sugar-sweetened beverages, obesity, type 2 diabetes mellitus, and cardiovascular disease risk. Circulation. 2010; 121: 1356–1364. [DOI] [PMC free article] [PubMed] [Google Scholar]
- 21.Nakagawa T, Hu H, Zharikov S, et al. A causal role for uric acid in fructose-induced metabolic syndrome. Am J Physiol Renal Physiol. 2006; 290: F625–631. [DOI] [PubMed] [Google Scholar]
- 22.Lanaspa MA, Sanchez-Lozada LG, Choi YJ, et al. Uric acid induces hepatic steatosis by generation of mitochondrial oxidative stress: potential role in fructose-dependent and -independent fatty liver. J Biol Chem. 2012; 287: 40732–40744. [DOI] [PMC free article] [PubMed] [Google Scholar]
- 23.Cicerchi C, Li N, Kratzer J, et al. Uric acid-dependent inhibition of AMP kinase induces hepatic glucose production in diabetes and starvation: evolutionary implications of the uricase loss in hominids. FASEB J. 2014; 28: 3339–3350. [DOI] [PMC free article] [PubMed] [Google Scholar]
- 24.Lytvyn Y, Skrtic M, Yang GK, et al. Glycosuria-mediated urinary uric acid excretion in patients with uncomplicated type 1 diabetes mellitus. Am J Physiol Renal Physiol. 2015; 308: F77–83. [DOI] [PubMed] [Google Scholar]
- 25.De Cosmo S, Viazzi F, Pacilli A, et al. Serum Uric Acid and Risk of CKD in Type 2 Diabetes. Clin J Am Soc Nephrol. 2015; 10: 1921–1929. [DOI] [PMC free article] [PubMed] [Google Scholar]
- 26.Momeni A, Shahidi S, Seirafian S, et al. Effect of allopurinol in decreasing proteinuria in type 2 diabetic patients. Iran J Kidney Dis. 2010; 4: 128–132. [PubMed] [Google Scholar]
- 27.Sullivan JS, Le MT, Pan Z, et al. Oral fructose absorption in obese children with non-alcoholic fatty liver disease. Pediatr Obes. 2015; 10: 188–195. [DOI] [PMC free article] [PubMed] [Google Scholar]
- 28.Ouyang X, Cirillo P, Sautin Y, et al. Fructose consumption as a risk factor for non-alcoholic fatty liver disease. J Hepatol. 2008; 48: 993–999. [DOI] [PMC free article] [PubMed] [Google Scholar]
- 29.Abdelmalek MF, Lazo M, Horska A, et al. Higher dietary fructose is associated with impaired hepatic adenosine triphosphate homeostasis in obese individuals with type 2 diabetes. Hepatology. 2012; 56: 952–960. [DOI] [PMC free article] [PubMed] [Google Scholar]
- 30.Bawden SJ, Stephenson MC, Ciampi E, et al. Investigating the effects of an oral fructose challenge on hepatic ATP reserves in healthy volunteers: A P MRS study. Clinical nutrition. 2015; 35: 645–649. [DOI] [PubMed] [Google Scholar]
- 31.Szendroedi J, Chmelik M, Schmid AI, et al. Abnormal hepatic energy homeostasis in type 2 diabetes. Hepatology. 2009; 50: 1079–1086. [DOI] [PubMed] [Google Scholar]
- 32.Nair S, V PC, Arnold C, et al. Hepatic ATP reserve and efficiency of replenishing: comparison between obese and nonobese normal individuals. Am J Gastroenterol. 2003; 98: 466–470. [DOI] [PubMed] [Google Scholar]
- 33.Brownlee M The pathobiology of diabetic complications: a unifying mechanism. Diabetes. 2005; 54: 1615–1625. [DOI] [PubMed] [Google Scholar]
- 34.Gerbitz KD, Gempel K, Brdiczka D. Mitochondria and diabetes. Genetic, biochemical, and clinical implications of the cellular energy circuit. Diabetes. 1996; 45: 113–126. [DOI] [PubMed] [Google Scholar]
- 35.Kela U, Vijayvargiya R, Trivedi CP. Inhibitory effects of methylxanthines on the activity of xanthine oxidase. Life Sci. 1980; 27: 2109–2119. [DOI] [PubMed] [Google Scholar]
- 36.Bjornstad P, Lanaspa MA, Ishimoto T, et al. Fructose and uric acid in diabetic nephropathy. Diabetologia. 2015; 58: 1993–2002. [DOI] [PMC free article] [PubMed] [Google Scholar]
- 37.Smith CM, Rovamo LM, Raivio KO. Fructose-induced adenine nucleotide catabolism in isolated rat hepatocytes. Can J Biochem. 1977; 55: 1237–1240. [DOI] [PubMed] [Google Scholar]
- 38.Emmerson BT. Effect of oral fructose on urate production. Ann Rheum Dis. 1974; 33: 276–280. [DOI] [PMC free article] [PubMed] [Google Scholar]
Associated Data
This section collects any data citations, data availability statements, or supplementary materials included in this article.