

Abstract
Background
Operations on structures in the chest (usually the lungs) involve cutting between the ribs (thoracotomy). Severe post‐thoracotomy pain can result from pleural (lung lining) and muscular damage, costovertebral joint (ribcage) disruption and intercostal nerve (nerves that run along the ribs) damage during surgery. Poor pain relief after surgery can impede recovery and increase the risks of developing complications such as lung collapse, chest infections and blood clots due to ineffective breathing and clearing of secretions. Effective management of acute pain following thoracotomy may prevent these complications and reduce the likelihood of developing chronic pain. A multi‐modal approach to analgesia is widely employed by thoracic anaesthetists using a combination of regional anaesthetic blockade and systemic analgesia, with both non‐opioid and opioid medications and local anaesthesia blockade.
There is some evidence that blocking the nerves as they emerge from the spinal column (paravertebral block, PVB) may be associated with a lower risk of major complications in thoracic surgery but the majority of thoracic anaesthetists still prefer to use a thoracic epidural blockade (TEB) as analgesia for their patients undergoing thoracotomy. In order to bring about a change in practice, anaesthetists need a review that evaluates the risk of all major complications associated with thoracic epidural and paravertebral block in thoracotomy.
Objectives
To compare the two regional techniques of TEB and PVB in adults undergoing elective thoracotomy with respect to:
1. analgesic efficacy; 2. the incidence of major complications (including mortality); 3. the incidence of minor complications; 4. length of hospital stay; 5. cost effectiveness.
Search methods
We searched for studies in the Cochrane Central Register of Controlled Trials (CENTRAL 2013, Issue 9); MEDLINE via Ovid (1966 to 16 October 2013); EMBASE via Ovid (1980 to 16 October 2013); CINAHL via EBSCO host (1982 to 16 October 2013); and reference lists of retrieved studies. We handsearched the Journal of Cardiothoracic Surgery and Journal of Cardiothoracic and Vascular Anesthesia (16 October 2013). We reran the search on 31st January 2015. We found one additional study which is awaiting classification and will be addressed when we update the review.
Selection criteria
We included all randomized controlled trials (RCTs) comparing PVB with TEB in thoracotomy, including upper gastrointestinal surgery.
Data collection and analysis
We used standard methodological procedures expected by Cochrane. Two review authors (JY and SG) independently assessed the studies for inclusion and then extracted data as eligible for inclusion in qualitative and quantitative synthesis (meta‐analysis).
Main results
We included 14 studies with a total of 698 participants undergoing thoracotomy. There are two studies awaiting classification. The studies demonstrated high heterogeneity in insertion and use of both regional techniques, reflecting real‐world differences in the anaesthesia techniques. Overall, the included studies have a moderate to high potential for bias, lacking details of randomization, group allocation concealment or arrangements to blind participants or outcome assessors. There was low to very low‐quality evidence that showed no significant difference in 30‐day mortality (2 studies, 125 participants. risk ratio (RR) 1.28, 95% confidence interval (CI) 0.39 to 4.23, P value = 0.68) and major complications (cardiovascular: 2 studies, 114 participants. Hypotension RR 0.30, 95% CI 0.01 to 6.62, P value = 0.45; arrhythmias RR 0.36, 95% CI 0.04 to 3.29, P value = 0.36, myocardial infarction RR 3.19, 95% CI 0.13, 76.42, P value = 0.47); respiratory: 5 studies, 280 participants. RR 0.62, 95% CI 0.26 to 1.52, P value = 0.30). There was moderate‐quality evidence that showed comparable analgesic efficacy across all time points both at rest and after coughing or physiotherapy (14 studies, 698 participants). There was moderate‐quality evidence that showed PVB had a better minor complication profile than TEB including hypotension (8 studies, 445 participants. RR 0.16, 95% CI 0.07 to 0.38, P value < 0.0001), nausea and vomiting (6 studies, 345 participants. RR 0.48, 95% CI 0.30 to 0.75, P value = 0.001), pruritis (5 studies, 249 participants. RR 0.29, 95% CI 0.14 to 0.59, P value = 0.0005) and urinary retention (5 studies, 258 participants. RR 0.22, 95% CI 0.11 to 0.46, P value < 0.0001). There was insufficient data in chronic pain (six or 12 months). There was no difference found in and length of hospital stay (3 studies, 124 participants). We found no studies that reported costs.
Authors' conclusions
Paravertebral blockade reduced the risks of developing minor complications compared to thoracic epidural blockade. Paravertebral blockade was as effective as thoracic epidural blockade in controlling acute pain. There was a lack of evidence in other outcomes. There was no difference in 30‐day mortality, major complications, or length of hospital stay. There was insufficient data on chronic pain and costs. Results from this review should be interpreted with caution due to the heterogeneity of the included studies and the lack of reliable evidence. Future studies in this area need well‐conducted, adequately‐powered RCTs that focus not only on acute pain but also on major complications, chronic pain, length of stay and costs.
Keywords: Humans; Acute Pain; Acute Pain/prevention & control; Anesthesia, Epidural; Anesthesia, Epidural/adverse effects; Anesthesia, Epidural/methods; Anesthesia, Epidural/mortality; Delirium; Delirium/etiology; Hypotension; Hypotension/etiology; Length of Stay; Lung Diseases; Lung Diseases/etiology; Nerve Block; Nerve Block/adverse effects; Nerve Block/methods; Nerve Block/mortality; Pain, Postoperative; Pain, Postoperative/prevention & control; Randomized Controlled Trials as Topic; Thoracotomy; Thoracotomy/adverse effects; Thoracotomy/mortality
Plain language summary
Paravertebral block versus thoracic epidural for patients undergoing thoracotomy
Review question
We reviewed the evidence about the effect of paravertebral block and thoracic epidural for patients undergoing thoracotomy. We found 14 studies.
Background
Operations on structures in the chest (usually the lungs) involve cutting between the ribs (thoracotomy) resulting in severe pain. Poor pain relief post‐surgery can slow down recovery and increase risks of developing complications. Effective management of acute pain following thoracotomy may prevent these complications and reduce the likelihood of developing long‐term pain. We wanted to discover whether blocking the nerves as they emerge from the spinal column (paravertebral block, (PVB)) was better or worse than using central neuraxial nerve block (thoracic epidural block, (TEB)).
This evidence is current to 16th October 2013. We reran the search on 31st January 2015. We found one additional study which is awaiting classification and which we will include when we update the review.
Study characteristics
We found 14 studies involving 698 participants. Whilst all 14 studies compared broadly the analgesic efficacy of PVB and TEB in participants undergoing open thoracotomy, there were significant differences in the timing, method of insertion and medications used in PVB and TEB. This makes direct comparison difficult. Patient follow‐up was limited to the immediate post‐surgery period (up to five days post‐surgery) with only two studies reporting long‐term outcomes such as chronic pain. There are two studies awaiting classification.
Key results
We found no difference between PVB and TEB in terms of death at 30 days and major complications. PVB appeared to be as effective as TEB in pain control post‐surgery. TEB was associated with minor complications such as low blood pressure, nausea and vomiting, itching and urinary retention when compared to PVB. We did not find any difference in length of hospital stay between PVB and TEB. There was insufficient information to assess chronic pain and health costs.
Quality of evidence
We found low‐quality evidence for death at 30 days, with limited information provided by only two studies reporting this outcome. We only found low to very low‐quality evidence for major complications due to lack of information, with only one study reporting these outcomes. We found moderate‐quality evidence for acute pain control in the immediate postoperative period. We found moderate‐quality evidence for minor complications.
Summary of findings
Summary of findings for the main comparison. Paravertebral blockade compared to thoracic epidural blockade for patients undergoing thoracotomy (30‐day mortality and major complications).
| Paravertebral blockade compared to thoracic epidural blockade for patients undergoing thoracotomy (30‐day mortality and major complications) | ||||||
| Patient or population: Patients undergoing thoracotomy Setting: In hospitals, worldwide Intervention: Paravertebral blockade Comparison: Thoracic epidural blockade | ||||||
| Outcomes | Anticipated absolute effects* (95% CI) | Relative effect (95% CI) | № of participants (studies) | Quality of the evidence (GRADE) | Comments | |
| Risk with PVB | Risk with TEB | |||||
| 30‐day mortality | Study population | RR 1.28 (0.39 to 4.24) | 125 (2 RCTs) | ⨁⨁◯◯ LOW 1 | Only 2 studies reported number of participants that died within 30 days | |
| 63 per 1000 | 80 per 1000 (24 to 265) | |||||
| Low | ||||||
| 64 per 1000 | 82 per 1000 (25 to 271) | |||||
| Cardiovascular complications | Study population | Hypotension requiring inotropes RR 0.30
(0.01 to 6.62) Arrhythmias RR 0.36 (0.04, 3.29) Myocardial Infarction RR 3.19 (0.13, 76.42) |
114 (2 RCTs) | ⨁⨁◯◯ LOW 1 | Only 2 studies reported number of participants with major cardiovascular complications | |
| 37 per 1000 | 22 per 1000 (4 to 105) | |||||
| Moderate | ||||||
| 111 per 1000 | 64 per 1000 (13 to 311) | |||||
| Respiratory complications | Study population | RR 0.62 (0.26 to 1.52) | 280 (5 RCTs) | ⨁⨁◯◯ LOW 3 | All respiratory outcomes combined | |
| 134 per 1000 | 83 per 1000 (35 to 204) | |||||
| Moderate | ||||||
| 163 per 1000 | 101 per 1000 (42 to 248) | |||||
| Neurological complication (Delirium) | Study population | RR 0.30 (0.09 to 0.99) | 125 (2 RCTs) | ⨁⨁⨁◯ MODERATE 1 3 | Definition of delirium unclear | |
| 156 per 1000 | 47 per 1000 (14 to 155) | |||||
| Moderate | ||||||
| 264 per 1000 | 79 per 1000 (24 to 261) | |||||
| *The risk in the intervention group (and its 95% confidence interval) is based on the assumed risk in the comparison group and the relative effect of the intervention (and its 95% CI). CI: Confidence interval; RR: Risk ratio | ||||||
| GRADE Working Group grades of evidence High quality: We are very confident that the true effect lies close to that of the estimate of the effect Moderate quality: We are moderately confident in the effect estimate: The true effect is likely to be close to the estimate of the effect, but there is a possibility that it is substantially different Low quality: Our confidence in the effect estimate is limited: The true effect may be substantially different from the estimate of the effect Very low quality: We have very little confidence in the effect estimate: The true effect is likely to be substantially different from the estimate of effect | ||||||
1Only two studies reported outcome. Downgraded for small number of events, insufficient data available and for imprecision.
2Only one study reported outcome. Downgraded for small numbers of events, insufficient data available and for imprecision.
3Downgraded for lack of definition of delirium
Summary of findings 2. Paravertebral blockade compared to thoracic epidural blockade for patients undergoing thoracotomy (acute pain).
| Paravertebral blockade compared to thoracic epidural blockade for patients undergoing thoracotomy (acute pain) | ||||||
| Patient or population: Patients undergoing thoracotomy Settings: In hospitals, worldwide Intervention: Paravertebral blockade Comparison: thoracic epidural blockade | ||||||
| Outcomes | Illustrative comparative risks* (95% CI) | Relative effect (95% CI) | No of Participants (studies) | Quality of the evidence (GRADE) | Comments | |
| Assumed risk | Corresponding risk | |||||
| Thoracic epidural blockade (TEB) | Paravertebral blockade (PVB) | |||||
|
VAS score at 2 ‐ 6 hours (at rest) Score from 0 ‐ 10 |
The mean VAS score ranged across TEB groups from 1.0 to 3.4 | The SMD VAS score at 2 ‐ 6 hours (at rest) in the PVB groups was 0.32 higher | 0.30 lower to 0.94 higher | 239 (6 studies) | ⊕⊕⊕⊝ moderate1 | Lower VAS score represents less pain and better pain control |
|
VAS score at 2 ‐ 6 hours (on coughing/after physiotherapy) Score from 0 ‐ 10 |
The mean VAS score ranged across TEB groups from 2.2 to 3.4 | The SMD VAS score at 2 ‐ 6 hours (on coughing/after physiotherapy) in the PVB groups was 0.41 higher | 0.20 lower to 1.03 higher | 126 (3 studies) | ⊕⊕⊕⊝ moderate1 | Lower VAS score represent less pain and better pain control |
|
VAS score at 24 hours (at rest) Score from 0 ‐ 10 |
The mean VAS score ranged across TEB groups from 1.0 to 3.0 | The SMD VAS score at 24hours (at rest) in the PVB groups was 0.16 higher | 0.17 lower to 0.48 higher | 239 (6 studies) | ⊕⊕⊕⊝ moderate1 | Lower VAS score represent less pain and better pain control |
|
VAS score at 24 hours (on coughing/after physiotherapy) Score from 0 ‐ 10 |
The mean VAS score ranged across TEB groups from 2.6 to 3.7 | The SMD VAS score at 24 hours (on coughing/after physiotherapy) in the PVB groups was 0.23 lower | 0.58 lower to 0.12 higher | 126 (3 studies) | ⊕⊕⊕⊝ moderate1 | Lower VAS score represent less pain and better pain control |
|
VAS scores at 48 hours (at rest) Score from 0 ‐ 10 |
The mean VAS score ranged across TEB groups from 1.3 to 3.5 | The SMD VAS scores at 48 hours (at rest) in the PVB groups was 0.12 lower | 0.46 lower to 0.22 higher | 220 (5 studies) | ⊕⊕⊕⊝ moderate1 | Lower VAS score represent less pain and better pain control |
|
VAS scores at 48 hours (on coughing/after physiotherapy) Score from 0 ‐ 10 |
The mean VAS score ranged across TEB groups from 2.1 to 3.6 | The SMD VAS scores at 48 hours (on coughing/after physiotherapy) in the PVB groups was 0.25 higher | 0.16 lower to 0.66 higher | 126 (3 studies) | ⊕⊕⊕⊝ moderate1 | Lower VAS score represent less pain and better pain control |
|
Failure of technique (Number of participants) |
Study population | RR 0.27 (0.09 to 0.86) | 199 (4 studies) | ⊕⊕⊕⊝ moderate1 | Lower failure technique indicates more blocks inserted successfully. | |
| 112 per 1000 | 30 per 1000 (10 to 97) | |||||
| Moderate | ||||||
| 119 per 1000 | 32 per 1000 (11 to 102) | |||||
| *The basis for the assumed risk (e.g. the median control group risk across studies) is provided in footnotes. The corresponding risk (and its 95% confidence interval) is based on the assumed risk in the comparison group and the relative effect of the intervention (and its 95% CI). CI: Confidence interval; RR: Risk ratio; SMD: Standardized mean difference | ||||||
| GRADE Working Group grades of evidence High quality: Further research is very unlikely to change our confidence in the estimate of effect. Moderate quality: Further research is likely to have an important impact on our confidence in the estimate of effect and may change the estimate. Low quality: Further research is very likely to have an important impact on our confidence in the estimate of effect and is likely to change the estimate. Very low quality: We are very uncertain about the estimate. | ||||||
1Studies downgraded due to performance and detection bias.
Background
Description of the condition
Operations on structures in the chest (usually the lungs) involve cutting between the ribs (thoracotomy). Post‐thoracotomy pain results from pleural (lung lining) and muscular damage, costovertebral joint (ribcage) disruption and intercostal nerve (nerves that run along the ribs) damage during surgery (Ng 2007). It is one of the most severe types of postoperative pain. Poor pain relief can lead to immobility and ineffective breathing and clearing of secretions, resulting in susceptibility to lung collapse (atelectasis), chest infections (pneumonia) and blood clots (pulmonary embolism) (Richardson 1994). The risk of respiratory complications has been reported to be between 15% and 32.5% (D'Arsigny 1998; Wang 1999) and has been observed to account for more than half of the 30‐day mortality after surgery to remove a lung (Powell 2009). In the same observational study, cardiac arrhythmias were reported in 20% of patients (Powell 2009). Pain relief after thoracic surgery is therefore important for patient comfort and for reduction of postoperative pulmonary and cardiac complications.
Pain can often persist after thoracotomy and the incidence of chronic pain is high, with studies revealing that 30% to 50% of patients still experience pain up to five years after surgery (De Cosmo 2009; Rogers 2000). The exact mechanism of chronic post‐thoracotomy pain is unknown but intercostal nerve damage at thoracotomy is believed to be a major factor, as demonstrated by neurophysiological studies (Benedetti 1998). Electromyography and somatosensory evoked responses demonstrated that intercostal nerve damage led to a decreased pain threshold of the operative scar. A 'wind up' phenomenon of repeated stimulation of peripheral nerve fibres can cause a wide range of nerve fibres to become hyperexcitable and is associated with chronic pain. Aggressive management of acute pain following thoracotomy may reduce the likelihood of developing chronic pain (Katz 1996). A multi‐modal approach to analgesia is widely employed by thoracic anaesthetists using a combination of regional anaesthetic blockade and systemic analgesia, with both non‐opioid and opioid medications and local anaesthesia blockade.
There is some evidence that blocking the nerves as they emerge from the spinal column (paravertebral block) may be associated with a lower risk of major complications in thoracic surgery but the majority of thoracic anaesthetists still prefer to use a thoracic epidural as analgesia for their patients undergoing thoracotomy. Previous systematic reviews of analgesic techniques in thoracic surgery have only evaluated short‐term complications (Davies 2006; Joshi 2008; Kotze 2009). In order to bring about a change in practice, anaesthetists need a review that evaluates the risk of all major complications associated with thoracic epidural and paravertebral block in thoracotomy.
Description of the intervention
Thoracic epidural blockade
Thoracic epidural blockade (TEB) using local anaesthetic and opioid agents has been widely regarded as the gold standard for analgesia and the reduction of associated complications following thoracotomy. Good analgesia from an epidural can result in early extubation, better ventilatory mechanics and gas exchange and reduced rates of lung collapse, pneumonia and pain (De Cosmo 2009). However, the technique requires highly trained medical staff not only for insertion and removal of the epidural catheter but also for the management of the continuous infusion of pain medication. The risks associated with insertion of the epidural include accidental dural puncture, inadvertent high block, local anaesthetic toxicity and total spinal anaesthesia (inadvertent spinal injection of an epidural dose of local anaesthetic leading to local anaesthetic depression of the cervical spinal cord and the brainstem). Nerve injury, epidural haematoma and abscess are rare but serious complications. The UK National Audit Project led by the Royal College of Anaesthetists reported a low rate of permanent harm from all central blocks of 4.2 per 100,000, with rates twice as high in epidurals compared with other central neuraxial blocks (Cook 2009). A thoracic epidural blocks nerves bilaterally and sympathetic nerve block can result in hypotension due to both vasodilatation and cardiac depression. This requires cautious fluid administration in order to avoid fluid overload in susceptible patients (Marret 2005). Failure rates have been described as from 14% to 30% and can be influenced by the skills of the practitioner inserting the catheter and accidental dislodgement of the catheter (Davies 2006).
An epidural is not a suitable technique for all patients and is contraindicated in patients with local infection, previous spinal surgery, disorders of blood clotting and in those taking anti‐coagulant and anti‐platelet therapy. The epidural is inserted through the skin rather than placed under vision and requires a highly skilled practitioner to perform the technique. Trained staff are also needed to look after the patients postoperatively in order to avoid accidental dislodgement of catheters and to observe for side effects. These staff add to the cost of the technique to the healthcare system.
Paravertebral blockade
Paravertebral block (PVB) involves injecting local anaesthetic into the paravertebral space to block nerves after leaving the spinal cord. PVB can be given as a 'single shot' technique but is often given as a continuous infusion of local anaesthetic via a catheter placed directly through the skin (percutaneously) or under direct vision during thoracotomy. Thoracic paravertebral anaesthesia has a number of advantages over the thoracic epidural technique. PVB is a one‐side (unilateral) technique and so respiratory and sympathetic function is preserved on the other (contralateral) side (Ng 2007) and this may be associated with less hypotension, fewer pulmonary complications and less urinary retention (Davies 2006). The failure rate in adults has been reported as 10.1% (Lonnqvist 1995; Richardson 1999) and significantly lower than TEB (odds ratio (OR) 0.28, P value = 0.007) (Davies 2006). The complications reported include inadvertent vascular puncture (3.8% to 6.8%); hypotension (4.0% to 4.6%); haematoma (2.4%); pain at site of skin puncture (1.3%); signs of epidural or intrathecal spread (1.0%); pleural puncture (0.8% to 1.1%); and pneumothorax (0.5%) (Lonnqvist 1995; Naja 2001). Recent evidence suggests that short‐term side effects such as hypotension, urinary retention, nausea, and vomiting appear to be less frequent with PVB than with TEB (Daly 2009). The effect of paravertebral anaesthesia on blood pressure and heart rate is minimal, making this technique safe for patients with coexisting circulatory disease. PVB is thought to be associated with better pulmonary function and fewer pulmonary complications than TEB (Joshi 2008; Richardson 1999). Contraindications to thoracic epidural analgesia do not preclude PVB, which can also be safely performed in anaesthetized patients without an apparent increased risk of neurological injury.
How the intervention might work
The primary purpose of both these techniques is to achieve good postoperative analgesia. They employ the same pharmacological agents and both have been shown to produce important benefits in this clinical setting. This review is less concerned with the mode of action of PVB than with the ease of use, broad applicability, and relative safety of this technique. Technically, PVB is easier to perform than TEB, needle placement for paravertebral block is away from the midline and spinal cord (Richardson 1999), and some patients who are unsuitable for TEB may be suitable for PVB.
Why it is important to do this review
TEB using local anaesthetic and opioid has been widely regarded as the gold standard for analgesia and reduction of the associated complications after thoracotomy. A survey of Australian thoracic anaesthetists in 1997 revealed that 79% regarded TEB as the method of choice for analgesia in thoracotomy (Cook 1997a). Similar results were found in the UK, with 80% of anaesthetists considering TEB as the best mode of pain relief for upper abdominal surgery (Cook 1997b). Recent evidence from two meta‐analyses and systematic reviews comparing the analgesic efficacy and side effects of epidural versus paravertebral blockade for thoracotomy pain control concluded that although the analgesia was comparable, paravertebral blockade had a better short‐term side‐effect profile, including urinary retention, hypotension, nausea and vomiting, and pulmonary complications (Davies 2006; Joshi 2008). The reviews suggest that paravertebral blockade may be superior to an epidural, but these reviews did not evaluate the more serious complications including mortality. A 2008 survey of all 38 thoracic units in the UK that was carried out by the Association of Cardiothoracic Anaesthetists (ACTA) reported that the majority of thoracic anaesthetists (2/3 units) prefer TEB to PVB, which suggests that most thoracic anaesthetists have yet to be convinced by the evidence available (Shelley 2008).
Compared to TEB, PVB may have several practical advantages. In patients on anti‐coagulants or anti‐platelet therapy, PVB can be placed with little concern about epidural haematoma, abscess, or neurological injury (Daly 2009; Luyet 2009). The catheter can be placed in the correct position under the direct guidance of the surgeon, ensuring accurate placement without damage to neurovascular structures or the pleura. Postoperative management of epidural infusion requires a specialized unit or ward whilst PVB can be managed on an ordinary ward (Daly 2009; Luyet 2009). PVB can be used in a higher proportion of patients and reduces their hospital stay, thereby reducing costs as well as improving the quality of patient care and satisfaction.
A large prospective multicentre investigation into analgesic techniques and morbidity following elective pneumonectomy for cancer (Powell 2009) shows that TEB was associated with more major complications, including significant arrhythmias or pulmonary complications requiring treatment or ventilator support, unexpected intensive care unit (ICU) admissions, 30‐day mortality, further surgery, inotrope usage than PVB (OR adjusted for patient and perioperative factors of 2.2, 95% confidence interval (CI) 1.1 to 3.8; P value = 0.02) (Powell 2009). A comprehensive review of the existing evidence is needed to establish whether paravertebral block is associated with a lower risk of major complications and to clarify whether further randomized trials are justified.
Objectives
To compare the two regional techniques of TEB and PVB in adults undergoing elective thoracotomy with respect to:
analgesic efficacy;
the incidence of major complications (including mortality);
the incidence of minor complications;
length of hospital stay;
cost effectiveness.
Methods
Criteria for considering studies for this review
Types of studies
We included only randomized controlled trials (RCTs). We have excluded quasi‐randomized trials, for example where allocation was determined by days of the week or hospital number.
Types of participants
We included all adults undergoing elective thoracotomy including for upper gastrointestinal surgery.
Types of interventions
We included continuous thoracic epidural infusions using local anaesthetics, opioids, and any adjuvant therapies. The comparator was continuous paravertebral blockade using local anaesthetics and adjuvant therapies.
Types of outcome measures
Primary outcomes
Mortality to 30 days.
Major complications including any of: cardiovascular complications (systemic hypotension requiring inotropic support, significant arrhythmias requiring anti‐arrhythmic or cardioversion treatment, myocardial infarction, pulmonary oedema); pulmonary complications requiring treatment (postoperative ventilatory support, reintubation for respiratory failure, acute carbon dioxide retention (CO₂ > 45 mmHg), pneumonia, atelectasis); neurological complications (delirium); unexpected admission to intensive care; any complications that lead to further surgery.
Secondary outcomes
Analgesic efficacy including pain scores (visual analogue scales), acute pain, failure of technique, supplemental analgesia, morphine consumption.
Minor complications including hypotension (not requiring inotropes), postoperative ileus, excessive sedation, nausea and vomiting, pruritis, and urinary retention.
Chronic pain at six months and one year.
Duration of hospital stay and cost.
Search methods for identification of studies
Electronic searches
We searched for studies on thoracic epidural and paravertebral blocks in adults undergoing thoracotomy in the Cochrane Central Register of Controlled Trials (CENTRAL, 2013, Issue 9) see Appendix 1); MEDLINE via Ovid (1966 to 16th October 2013, see Appendix 2); EMBASE via Ovid (1980 to 16th October 2013, see Appendix 3); and CINAHL via EBSCOhost (1982 to 16th October 2013, see Appendix 4); trial reference lists; and in conference abstracts.
We limited the results to RCTs using the Cochrane highly sensitive search strategy (Higgins 2011). We did not impose any language restriction.
We combined a free‐text search with a controlled vocabulary search, from the inception of a database to the present.
We handsearched the Journal of Cardiothoracic Surgery and Journal of Cardiothoracic and Vascular Anesthesia (from 1996 to 2013).
We reran the search on 31st January 2015. We found one study of interest during that search which we will address when we update the review.
Searching other resources
We searched conference proceedings and abstracts of important meetings in cardiothoracic surgery and anaesthesia on 31st January 2015 and made all efforts to contact authors and experts in order to identify any unpublished research and trials still underway.
We also searched the databases of ongoing trials on 31st January 2015, such as: www.controlled‐trials.com/; clinicaltrials.gov/.
Data collection and analysis
Selection of studies
Two review authors (JY and SG) screened the abstracts of all publications obtained by the search strategies. We noted any reasons for study exclusion in RevMan 5.3. For trials that appeared to be eligible RCTs, we obtained the full articles to assess their relevance based on the predefined criteria for inclusion. We resolved any disagreement through discussion or, if required, we consulted with FG.
Data extraction and management
We used a data collection form to extract data (see Appendix 5). For eligible studies, two review authors (JY and SG) extracted data independently from original publications onto the agreed form. We resolved any disagreement through discussion or, if required, we consulted with FG. As far as possible, we contacted study authors for important information that was missing or unclear. We entered data into RevMan 5.3 and checked it for accuracy.
Assessment of risk of bias in included studies
Two review authors (JY and SG) independently assessed the risk of bias for each study using the criteria outlined in the Cochrane 'Risk of bias' assessment tool (Higgins 2011). We resolved any disagreement through discussion or, if required, we consulted with FG. We constructed a 'Risk of bias' table for all included studies in the review.
(1) Random sequence generation
We described for each included study the method used to generate the random sequence in sufficient detail to allow assessment of whether it should produce comparable groups.
We assessed the method as:
§ low risk of bias (any truly random process, e.g. random number table, computerized random number sequence); § high risk of bias (inadequate generation of randomization sequence, e.g. consecutive); § unclear risk of bias.
(2) Allocation concealment (checking for possible selection bias)
We described for each included study the method used to conceal the allocation sequence in sufficient detail and determine whether intervention allocation could have been foreseen in advance of or during recruitment, or changed after assignment.
We assessed the methods as:
§ low risk of bias (e.g. telephone or central randomization; consecutively‐numbered sealed opaque envelopes); § high risk of bias (e.g. open random allocation; unsealed or non‐opaque envelopes; alternation; date of birth); § unclear.
(3) Blinding (checking for possible performance bias)
We described for each included study the methods used, if any, to blind the study participants personnel and outcome assessment from knowledge of which intervention a participant received. We judged studies to be at low risk of bias if they were blinded, or if we judge that the lack of blinding could not have affected the results. We recognized that it may not be possible to blind clinicians or participants.
We assessed the methods as:
§ low risk of bias, high risk of bias, or unclear risk of bias for participants; § low risk of bias, high risk of bias, or unclear risk of bias for personnel; § low risk of bias, high risk of bias, or unclear risk of bias for outcome assessors.
(4) Incomplete outcome data (checking for possible attrition bias through withdrawals, dropouts, protocol deviations)
We described for each included study, and for each outcome or class of outcomes, the completeness of data including attrition and exclusions from the analysis. We stated whether attrition and exclusions were reported, the numbers included in the analysis at each stage (compared with the total number of randomized participants), the reasons for attrition or exclusion where reported, and whether missing data were balanced across groups or were related to outcomes. Where sufficient information was reported, or could be supplied by trial authors, we re‐included missing data in the analyses which we undertook.
We assessed the methods as:
§ low risk of bias (where numbers and reasons for attrition, exclusion or re‐inclusion have been reported); § high risk of bias (where there are high numbers of dropouts and protocol deviations leading to loss to follow‐up); § unclear.
(5) Selective reporting bias
Where the original protocol of a study was available (for example, as a separate publication), we assessed whether all of the prespecified outcomes and analyses were presented.
We assessed the methods as:
§ low risk of bias (where it is clear that all of the study’s prespecified outcomes and all expected outcomes of interest to the review have been reported); § high risk of bias (where not all the study’s prespecified outcomes have been reported, one or more of the reported primary outcomes were not prespecified, outcomes of interest were reported incompletely and so cannot be used, the study fails to include results of a key outcome that would have been expected to have been reported); § unclear.
(6) Other bias
We described for each included study any important concerns we have about other possible sources of bias.
We assessed whether each study was free of other problems that could put it at risk of bias:
§ low risk of bias; § high risk of bias; § unclear.
(7) Overall risk of bias
We made explicit judgements about whether studies are at high risk of bias, according to the criteria given in the Cochrane Handbook for Systematic Reviews of Interventions (Higgins 2011). With reference to (1) to (6) above, we assessed the likely magnitude and direction of the bias and whether we considered it likely to impact on the findings. We explored the impact of the level of bias through undertaking sensitivity analyses; seeSensitivity analysis.
Measures of treatment effect
Dichotomous data
For dichotomous data, we have presented results as a summary risk ratio (RR) with 95% confidence interval (CI).
Continuous data
For continuous data, we used the mean difference (MD) if outcomes are measured in the same way between trials. When possible, we used the standardized mean difference (SMD) to combine trials that measure the same outcome but use different methods.
Unit of analysis issues
Cluster‐randomized trials
We had intended to include cluster‐randomized trials in the analyses along with individually randomized trials but we found no suitable cluster‐randomized trials.
Dealing with missing data
For included studies, we noted levels of attrition. We explored the impact of including studies with high levels of missing data in the overall assessment of treatment effect, using sensitivity analysis. We performed sensitivity analysis for missing data by inclusion and exclusion of studies with a high proportion of missing data. We conducted sensitivity analysis by omitting studies with high attrition (> 15% of participants) from analysis (Gulbahar 2010; Perttunen 1995). We have described this in the Sensitivity analysis section.
For all outcomes, we conducted analyses as far as possible on an intention‐to‐treat (ITT) basis; that is, we attempted to include all participants randomized in the analyses in the groups to which they were allocated, regardless of whether or not they received the allocated intervention.
Assessment of heterogeneity
If we detected substantial heterogeneity we considered whether a pooled result would be meaningful and if so we used a random‐effects model analysis to produce it. We assessed statistical heterogeneity in each meta‐analysis using the I² and τ² statistics. We regarded heterogeneity as substantial if the I² statistic exceeded 30% and either τ² was greater than zero, there was a low P value (< 0.10) in the Chi² test for heterogeneity, or there was clearly substantial inconsistency between trials in the direction or magnitude of effects as judged by visual inspection.
Assessment of reporting biases
If there were 10 or more studies in a meta‐analysis we planned to investigate reporting biases such as publication bias, using funnel plots. We planned to assess funnel plot asymmetry visually and by formal tests. For continuous outcomes we planned to use the test proposed by Egger 1997, and for dichotomous outcomes the tests proposed by Harbord 2006 or Peters 2006. If any of these tests detected asymmetry or it was suggested by a visual assessment, we planned to perform exploratory analyses to investigate it.
Data synthesis
We carried out statistical analysis using the Review Manager 5 software (RevMan 5.3). We used a fixed‐effect model meta‐analysis for combining data where it was reasonable to assume that studies are estimating the same underlying treatment effect, that is, where trials were examining the same intervention and we judged the trial populations and methods to be sufficiently similar. If there was clinical heterogeneity sufficient to expect that the underlying treatment effects differed between trials, or if we detected substantial statistical heterogeneity, we used a random‐effects model analysis to produce an overall summary, if we considered this clinically meaningful. We presented the results of random‐effects analyses as the estimated average treatment effect with its 95% confidence interval, and the 95% prediction interval for the underlying treatment effect (Riley 2011). If an average treatment effect across trials was not clinically meaningful we did not combine heterogeneous trials. If we used random‐effects analyses, the results presented reflect the average treatment effect and its 95% confidence interval, the 95% prediction interval for the underlying treatment effect, and the estimates of τ² and I² statistic.
Subgroup analysis and investigation of heterogeneity
If we identified substantial heterogeneity, we planned to investigate it using subgroup and sensitivity analyses.
We planned to consider whether an overall summary was meaningful and if so to use a random‐effects model analysis to produce it. We planned to carry out the following subgroup analyses.
Different types of epidurals (e.g. local anaesthetics with or without added opioid).
Different types of surgery (e.g. thoracic surgery, upper gastrointestinal surgery).
Timing of insertion (before skin incision, after operation).
Method of insertion (blind, under ultrasound guidance, under direct vision).
Other additives used in local anaesthetic mixture (beside local anaesthetics and opiates).
We planned to use only the primary outcome (major complications) in subgroup analysis.
For fixed‐effect inverse variance meta‐analysis we planned to assess the differences between subgroups by interaction tests implemented in RevMan 5.3. For other types of analysis we planned to conduct interaction tests using mixed‐effects meta‐regression in external statistical software.
Sensitivity analysis
We planned to carry out sensitivity analysis to explore the effects of fixed‐effect or random‐effects analyses for outcomes with statistical heterogeneity and the effects of any assumptions made such as the value of the intracluster correlation coefficient (ICC) used for cluster‐randomized trials. There were no cluster‐randomized controlled trials in this review and the ICC was not calculated. We had also planned to use sensitivity analyses to explore the effects of inclusion of studies at high risk of bias (by assessing the effects of deletion of high‐risk studies), and the effects of missing outcome data (by assessing best‐case and worst‐case scenarios, and whether plausible values of missing data are likely to make a substantial difference to the results).
'Summary of findings' tables
We used the principles of the GRADE system (Guyatt 2008) in our review to assess the quality of the body of evidence associated with specific outcomes. We included the following as outcomes: cardiovascular complications, pulmonary complications, critical care admission, further surgery, 30‐day mortality, analgesia efficacy, minor complications, and constructed a 'Summary of findings' table using the GRADEpro software. The GRADE approach appraises the quality of a body of evidence based on the extent to which one can be confident that an estimate of effect or association reflects the item being assessed. The quality of a body of evidence considers within‐study risk of bias (methodologic quality), the directness of the evidence, heterogeneity of the data, precision of effect estimates, and risk of publication bias.
Results
Description of studies
See Characteristics of included studies and Characteristics of excluded studies.
Results of the search
See Figure 1
1.

1 Study flow diagram (Search dates October 2013, reran January 2015)
The electronic and handsearches described above and in the appendices in October 2013 retrieved 74 results. After removal of one duplicate, there were 73 unique results. After review of the abstracts we excluded 54 reports and reviewed the full‐text version of the remaining 19 citations. Of these, we considered 14 papers to be relevant to the research question. We were unable to obtain a full‐text version of one paper (Wedad 2004), which remains awaiting classification.
We reran the search on 31st January 2015 and found one study of interest (Raveglia 2014). There are two studies in total that are awaiting classification. We will address these studies when we update the review.
Included studies
We include 14 studies (Bimston 1999; Casati 2006; De Cosmo 2002; Grider 2012; Gulbahar 2010; Ibrahim 2009; Kaiser 1998; Kobayashi 2013; Matthews 1989; Messina 2009; Murkerjee 2010; Perttunen 1995; Pintaric 2011; Richardson 1999) involving a total of 698 participants in qualitative and quantitative analyses. Included studies were from 1995 to 2003, and of relatively small sample sizes, ranging from 20 to 100 participants. There was a high degree of clinical heterogeneity. Whilst all 14 studies compared the analgesic efficacy of paravertebral blockade (PVB) and thoracic epidural blockade (TEB) in participants undergoing open thoracotomy, there were significant differences in the timing, method of insertion and utilization of PVB and TEB in the peri‐operative setting (Table 3). In the majority of the studies, TEB was inserted at the beginning of the procedure before surgical incision was made, except for Matthews 1989 where the participants were randomized to the intervention at the end of the procedure and TEB was then placed by the anaesthetists after chest closure. Although TEBs were inserted before the surgical procedure in the remaining 13 studies, these were not used to provide pain relief until the end of surgery in five studies (Grider 2012; Kobayashi 2013; Messina 2009; Murkerjee 2010; Perttunen 1995). The time frames for data collection and follow‐up of participants ranged from two to 96 hours postoperatively.
1. Technical aspects of PVB and TEB catheters.
| PVB | TEB | |||||
| STUDY | METHOD OF INSERTION | METHOD OF USE | POSTOPERATIVE MEDICATION | METHOD OF INSERTION | METHOD OF USE | POSTOPERATIVE MEDICATION |
| Bimston 1999 | Inserted under direct vision by surgeon | 18 ml 0.5% bupivacaine bolus followed by infusion of 0.1% bupivacaine with 10 μg/ml fentanyl, 10 ‐ 15 ml/hr | infusion of 0.1% bupivacaine with 10 μg/ml fentanyl, 10 ‐ 15ml/min | Percutaneously by landmark technique before induction of GA | Uncertain whether catheter was used during operation | Infusion of 0.1% bupivacaine with 10 μg/ml fentanyl, 10 ‐ 15 ml/hr |
| Casati 2006I | Percutaneously by landmark technique before induction of GA | Pre‐op Injections by landmark technique before induction of GA 15 ml of 0.75% ropivacaine |
infusion of 0.2% ropivacaine at 5 ‐ 10ml/hr | Percutaneously by landmark technique before induction of GA | 5 ml bolus of 0.75% ropivacaine | infusion of 0.2% ropivacaine at 5 ‐ 10 ml/hr |
| De Cosmo 2002 | Inserted under direct vision by surgeons | Used at the end of operation only | 20 ml of 0.475% ropivacaine as loading dose, infusion of 0.3% ropivacaine at 5 ml/hr post‐surgery | Percutaneously by landmark technique before induction of GA | 5 ml bolus of 0.2% ropivacaine and sufentanil 10 µg given as bolus. Catheter used during operation if required | Infusion of 0.2% ropivacaine with 0.75 µg/ml of sufentanil at 5 ml/hr |
| Grider 2012 | Inserted under direct vision by surgeon | Used at the end of the operation only | 0.25% bupivacaine at 8 ml/hr | Percutaneously by landmark technique before induction of GA | Used at the end of operation | 0.25% bupivacaine 2 ml/hr with 1 ml every 10 min PCEA with or without hydromorphine |
| Gulbahar 2010 | Inserted under direct vision by surgeon | Used at the end of operation only | 0.25% bupivacaine infusion at 0.0 ml/kg/hr PCEA | Percutaneously by landmark technique before induction of GA | Used at the end of operation | 5 ml of 0.25% bupivacaine bolus, followed by 0.0 ml/kg/hr PCEA |
| Ibrahim 2009 | Percutaneously by landmark technique before induction of GA | 15 ‐ 20 ml 0.5% ropivacaine bolus followed by 0.375% ropivacaine 0.1 ml/kg/hr infusion | 0.375% ropivacaine 0.1 ml/kg/hr infusion | Percutaneously by landmark technique before induction of GA | 5 ‐ 8 ml of 0.5% ropivacaine bolus followed by 0.375% ropivacaine 0.1 ml/kg.hr infusion | 0.375% ropivacaine 0.1 ml/kg/hr infusion |
| Kaiser 1998 | Inserted under direct vision by surgeon | Used at the end of operation only | 20 ml 0.5% bupivacaine bolus followed by 0.1 ml/kg/hr of 0.5% bupivacaine | Percutaneously by landmark technique before induction of GA | 0.5% bupivacaine at 4 ‐ 6 ml/hr infusion during operation | 4 ‐ 8 ml/hr of 0.25 ‐ 0.375% bupivacaine with 2 μg/ml fentanyl |
| Kobayashi 2013 | Inserted under direct vision by surgeon | Used at the end of operation only | 10 ml 0.375% ropivacaine bolus followed by 0.2% ropivacaine with fentanyl 9.5 μg/ml at 5 ml/hr infusion | Percutaneously by landmark technique before induction of GA | Used at the end of operation | 5 ml 0.2% ropivacaine bolus followed by 0.2% ropivacaine with fentanyl 9.5 μg/ml at 5 ml/hr infusion |
| Matthews 1989 | Percutaneously by landmark at the end of procedure | Used at the end of operation only | 10 ml 0.25% bupivacaine bolus followed by infusion at 5 ml/hr | Percutaneously by landmark technique at the end of procedure | Used at the end of operation | 10 ml 0.25% bupivacaine bolus followed by infusion at 5 ml/hr |
| Messina 2009 | Percutaneously by landmark technique before induction of GA | Used at the end of operation only | 0.125% levobupivacaine with fentanyl 2 μg/ml at 0.08 ml/kg/hr infusion | Percutaneously by landmark technique before induction of GA | Used at the end of operation | 0.25% levobupivacaine with fentanyl 1.6 μg/ml at 0.1 ml/kg/hr infusion |
| Murkerjee 2010 | Percutaneously by landmark technique before induction of GA | Used at the end of operation only | 15 ml of 0.25% bupivacaine with 50μg of fentanyl bolus | Percutaneously by landmark technique before induction of GA | Used at the end of operation | 7.5 ml of 0.25% bupivacaine with 50 μg of fentanyl bolus |
| Perttunen 1995 | Inserted by surgeon under direct vision | Used at the end of operation only | 0.25% bupivacaine bolus according to height, infusion of 4 ml/hr, 6 ml/hr, 8 ml/hr | Percutaneously by landmark technique before induction of GA | Used at the end of operation | 0.25% bupivacaine bolus according to height, infusion of 4 ml/hr, 6 ml/hr, 8 ml/hr |
| Pintaric 2011 | Percutaneously by landmark technique before induction of GA | 0.5% levopubivacaine with 30 μg/kg morphine, dose depends on height | 0.125% levobupivacaine with 20 μg/ml morphine infusion at 0.1 ml/kg/hr with PCEA | Percutaneously by landmark technique before induction of GA | 0.25% levopubivacaine with 30 μg/kg morphine, dose depends on height | 0.125% levobupivacaine with 20 μg/ml morphine infusion at 0.1 ml/kg/hr with PCEA |
| Richardson 1999 | Inserted by surgeon under direct vision | Pre‐op Injections by landmark technique before induction of GA 20 ml of 0.5% bupivacaine |
20 ml bolus of 0.5% bupivacaine, followed by infusion at 0.1 ml/kg/hr | Percutaneously by landmark technique before induction of GA | 10 ‐ 15 ml bolus of 0.25% bupivacaine | 10 ml bolus of 0.25% bupivacaine, followed by infusion at 0.1 ml/kg/hr |
GA: general anaesthesia hr: hour kg: kilogram ml: millilitres PCEA: patient‐controlled epidural analgesia PVB: paravertebral blockade TEB: thoracic epidural blockade µg: micrograms
There was further heterogeneity in the placement of PVB. In three studies (Casati 2006; Messina 2009; Richardson 1999), the paravertebral space was identified using landmark technique, and local anaesthetic was injected as a bolus to initiate the blockade. The most popular insertion method of PVB catheter was by the surgeon under direct vision, and eight studies used this technique (Bimston 1999; De Cosmo 2002; Grider 2012; Gulbahar 2010; Kaiser 1998; Kobayashi 2013; Perttunen 1995; Richardson 1999). PVB catheters were inserted by anaesthetists percutaneously before surgical procedure in five studies (Casati 2006; Ibrahim 2009; Messina 2009; Murkerjee 2010; Pintaric 2011) and post‐procedure in one study (Matthews 1989).
The content of infusions used for TEB and PVB also varied in terms of timing and volume of boluses/loading dose, infusion rates, local anaesthetic used (bupivacaine, levobupivacaine, ropivacaine), concentration of local anaesthetic (0.1% to 0.5%), whether opiates were added and what type of opiates (fentanyl, morphine, hydromorphine) (see Table 3). For further details refer to the Characteristics of included studies tables.
Excluded studies
There were three excluded studies (Elsayed 2012; Kanazi 2012; Kozar 2011). Elsayed 2012 was a retrospective analysis of patient records looking at complications in post‐thoracotomy patients. Kanazi 2012 described a subpleural catheter but without review of described technique, and did not represent a PVB so was excluded. Although Kozar 2011 compared thoracic epidural and paravertebral block and the incidence of chronic pain, pain was measured at three months and did not meet our selection criteria. Data were not included in our analysis. For further details refer to the Characteristics of excluded studies tables.
Studies awaiting classification
There are two studies awaiting classification. Wedad 2004 compared thoracic epidural, paravertebral and interpleural analgesia with wound infiltration. Despite strenuous efforts, we did not manage to obtain a copy of the article to include in our review. Raveglia 2014 was a prospective randomized study of 71 participants undergoing thoracotomy, comparing the impact of thoracic epidural and paravertebral blockade on pain control and respiratory function. For further details refer to the Characteristics of studies awaiting classification tables.
Ongoing studies
There are no ongoing studies
Risk of bias in included studies
See Figure 2 and Figure 3 for summaries of the 'Risk of bias' assessments for the 14 included studies.
2.

Risk of bias graph: review authors' judgements about each risk of bias item presented as percentages across all included studies.
3.

Risk of bias summary: review authors' judgements about each risk of bias item for each included study.
Allocation
The majority of studies did not report how the randomization sequence was generated, simply saying that allocation was "random". Six studies reported the randomization method used and were at low risk of selection bias (Bimston 1999; Casati 2006; De Cosmo 2002; Ibrahim 2009; Pintaric 2011; Richardson 1999). Three studies reported adequate methods of allocation concealment and were at low risk of selection bias (Casati 2006; Ibrahim 2009; Pintaric 2011). The majority dd not mention how the random sequence was applied, or whether allocations were adequately concealed before assignment.
Blinding
Two studies reported blinding of participants and clinicians and were at low risk of performance bias (Grider 2012; Ibrahim 2009). This was achieved by putting both types of analgesia in place but only infusing one. The remainder of the studies either stated that participants and clinicians were aware of treatment allocations, or did not mention blinding, which probably means they were not blinded. Four studies described measures to blind observers of outcomes and were at low risk of detection bias (Grider 2012; Casati 2006; Ibrahim 2009; Pintaric 2011). In most studies, the main outcomes were self‐reported by the participants, who were not blinded.
Incomplete outcome data
Ten studies reported outcomes for all randomized participants and were at low risk of attrition bias (Bimston 1999; Casati 2006; Grider 2012; Ibrahim 2009; Kobayashi 2013; Matthews 1989; Messina 2009; Murkerjee 2010; Pintaric 2011; Richardson 1999). There was no study reporting high levels of missing data (less than 15% in all cases). However, we rated two studies at high risk of bias: Gulbahar 2010 excluded 6/50 participants (12%), but all from the epidural arm; Perttunen 1995 excluded 6/51 randomized participants (12%). We examined the treatment effects according to quality components (concealed treatment allocation, blinding of participants and caregivers, blinded outcome assessment).
Selective reporting
None of the included studies was registered on trial registries and it was unclear whether there was selective reporting bias. In one study (Messina 2009), several potentially important outcome measures were not published, including VAS on movement, sedation scores and arterial blood gases.
Other potential sources of bias
Six studies had low risk of other bias (Casati 2006; De Cosmo 2002; Ibrahim 2009; Kobayashi 2013; Perttunen 1995; Pintaric 2011). In Bimston 1999 the two arms were treated differently; the epidural arm was under the care of anaesthetists, but the paravertebral block arm was under the care of the surgical team. This led to differences in the care received, and hence differences in outcome may be due to differences in treatments received other than the randomized intervention. In Messina 2009, the authors stated that their institution had extensive experience in the insertion of TEB catheters but the insertion of PVB catheters was a novel technique to the anaesthetists who had only performed 30 PVBs prior to the study. The differences in the analgesic efficacy of the two techniques, especially PVB, could be influenced by the disparity in experience.
Effects of interventions
Primary outcomes
1. Mortality at 30 days
There was low‐quality evidence on mortality at 30 days, with only two studies reporting 30‐day mortality (Kaiser 1998; Richardson 1999), and a total of 125 participants (17.9% of total participants included in this review). Five out of 61 (8.2%) participants died in the PVB group and four out 64 (6.3%) participants died in the TEB group, an absolute risk reduction of 1.9%. The risk of dying within 30 days following PVB was not statistically higher (RR 1.28, 95% CI 0.39 to 4.24, P value = 0.68) (Analysis 1.1)
1.1. Analysis.

Comparison 1 30‐day mortality, Outcome 1 30‐day mortality.
2. Major complications
We had intended to report the overall risk of suffering a major complication with each of the techniques under study; however, none of the included studies reported the number of individuals who suffered a major complication. Rather, they each reported the number of individuals with each individual complication, and it is not clear how many such complications each individual may have suffered. We have therefore reported here on each major complication individually.
Cardiovascular complications
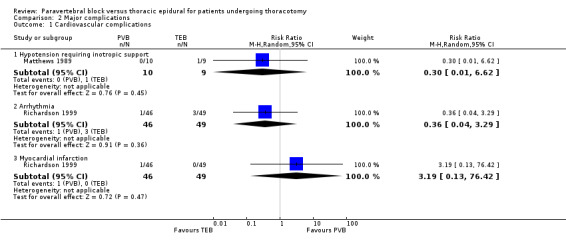
There was low‐quality evidence on major cardiovascular complications, with limited data available. Two studies with a total of 114 participants (16.3% of total participants included in this review) reported cardiovascular complications (Matthews 1989; Richardson 1999); 2/56 (3.6%) had cardiovascular complications following PVB, while 4/58 (6.9%) reported the same in the TEB group. There was no difference in hypotension requiring inotropes (RR 0.30, 95% CI 0.01 to 6.62, P value = 0.45), arrhythmias (RR 0.36, 95%CI 0.04 to 3.29, P value = 0.36) and myocardial infarction (RR 3.19, 95% CI 0.13 to 76.42, P value = 0.47), Figure 4. In Matthews 1989, one participant in the TEB group suffered persistent hypotension despite fluid resuscitation and received inotropic support (RR 0.30, 95% CI 0.01 to 6.62, P value = 0.45), Analysis 2.1. Three participants from the TEB group and one participant from the PVB group developed arrhythmias but there was no information on the treatment that they received (RR 0.36, 95% CI 0.04 to 3.29, P value = 0.36, Analysis 2.1). Richardson 1999 reported one participant in the PVB group who had a myocardial infarction and died as a result (RR 3.19, 95% CI 0.13 to 76.42, P value = 0.47, Analysis 2.1).
4.

Forest plot of comparison: 2 Major complications, outcome: 2.1 Cardiovascular complications.
2.1. Analysis.
Comparison 2 Major complications, Outcome 1 Cardiovascular complications.
Pulmonary complications
There was low‐quality evidence on pulmonary complications. Five studies with a total of 280 participants (40.1% of total) reported pulmonary complications (Bimston 1999; Grider 2012; Kaiser 1998; Perttunen 1995; Richardson 1999). Eleven of 131 (8.4%) participants in the PVB group reported respiratory complications, while 20/149 (13.4%) reported the same in the TEB group. This difference of 5% was not statistically significant (RR 0.62, 95% CI 0.26 to 1.52, I² statistic = 26%, P value = 0.30, Figure 5). In subgroup analyses by specific complications reported, there was no statistically significant difference between the PVB and TEB groups. Two participants from the TEB group developed respiratory distress and were reintubated and ventilated in the intensive care unit (ICU) in Grider 2012.
5.

Forest plot of comparison: 2 Major complications, outcome: 2.2 Respiratory complications.
In Perttunen 1995, respiratory depression (PaCO₂ > 4.5 kPa) was observed in five participants in the TEB group and six participants in the PVB group for more than two hours after the operation. Pneumonia was diagnosed in participants from three studies, in 18 out of 175 participants (Bimston 1999; Kaiser 1998; Richardson 1999). The risk of developing pneumonia post‐thoracotomy was not significantly different between the PVB and TEB groups (RR 0.38, 95% CI 0.10 to 1.45, I² statistic = 28%, P value = 0.16, Analysis 2.2). Atelectasis was not observed in our included studies.
2.2. Analysis.

Comparison 2 Major complications, Outcome 2 Respiratory complications.
Neurological complications
Major neurological complications were poorly reported. There was moderate‐quality evidence on delirium only. Delirium was described in two clinical trials involving 125 participants (Perttunen 1995; Richardson 1999) but no definition of delirium was reported.
In Perttunen 1995, seven out of 15 participants developed delirium in the TEB group compared to two out of 15 participants in the PVB group. Three out of 49 participants in the TEB group developed delirium compared with one out of 46 participants in the PVB group in Richardson 1999. The risk of developing delirium following thoracotomy was lower in the PVB group compared to TEB, but did not reach statistical significance (RR 0.31, 95% CI 0.09 to 1.00, P value = 0.05, Analysis 2.3).
2.3. Analysis.

Comparison 2 Major complications, Outcome 3 Neurological complication (Delirium).
Unexpected admission to intensive care
There was low‐quality evidence on unexpected admission to intensive care with very limited data from two studies of 139 participants (Gulbahar 2010; Richardson 1999). Three out of 25 participants in the TEB group were admitted to the ICU compared to one out of 25 participants in the PVB group in Gulbahar 2010. Three participants each from both the TEB and PVB groups were admitted to ICU unexpectedly in Richardson 1999. There was little heterogeneity and fixed‐effect analysis was used. Unexpected admission rates to ICU were not statistically significant between the PVB and TEB groups (RR 0.63, 95% CI 0.19 to 2.07, P value = 0.44) Analysis 2.4.
2.4. Analysis.

Comparison 2 Major complications, Outcome 4 Unexpected ITU admission.
Any complications that lead to further surgery
There was very low‐quality evidence on complications that lead to further surgery, with only one study of 45 participants (Perttunen 1995). In Perttunen 1995, one out of 15 participants in the TEB group needed further surgery (RR 0.31, 95% CI 0.01 to 8.28).
Secondary outcomes
1. Analgesic efficacy including pain scores
Although all 14 included studies reported on analgesic efficacy of PVB and TEB, studies differed significantly in the way acute pain was assessed and reported. Pooling of results from all studies was not possible, due to significant clinical heterogeneity. Visual analogue scale scores (VAS) were used in all of the studies but the scales were different; a majority of studies used the 0 to 10 scale, but Kaiser 1998 used VAS in 0 to 4 categories (reported as mean and standard deviation (SD)), and two studies (Ibrahim 2009; Perttunen 1995) used VAS 0 to 5. Types and concentrations of local anaesthetic used in bolus and infusions also varied, with some studies adding opiates to the infusion mixture and some allowing participant‐controlled top‐up (see Table 3).The method and time intervals of VAS score assessments also differed between the studies, with some measuring VAS at rest and some at coughing or on movement, with intervals ranging from every two to four hours to only once every 24 hours (see Table 4). No subgroup analysis was possible.
2. VAS measurements by study.
| STUDY | VAS range | VAS reported | Timing of VAS | Time points VAS reported | Supplementary analgesia | CONCLUSION |
| Bimston 1999 | 0 ‐ 10 | Mean | At rest | 8, 16, 24, 32, 49, 48, 56, 64, 72, 80, 88, 96 hrs | Not reported | TEB superior to PVB for first 32 hrs |
| Casati 2006 | 0 ‐ 10 | Mean (SD) | At rest On coughing |
Recovery, 12, 24, 48 hrs | Not reported | PVB as effective as TEB |
| De Cosmo 2002 | 0 ‐ 10 | Mean (SD) | At rest On movement |
1, 4, 8, 12, 24, 36, 48 hrs | Overall mean consumption of ketolorac reported | PVB as effective as TEB Lower VAS scores in TEB first 8 hrs |
| Grider 2012 | 0 ‐ 10 | Mean (SD) | At rest During physiotherapy |
Recovery, day 1 am, day 2 am/pm, day 3 am/pm, day 4 am | Number of participants in whom technique failed and PCA prescribed | PVB as effective as TEB (plain LA) however TEB with opiate was superior |
| Gulbahar 2010 | 0 ‐ 10 | Mean | At rest | Day 1, 2, 3 | Daily number of PCEA request | PVB as effective as TEB |
| Ibrahim 2009 | 0 ‐ 5 | Mean | At rest | 4, 8, 12, 16, 20, 24 hrs | Rescue morphine recorded but not published | PVB as effective as TEB |
| Kaiser 1998 | 0 ‐ 4 | Mean (SD) | At rest | Day 0, 1, 2, 3, 4, 5 | Mean daily consumption of nicomorphine | PVB as effective as TEB PVB superior at 72 and 96 hrs |
| Kobayashi 2013 | 0 ‐ 10 | Mean (SD) | At rest On coughing On exercise |
2, 5, 16, 20, 24, 48 hrs | Frequency of additional analgesic (non‐specified) | PVB as effective as TEB |
| Matthews 1989 | 0 ‐ 10 | Mean (SD) | At rest | 4, 12, 24 hrs | Not recorded | PVB as effective as TEB |
| Messina 2009 | 0 ‐ 10 | Mean (SD) | At rest On movement |
Recovery, 6, 24, 48, 72 hrs | Median cumulative morphine daily (mg) | PVB as effective as TEB |
| Murkerjee 2010 | NA | NA | NA | NA | NA | Single bolus PVB superior, lasted statistically significantly longer than TEB PVB: 171.66 (77.31) vs TEB: 105.83 (33.28) |
| Perttunen 1995 | 0 ‐ 5 | Mean (Range) | At rest On coughing |
1, 2, 4, 6, 20, 24, 30, 48 hrs | Mean cumulative PCA morphine consumption every 3 hrs | PVB as effective as TEB |
| Pintaric 2011 | 0 ‐ 10 | Mean (SD) | At rest After physiotherapy |
6, 24, 48 hrs | Mean consumption of piritramide | PVB as effective as TEB |
| Richardson 1999 | 0 ‐ 10 | Mean, median, IQR | At rest On coughing |
4, 8, 12, 16, 20, 24, 28, 32, 36, 40, 44, 48 hrs | Mean cumulative morphine consumption | PVB superior to TEB |
am: ante meridiem hr: hour IQR: interquartile range LA: local anaesthetic mg: milligram NA: not applicable PCA: patient‐controlled analgesia PCEA: patient‐controlled epidural analgesia PVB: paravertebral blockade TEB: thoracic epidural blockade pm: post meridiem SD: standard deviation VAS: visual analogue scale;
Findings from all the studies are summarized in Table 4. Due to clinical heterogeneity and lack of reported data, we were only able to extract data from six studies with a total of 239 participants (De Cosmo 2002; Grider 2012; Kobayashi 2013; Matthews 1989; Messina 2009; Pintaric 2011) for meta‐analysis of VAS scores. Due to the heterogeneity of the studies, we used the random‐effects model to analyse standardized mean difference between the VAS scores of the PVB and TEB groups at each time point. We found no significant differences in analgesic efficacy of TEB and PVB in terms of VAS scores (on coughing/after physiotherapy) at any time points (see Table 5); we also calculated 95% prediction intervals to determine the distribution of values and underlying treatment effect. Because there were few trials in the analyses, the estimates of the treatment effects were imprecise, as shown by the 95% prediction intervals. The results were also statistically non‐significant.
3. VAS measurements by time points.
| Visual Analogue Scales | Studies | Effect of intervention |
| 2 ‐ 6 hrs at rest |
De Cosmo 2002 Grider 2012 Kobayashi 2013 Matthews 1989 Messina 2009 Pintaric 2011 |
No difference Standard mean difference 0.32, 95% CI ‐0.30 to 0.94 P value = 0.31 95% PI ‐2.35 to 3.15 |
| 2 ‐ 6 hrs during coughing/on movement |
De Cosmo 2002 Grider 2012 Pintaric 2011 |
No difference Standard mean difference 0.41, 95% CI ‐0.20 to 1.03 P value = 0.06 95% PI ‐10.66 to 11.64 |
| 24 hrs at rest |
De Cosmo 2002 Grider 2012Grider 2012 Kobayashi 2013 Matthews 1989 Messina 2009 Pintaric 2011 |
No difference Standard mean difference 0.16, 95% CI ‐0.17 to 0.48 P value = 0.34 95% PI ‐0.25 to 0.69 |
| 24 hrs during coughing/on movement |
De Cosmo 2002 Grider 2012 Pintaric 2011 |
No difference Standard mean difference ‐0.23, 95% CI ‐0.58 to 0.12 P value = 0.20 95% PI ‐3.73 to 3.33 |
| 48 hrs at rest |
De Cosmo 2002 Grider 2012 Kobayashi 2013 Messina 2009 Pintaric 2011 |
No difference Standard mean difference ‐0.12, 95% CI ‐0.46 to 0.22 P value = 0.49 95% PI ‐1.26 to 1.14 |
| 48 hrs during coughing/on movement |
De Cosmo 2002 Grider 2012 Pintaric 2011 |
No difference Standard mean difference 0.25, 95% CI ‐0.16 to 0.66 P value = 0.22 95% PI ‐1.54 to 2.10 |
CI: confidence interval 95% PI: 95% prediction interval. Analysed using random‐events model VAS: visual analogue scale
Acute pain at two to six hours
There was moderate‐quality evidence on acute pain at two to six hours. Six studies with 365 participants were included (De Cosmo 2002; Grider 2012; Kobayashi 2013; Matthews 1989; Messina 2009; Pintaric 2011). Comparing VAS scores at two to six hours at rest and on coughing/after physiotherapy, there was no statistically significant difference between the PVB and TEB groups (SMD 0.35, 95% CI ‐0.09 to 0.78, P value = 0.12, Analysis 3.1).
3.1. Analysis.

Comparison 3 Acute pain, Outcome 1 VAS scores 2 to 6 hours.
Acute pain at 24 hours
There was moderate‐quality evidence on acute pain at 24 hours. Six studies with 365 participants have been included (De Cosmo 2002; Grider 2012; Kobayashi 2013; Matthews 1989; Messina 2009; Pintaric 2011). Comparing VAS scores at 24 hours at rest and on coughing/after physiotherapy, there was no statistically significant difference between PVB and TEB groups (SMD 0.02, 95% CI ‐0.24 to 0.28, P value = 0.90, Analysis 3.2).
3.2. Analysis.

Comparison 3 Acute pain, Outcome 2 VAS scores at 24 hours.
Acute pain at 48 hours
There was moderate‐quality evidence on acute pain at 48 hours. Five studies with 346 participants have been included (De Cosmo 2002; Grider 2012; Kobayashi 2013; Pintaric 2011; Messina 2009). Comparing VAS scores at 48 hours at rest and on coughing/after physiotherapy, there was no statistically significant difference between the PVB and TEB groups (SMD 0.02, 95% CI ‐0.26 to 0.30, P value = 0.90, Analysis 3.3).
3.3. Analysis.

Comparison 3 Acute pain, Outcome 3 VAS scores at 48 hours.
The remaining studies where we were unable to pool the reported results in the meta‐analyses are summarized below, while the results of each are given in Table 4.
Four studies found PVB as effective as TEB in the postoperative period (Casati 2006; Gulbahar 2010; Ibrahim 2009; Perttunen 1995). Casati 2006 was a single‐centre study carried out in Italy. Forty‐two consecutive participants undergoing elective thoracotomy for lung lobectomy were randomized into two groups, with 21 participants in the TEB group and 21 participants in the PVB group. Participants were followed up for 48 hours postoperatively: maximal drop in systolic blood pressure was recorded for each group, along with daily oxygenation and 12‐hourly record of VAS. Gulbahar 2010 recruited 50 participants scheduled for elective thoracotomy in a single‐centred RCT in Turkey. Data from 25 participants were collected from the PVB group but only data from 19 out of 25 participants were analysed from the TEB group, due to catheter misplacement and early cessation of TEB blockade. The study team collected VAS scores from participants for three days post‐surgery as well as oxygen saturation, pulse rate, blood pressure, arterial blood gases and spirometry values. Perttunen 1995 had three arms; 51 thoracotomy participants were randomly assigned to receive single‐shot intercostal blockade, continuous TEB or continuous PVB as analgesia. Only the results in the TEB and PVB groups were analysed in this review. Participants were followed up for 48 hours post‐surgery and pain was assessed with regular VAS scores at rest and when coughing. Segmental spread of sensory block in each group was recorded, as were morphine consumption, plasma bupivacaine, arterial blood gases, respiratory function tests and respiratory rate. Ibrahim 2009 recruited 50 participants scheduled for elective thoracotomy, with 25 participants assigned to each group. Intra‐operative pulse rate and blood pressure were recorded and participants were followed up for 24 hours post‐surgery. The extent of sensory block and VAS scores were collected from both groups every four hours. Additional data were collected also for plasma cortisol and glucose levels, respiratory function tests and number of complications observed.
Three studies reported better pain relief with PVB than TEB (Kaiser 1998; Murkerjee 2010; Richardson 1999).
Kaiser 1998 recruited 30 participants who were undergoing thoracotomy in a single‐centred RCT in Switzerland. Fifteen participants were allocated to each group. and they did not differ significantly in terms of age, gender, type and duration of surgical procedures and pre‐operative respiratory function. Participants were followed up for five days after surgery and data on daily VAS scores, consumption of opioid analgesics, respiratory function tests and plasma level of bupivacaine were collected. The study found PVB to be as effective as TEB in acute pain control and also evidence that reported that PVB provided better pain relief on days two and three post‐surgery than TEB
Murkerjee 2010 was a single‐centred study carried out in India which recruited 60 thoracotomy participants. Thirty participants each were randomly allocated to the TEB and PVB groups. The effectiveness of the two regional techniques was assessed by the duration of analgesia from the initial bolus, and the time point when a participant requested additional pain relief was recorded as the end of the trial. The study found that single bolus PVB provided statistically significantly longer duration of pain relief compare with TEB (PVB mean 171.66 min (SD 77.31) versus TEB mean 105.83 min (SD 33.28), P value < 0.0001).
Richardson 1999 was the largest study, with 100 participants. In five participants, the insertion of a TEB catheter was not possible and they were excluded from the study, leaving 49 participants in the TEB group and 46 participants in the PVB group. VAS scores were collected both at rest and on coughing, along with respiratory function tests, oxygen saturation, plasma level of cortisol and glucose. The study concluded that the analgesic efficacy of PVB was superior to TEB with statistically significantly lower VAS scores both at rest and on coughing (P value = 0.02 and P value = 0.0001 respectively).
Only one study provided evidence that TEB provided superior analgesia compared to PVB. Bimston 1999 was a single‐centre study that recruited 50 participants. All participants were followed up for four days during their hospital stay. The respiratory function of participants was assessed by forced expiratory volume over one second (FEV₁) and forced vital capacity (FVC) measured pre‐operatively, at one hour, eight hours, 24 hours, 48 hours and 72 hours after surgery. Serum levels of bupivacaine and fentanyl were measured every six hours post‐surgery until 72 hours. VAS scores were recorded every eight hours after the operation until 96 hours.It was the only study to conclude that TEB was superior to PVB. Statistically significantly higher VAS scores were found in the PVB group for the first 40 hours, after which differences in quality of analgesia was no longer significant.
Failure of technique
Failure of technique was often not reported as an outcome, but was included as part of general results or the description of methods. There was moderate‐quality evidence on failure of technique. Four studies with 199 participants reported number of participants where inserted technique had failed were included (Gulbahar 2010; Kaiser 1998; Perttunen 1995; Richardson 1999). There was little heterogeneity and fixed‐effect analysis was used. Our analysis suggests there was a lower risk of failure of technique in participants receiving PVB, which was statistically significant. The failure rate was 1.98% (two events in 101 participants) for PVB while the rate for TEB was 11.22% (11 events in 98 participants ) (RR 0.27, 95% CI 0.09 to 0.86, P value = 0.03, Analysis 3.4)
3.4. Analysis.
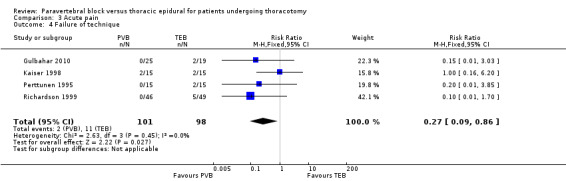
Comparison 3 Acute pain, Outcome 4 Failure of technique.
In Gulbahar 2010, it was not possible to insert a TEB catheter in two out of 19 participants; all 25 PVB catheters were inserted successfully. Perttunen 1995 reported similar findings, with two out of 15 participants in the TEB group unable to have catheters sited and none reported from the PVB group.
In Richardson 1999,TEB catheter insertion was also unsuccessful in five out of 49 participants in the TEB group compared with none from the PVB group.
Kaiser 1998 was the only study in which both TEB and PVB catheters were misplaced (two from each group of 15 participants respectively).
Supplemental analgesia consumption
The use of supplemental analgesia was not reported in detail by the included studies. Types of additional analgesia included opiates and non‐steroidal anti‐inflammatory medication (NSAIDs). There were insufficient data for meta‐analysis and we have provided a narrative description in this review.
In Casati 2006, only the number of participants requiring rescue morphine analgesia was reported, and this was found to be similar between the two groups (4/21 TEB versus 5/21 PVB, P value = 0.99).
De Cosmo 2002 reported no statistically significant difference between mean ketolorac consumption between the PVB and TEB groups (mean 72 (SD 26.5 mg) PVB versus mean 75.8 (SD 28.8 mg) TEB).
In Grider 2012, morphine patient‐controlled analgesia (PCA) was prescribed for participants if it was felt that a regional technique failed to provide adequate analgesia. There were significantly more participants that required PCA in the PVB (local anaesthetic only) group compared to the other two groups (5/23 PVB, 3/18 TEB, 1/24 TEB with added opiate, P value < 0.05).
Gulbahar 2010 and Perttunen 1995 reported no statistical difference in mean cumulative morphine consumption between the PVB and TEB groups.
Kaiser 1998 reported lower nicomorphine administration in the PVB group compared with TEB, which reached statistical significance on postoperative day two.
In Kobayashi 2013, additional analgesia was only given to participants if VAS was greater than 6 mm, but the type of analgesic given was not specified. The authors recorded the frequency in the administration of additional analgesics and found no statistically significant difference between the TEB and PVB groups at any time points (Days 0, one and two).
Messina 2009 found statistically significantly higher cumulative morphine consumption in the PVB group compared to TEB (median 36, interquartile range (IQR) 22 to 42 mg PVB versus median 9, IQR 2 to 22 mg TEB).
Pintaric 2011 reported comparable mean consumption of piritramide (synthetic opioid) between the PVB and TEB groups with no statistically significant difference at six, 24 and 48 hours after surgery.
Similar results were also seen in Richardson 1999, where cumulative morphine consumption was statistically significantly lower in the PVB group in the first and second 24‐hour period (mean 85.5 (SD 30) mg PVB versus 105.8 (SD 20.4) mg TEB; P value = 0.008 and mean 210.7 (SD 63.8) mg PVB versus 262 (SD 67) mg TEB; P value = 0.005 respectively).
2. Minor complications
In this review, the included studies did not provide enough data to allow for pooling of results. Although the number of participants who developed a minor complication was reported in some studies, it was unclear whether these participants developed one or multiple complications. We have collated all available data and have separately analysed the risk of developing minor complications.
Hypotension (not requiring inotropes)
Hypotension was the most commonly reported minor complication, with eight included studies reporting episodes of low blood pressure that did not require inotropic support. Bimston 1999 described postural hypotension in one participant each from the TEB and PVB groups, with no statistically significant differences between the two groups. All other studies reported hypotension in the TEB group only.
Casati 2006 defined hypotension as a drop of more than 30% from baseline blood pressure. Four out of 21 participants in the TEB group suffered hypotension compared with no participants in the PVB group (P value = 0.04).
In Grider 2012, three participants in the TEB group suffered persistent hypotension on postoperative day two and received local anaesthetic infusion of lower concentration, and no reported hypotension in the PVB group.
Similarly in Gulbahar 2010, two participants from the TEB group had their epidural infusions stopped temporarily due to persistent hypotension, whereas no participants from the PVB group suffered hypotension.
Ibrahim 2009 recorded regular blood pressure reading intra‐operatively and postoperatively. Mean arterial pressure in the TEB group was significantly lower than that in the PVB group 20 minutes after injection of lower anaesthetic through infusion catheters and persisted until 10 hours after surgery. Hypotention (more than 30% decrease from baseline) was found in six participants from the TEB group and none from the PVB group.
Kobayashi 2013 described hypotension requiring the use of vasopressor in two out of 35 participants (PVB group) compared to five out of 35 participants (TEB group).
In Matthews 1989, hypotension was defined as a drop of 30 mmHg from baseline blood pressure recording. One participant from the TEB group was withdrawn from the study due to intractable hypotension and six further participants (out of a total of nine) suffered hypotension. No participants from the PVB group were found to be hypotensive.
Richardson 1999 described postoperative hypotension requiring cessation of infusion in seven out of 49 participants receiving epidural analgesia. There was no postoperative hypotension in participants receiving paravertebral analgesia.
There was moderate‐quality evidence on hypotension. Data were available from eight included trials (Bimston 1999; Casati 2006; Grider 2012; Gulbahar 2010; Ibrahim 2009; Kobayashi 2013; Matthews 1989; Richardson 1999) in a total of 445 participants. Overall, the risk of hypotension was significantly lower in the PVB group compared to TEB (RR 0.16, 95% CI 0.07 to 0.38, P value < 0.0001, Analysis 4.1).
4.1. Analysis.

Comparison 4 Minor complications, Outcome 1 Hypotension.
Hypotension was not reported in Pintaric 2011 as fluid management of participants was protocolized to achieve desired oxygen delivery index (DO₂I) of more than 500 ml/min/m² by using colloid boluses (to optimize intravascular volume status), infusion of dobutamine (inotrope) and boluses of vasopressor. It was interesting to note that a significantly higher volume of colloid was required to achieve DO₂I in the TEB group compared with the PVB group (TEB 554 ml, 95% CI 456 to 652 versus PVB 196 ml, 95% CI 49 to 343, P value = 0.04). Higher doses of vasopressor were also required in the TEB group compared with the PVB group (TEB 40 µg, 95% CI 21 to 59 versus PVB 17 µg, 95% CI 8 to 25, P value = 0.04). These results suggest that the effect of TEB on the cardiovascular system was greater than PVB.
Postoperative ileus, nausea and vomiting
Postoperative ileus was not reported in any included studies. We defined nausea and vomiting as any report of either nausea or vomiting in the study participants. Our analysis found that the risk of nausea or vomiting was significantly lower in PVB (RR 0.48, 95% CI 0.30 to 0.75, I² statistic = 0%, P value = 0.001, Analysis 4.2). There was moderate‐quality evidence. Six studies with a total of 345 participants (49.4% of the total) reported postoperative nausea and vomiting (Bimston 1999; De Cosmo 2002; Ibrahim 2009; Kobayashi 2013; Perttunen 1995; Richardson 1999). Twenty‐three of 176 (13.1%) participants had nausea or vomiting following PVB, while 45/169 (26.6%) participants reported the same in the TEB group.
4.2. Analysis.

Comparison 4 Minor complications, Outcome 2 Nausea and vomiting.
Excessive sedation
We defined excessive sedation as any report of change in mental status, drowsiness or somnolence. There was moderate‐quality evidence on excessive sedation. Three included studies with a total of 175 participants documented excessive sedation (Bimston 1999; Perttunen 1995; Richardson 1999). Our analysis found that the risk of excessive sedation was lower in the PVB group compared with the TEB group but this was not statistically significant (RR 0.84, 95% CI 0.57 to 1.24, P value = 0.39, Analysis 4.3)
4.3. Analysis.
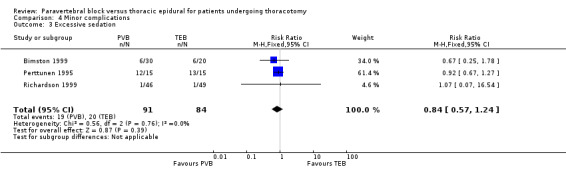
Comparison 4 Minor complications, Outcome 3 Excessive sedation.
Pruritis
There was moderate‐quality evidence on pruritis. Five included studies with 249 participants described pruritis as a minor complication from regional anaesthesia (Bimston 1999; De Cosmo 2002; Grider 2012; Gulbahar 2010; Perttunen 1995), and all reported higher incidence in the TEB group. Our analysis showed that the risk of developing pruritis was statistically significantly lower in the PVB compared to the TEB group (RR 0.29, 95% CI 0.14 to 0.59, P value = 0.0005, Analysis 4.4).
4.4. Analysis.

Comparison 4 Minor complications, Outcome 4 Pruritis.
Urinary retention
There was moderate‐quality evidence on urinary retention. Urinary retention requiring bladder catheterization was noted in five included studies with 258 participants (Bimston 1999; De Cosmo 2002; Gulbahar 2010; Matthews 1989; Richardson 1999), all reporting higher incidence of urinary retention in the TEB groups compared with the PVB groups. The risk of urinary retention was statistically significantly lower in the PVB compared to the TEB group (RR 0.22, 95% CI 0.11 to 0.46, P value < 0.0001, Analysis 4.5).
4.5. Analysis.

Comparison 4 Minor complications, Outcome 5 Urinary retention.
3. Chronic pain at six months and one year
The incidence of chronic pain was very poorly reported, with two studies describing participants complaining of pain after hospital discharge (Grider 2012; Richardson 1999). Participants from Grider 2012 were followed up at 12 months, and 11 participants complained of ongoing chest pain. Six participants were described as suffering from intercostal neuralgia (two from the PVB group and four from the TEB group) and four participants had malignancy‐related pain (one from the PVB group and three from the TEB group).
At six‐month follow‐up, 10 participants from the TEB group reported persistent burning chest pain compared to three participants from the PVB group in Richardson 1999. The chronic pain in these participants was not related to tumour recurrence or infection. There were insufficient data for statistical analysis.
4 Duration of hospital stay and cost
Duration of hospital stay was reported in six included studies, with no statistically significant differences between the intervention groups (Bimston 1999; De Cosmo 2002; Gulbahar 2010; Kaiser 1998; Perttunen 1995; Richardson 1999). Three small studies with a total of 124 participants (De Cosmo 2002; Gulbahar 2010; Kaiser 1998) reported similar duration of hospital stay between the PVB and TEB groups (MD ‐0.41 days, 95% CI ‐1.54 to 0.72, P value = 0.48, Analysis 5.1). Their results concurred with three other included studies (Bimston 1999; Perttunen 1995; Richardson 1999), which reported median duration of stay (see Table 6). There was no statistically significant difference in duration of hospital stay between the PVB and TEB groups.
5.1. Analysis.

Comparison 5 Hospital stay, Outcome 1 Duration of hospital stay.
4. Duration of hospital stay.
| Study | Number of days PVB group (median, range) | Number of days TEB group (median, range) |
| Bimston 1999 | 5 | 6 |
| Perttunen 1995 | 7.7 (6 ‐ 16) | 7.3 (5 ‐ 11) |
| Richardson 1999 | 6.7 (4 ‐ 11) | 6.7 (3 ‐ 16) |
PVB: paravertebral blockade TEB: thoracic epidural blockade
No included studies collected data on costs associated with each intervention.
Discussion
Summary of main results
The limited evidence demonstrated no difference between PVB and TEB in 30‐day mortality, major complications and length of hospital stay following thoracotomy. In terms of analgesic efficacy, PVB was comparable to TEB, with a lower risk of failure of technique. PVB had a better minor complication profile with lower incidence of hypotension, nausea and vomiting, pruritis and urinary retention. Data were insufficient to compare PVB and TEB in chronic pain and health costs.
Overall completeness and applicability of evidence
The focus of many of the studies was the analgesia provided by PVB and TEB and minor complications in the peri‐operative period. There was limited evidence that suggests no difference in terms of 30‐day mortality, major complications and length of stay between the two techniques. The studies identified were insufficient to compare PVB and TEB in terms of chronic pain and costs.
In a number of studies, different volumes and concentration of local anaesthetic were used as loading dose and infusions for the two blockades, which made it difficult to compare the results meaningfully. These differences in study methodology mean that results from our review should be interpreted with caution (Agreements and disagreements with other studies or reviews).
Outcomes reported and compared in this review are only applicable to adults undergoing elective open thoracotomy and should not be extrapolated to minimally‐invasive surgery or cardiac surgery.
Quality of the evidence
We found the quality of evidence in terms of 30‐day mortality and major complications to be of low to very low quality due to risks of bias, imprecision with low number of studies, and inconsistency. All 14 trials included in this review recruited relatively small numbers of participants, with the smallest study covering 20 participants (Matthews 1989) and the largest recruiting 100 participants (Richardson 1999). All included studies were described as RCTs but a significant proportion of the studies did not give any information on the method of randomization (eight out of 14 studies), and little effort was made to ensure allocation concealment, or blinding of participants or outcome assessors. Whilst the authors recognized that participant safety meant that it would sometimes be necessary that staff caring for participants should know to which treatment group they were allocated, the review authors believe that assessors should be blinded to minimize reporting bias in measured outcomes. Only three studies (Casati 2006; Grider 2012; Ibrahim 2009) attempted to blind participants, and four studies blinded outcome assessors (Casati 2006; Grider 2012; Ibrahim 2009; Pintaric 2011). No studies performed formal assessment of effectiveness of allocation concealment and blinding.
We found the quality of evidence in terms of analgesic efficacy to be moderate, due to the risks of bias (performance and detection bias). Acute pain was the main focus of all the included studies but the timing of VAS assessments varied (see Table 4). Although VAS requires little training to administer and score, there is no consensus on what represents a clinically meaningful difference, with some researchers suggesting a minimum difference of 1.37 cm (Hawker 2011) or 2 cm to counter imprecision (DeLoach 1998). Unfortunately, the majority of studies did not report VAS in enough detail to be included in the meta‐analysis. In some studies, it was not clear whether VAS results were tested for normality. Kaiser 1998 also reported a categorical VAS of 0 to 4 as a continuous variable (mean and SD). The duration of participant follow‐up was variable in studies, ranging from only three hours, through 48 hours and up to five days. In studies of shorter duration, regional blockade was terminated and removed early, potentially missing any associated benefits or differences between the treatment groups. Supplementary analgesia and rescue analgesia given to participants could provide a second measure of quality of pain control, but this was not measured regularly in the included studies. Two studies included participant satisfaction as an additional measure of successful pain relief (Casati 2006; De Cosmo 2002) but this could be affected by factors unrelated to pain management.
Potential biases in the review process
We strictly followed the review process recommended by Cochrane. Two review authors independently assessed for inclusion all the candidate studies we identified as a result of the search strategy. Two review authors independently extracted the data from the included studies using the agreed form. Two review authors independently assessed risks of bias for each study using the criteria outlined in the Cochrane Handbook for Systematic Reviews of Interventions (Higgins 2011). There should be no or minimal biases in the review process.
Agreements and disagreements with other studies or reviews
We identified three systematic reviews which addressed our research question and compared only PVB and TEB (Baidya 2014; Davies 2006; Norum 2010). Our findings that PVB and TEB provided comparable pain relief concurred with two of the reviews and the majority of published studies (Table 4; Baidya 2014; Davies 2006).
Davies 2006 included 10 RCTs with 520 participants undergoing thoracic surgery. They found no significant difference in VAS scores (at rest) at four to eight, 24 and 48 hours, or in morphine consumption. Similarly, Baidya 2014 reported comparable analgesia at four to eight, 24 and 48 hours, both at rest and on coughing or during movement.
Our review found that at certain time points PVB appeared to provide better analgesia, which was not the case in other reviews. This may be due to the paucity of good‐quality data and eligibility of only a few studies for meta‐analysis. We elected not to calculate the mean and SD if only median and interquartile range were reported, which was the case in Baidya 2014, due to the high level of statistical assumptions. In contrast, Norum 2010 provided a systematic narrative review, because of the heterogeneity and poor quality of the studies that were available. The authors did not feel that conclusions could be drawn from the available data on analgesia or side‐effect profile. They felt strongly that the method of insertion (level of insertion too low) and regimen (no opiate or adrenaline) employed with TEB in some published studies were suboptimal, potentially introducing prejudice against TEB. They further argued that measurement of pain at rest was not the best indicator of pain control and pain during deep inspiration was a more meaningful measure to distinguish effective from less effective analgesia. The authors also issued a warning about the apparent lack of complications in the PVB group, citing their own experience that PVB complications, although infrequent, could still be serious. Based on their findings, they could only recommend the use of PVB if TEB was not technically feasible.
Kotze 2009 carried out a systematic review into the effectiveness and safety of different techniques of paravertebral block for analgesia after thoracotomy. The authors found a trend towards improved pain relief if PVB was established prior to skin incision. This potential bias was worsened in some studies by the insertion and use of TEB pre‐operatively and during operation, thereby favouring the effects of TEB.Their review concluded that continuous infusion techniques were superior to bolus techniques for maintaining analgesia, and higher doses of local anaesthetic produced better analgesia and pulmonary function. The only reported complications from PVB were related to local anaesthetic toxicity (convulsions and cardiac arrhythmias) which resolved on termination of local anaesthetic infusion. Our review identified similar variations in PVB techniques, including timing and method of insertion, the use of bolus and infusions and different concentrations of local anaesthetic. In our review only one study (Richardson 1999) reported one participant from the PVB group and three participant from the TEB group who developed cardiac arrhythmias with unknown cause.
Joshi 2008 provided a systematic review of all regional techniques for post‐thoracotomy analgesia and included other regional blockade (intrathecal, intercostal, intrapleural) and systemic analgesia. The authors concluded that paravertebral block (local anaesthetic only) and thoracic epidural (local anaesthetic and opiate) provided the best analgesia, and that either technique could be recommended.
Overall, complications were not reported regularly. Our review found a more favourable side‐effect profile of PVB compared with TEB, which concurred with similar findings in Baidya 2014, Davies 2006 and Joshi 2008. All three reviews agreed that the incidence of major complications such as pneumonia, delirium and minor complications such as urinary retention, hypotension, pruritis and nausea and vomiting in participants, were reduced with PVB. It is important to note that all of the studies included in all of the reviews were designed to examine analgesia provided by PVB and TEB, and that complications could be underreported as a result.
Authors' conclusions
Implications for practice.
In participants undergoing thoracotomy, we found no difference between PVB and TEB in 30‐day mortality, major complications and length of hospital stay. PVB provides comparable pain relief to TEB in the immediate postoperative period, but data on chronic pain are lacking. PVB also has a more favourable minor complication profile than TEB in thoracotomy.
Implications for research.
Well‐conducted future research comparing PVB and TEB in thoracotomy should include a randomized controlled trial design, paying specific attention to randomization technique and method of blinding to minimize potential bias. Studies should try to incorporate best practice (for example, timing, method of insertion, concentration and volume of local anaesthetic), but at the same time be pragmatic in design to reflect real‐world variation in regional anaesthesia technique. Areas identified from this review that require further research include 30‐day mortality, major complications, chronic pain and health costs.
Feedback
Mistake in Plain language summary, 22 February 2016
Summary
Plain language: "PVB was associated with minor complications such as low blood pressure, nausea and vomiting, itching and urinary retention when compared to TEB". This seems to be a mistake. The results suggest the opposite.
Reply
We agree this was a typo mistake, it should be: TEB was associated with minor complications such as low blood pressure, nausea and vomiting, itching and urinary retention when compared to PVB. Thank you for picking it up. Regards Fang G Smith
Contributors
Summary
Tristan Dumbarton. I certify that I have no affiliations with or involvement in any organization or entity with a financial interest in the subject matter of my feedback.
Reply
Fang G Smith and Joyce Yeung authors of the review
What's new
| Date | Event | Description |
|---|---|---|
| 8 March 2016 | Amended | Feedback incorporated and as a result typo corrected in PLS (see Feedback) |
Acknowledgements
We would like to thank the administrative staff at the Academic Department of Anaesthesia, Resuscitation, Critical Care and Pain at the Heart of England NHS Foundation Trust, UK and Clinical Trials Unit at Warwick Medical School, UK.
We would like to thank Mike Bennett (content editor), Nathan Pace (statistical editor), Paul S Myles, Marc Gentili, Torsten Loop (peer reviewers) for their help and editorial advice during the preparation of this systematic review.
We would also like to thank Mike Bennet (content editor), Nathan Pace (statistical editor), Paul Myles, Peter Choi, Emmanual Marret (peer reviewers) and Anne Lyddiat (CARG consumer panel) for their help and editorial advice during the preparation of the protocol for the systematic review (Yeung 2011).
Appendices
Appendix 1. CENTRAL search strategy
#1 MeSH descriptor Analgesia, Epidural explode all trees #2 MeSH descriptor Anesthesia, Epidural explode all trees #3 MeSH descriptor Nerve Block explode all trees #4 MeSH descriptor Length of Stay explode all trees #5 MeSH descriptor Postoperative Nausea and Vomiting explode all trees #6 MeSH descriptor Arrhythmias, Cardiac explode all trees #7 MeSH descriptor Postoperative Complications explode all trees #8 MeSH descriptor Cost‐Benefit Analysis explode all trees #9 MeSH descriptor Pain, Postoperative explode all trees #10 epidural:ti,ab or (block near (paravertebral or extrapleural or subpleural or retropleural or intercostal)) #11 (#1 OR #2 OR #3 OR #4 OR #5 OR #6 OR #7 OR #8 OR #9 OR #10) #12 MeSH descriptor Thoracotomy explode all trees #13 Thoracotomy #14 (#12 OR #13) #15 (#11 AND #14)
Appendix 2. MEDLINE (via Ovid) search strategy
1. exp Analgesia, Epidural/ or exp Anesthesia, Epidural/ or epidural.mp. or exp Nerve Block/ or (block adj5 (paravertebral or extrapleural or subpleural or retropleural or intercostal)).mp. or "Length of Stay"/ or "Postoperative Nausea and Vomiting"/ or Arrhythmias, Cardiac/ or Postoperative Complications/ or Cost‐Benefit Analysis/ or Pain, Postoperative/ 2. Thoracotomy.af. or exp Thoracotomy/ 3. 1 and 2 4. ((randomised controlled trial or controlled clinical trial).pt. or randomized.ab. or placebo.ab. or clinical trials as topic.sh. or randomly.ab. or trial.ti.) not (animals not (humans and animals)).sh. 5. 3 and 4
Appendix 3. EMBASE (Ovid SP) search strategy
1. exp epidural anaesthesia/ or epidural.mp. or exp nerve block/ or (block adj3 (paravertebral or extrapleural or subpleural or retropleural or intercostal)).mp. or length of stay/ or postoperative nausea/ or postoperative vomiting/ or heart arrhythmia/ or postoperative complication/ or cost benefit analysis/ or postoperative pain/ 2. Thoracotomy.af. or exp thoracotomy/ 3. (placebo.sh. or controlled study.ab. or random*.ti,ab. or trial*.ti,ab. or ((singl* or doubl* or trebl* or tripl*) adj3 (blind* or mask*)).ti,ab.) not (animals not (humans and animals)).sh. 4. 1 and 2 and 3
Appendix 4. CINAHL (EBSCO host) search strategy
S1 ( (MH "Analgesia, Epidural") OR (MH "Nerve Block") OR (MH "Length of Stay") OR (MH "Postoperative Pain") OR (MH "Postoperative Complications") OR (MH "Arrhythmia, Ventricular") OR (MH "Arrhythmia, Sinus") OR (MH "Arrhythmia, Atrial") OR (MH "Cost Benefit Analysis") ) OR AB epidural OR ( block and (paravertebral or extrapleural or subpleural or retropleural or intercostal) ) S2 AB thoracotomy OR AB thoracotomy S3 S1 and S2
Appendix 5. Data extraction form
Cochrane Anaesthesia Review Group
Study Selection, Quality Assessment and Data Extraction Form
| First author | Journal/Conference Proceedings etc | Year |
| |
Study eligibility
| RCT | Relevant participants | Relevant interventions | Relevant outcomes |
| Yes / No / Unclear |
Yes / No / Unclear |
Yes / No / Unclear |
Yes / No* / Unclear |
| Do not proceed if any of the above answers are ‘No’. If study to be included in ‘Excluded studies’ section of the review, record below the information to be inserted into ‘Table of excluded studies’. |
| |
| Freehand space for comments on study design and treatment: |
References to trial
Check other references identified in searches. If there are further references to this trial link the papers now & list below. All references to a trial should be linked under one Study ID in RevMan.
| Code each paper | Author(s) | Journal/Conference Proceedings etc | Year |
| A | |||
| B | |||
Participants and trial characteristics
| Participant characteristics | |
| Further details | |
| Age (mean, median, range, etc) | |
| Sex of participants (numbers / %, etc) | |
| Disease status / type, etc (if applicable) | |
| Other | |
Methodological quality
| Allocation of intervention | |
| State here method used to generate allocation and reasons for grading | Grade (circle) |
| |
Low risk of bias |
| High risk of bias | |
| Unclear | |
|
Concealment of allocation Process used to prevent foreknowledge of group assignment in a RCT, which should be seen as distinct from blinding | |
| State here method used to conceal allocation and reasons for grading | Grade (circle) |
| Low risk of bias | |
| High risk of bias | |
| Unclear | |
| Blinding | |
| Person responsible for participants care | Low risk of bias/High risk of bias/Unclear |
| Participant | Low risk of bias/High risk of bias/Unclear |
| Outcome assessor | Low risk of bias/High risk of bias/Unclear |
| Other (please specify) | Low risk of bias/High risk of bias/Unclear |
|
Intention‐to‐treat An intention‐to‐treat analysis is one in which all the participants in a trial are analysed according to the intervention to which they were allocated, whether they received it or not. | |
| All participants entering trial | |
| 15% or fewer excluded | |
| More than 15% excluded | |
| Not analysed as ‘intention‐to‐treat’ | |
| Unclear | |
Were withdrawals described? Yes ? No ? not clear ?
Discuss if appropriate
Data extraction
Outcomes relevant to your review
| |
| Reported in paper (circle) | |
| Significant arrhythmias* | Yes / No |
| Pulmonary complications including ventilatory support* | Yes / No |
| Unexpected critical care admissions* | Yes / No |
| Further surgery* | Yes / No |
| Inotropic support* | Yes / No |
| 30 day mortality* | Yes / No |
| Analgesic efficacy (VAS, morphine, additional analgesia) | Yes / No |
| Nausea & vomiting | Yes / No |
| Failure of technique | Yes / No |
| Urinary retention | Yes / No |
| Duration of hospital stay | Yes / No |
| Cost effectiveness | Yes / No |
| For Continuous data | |||||||
| Code of paper |
Outcomes |
Unit of measurement |
Intervention group | Control group | Details if outcome only described in text | ||
| n | Mean (SD) | n | Mean (SD) | ||||
| Significant arrhythmias* | |||||||
| Pulmonary complications/ Ventilator support* |
|||||||
| Unexpected ICU admission* | |||||||
| Further surgery* | |||||||
| Inotropic support* | |||||||
| 30 day mortality* | |||||||
| Analgesic efficacy | |||||||
| N&V | |||||||
| Failure of technique | |||||||
| Urinary retention | |||||||
| Duration of hospital stay | |||||||
| Cost effectiveness | |||||||
| For Dichotomous data | |||
| Code of paper | Outcomes (rename) | Intervention group (n) n = number of participants, not number of events |
Control group (n) n = number of participants, not number of events |
| A | Significant arrhythmias* | ||
| Pulmonary complications/ Ventilator support* | |||
| Unexpected ICU admission* | |||
| Further surgery* | |||
| Inotropic support* | |||
| 30 day mortality* | |||
| Analgesic efficacy | |||
| N&V | |||
| Failure of technique | |||
| Urinary retention | |||
| Duration of hospital stay | |||
| Cost effectiveness | |||
|
Other information which you feel is relevant to the results Indicate if: any data were obtained from the primary author; if results were estimated from graphs etc; or calculated by you using a formula (this should be stated and the formula given). In general if results not reported in paper(s) are obtained this should be made clear here to be cited in review. |
| |
| Freehand space for writing actions such as contact with study authors and changes |
References to other trials
| Did this report include any references to published reports of potentially eligible trials not already identified for this review? | ||
| First author | Journal / Conference | Year of publication |
| Did this report include any references to unpublished data from potentially eligible trials not already identified for this review? If yes, give list contact name and details | ||
| | ||
| Trial characteristics | |
| Further details | |
| Single centre / Multicentre | |
| Country / Countries | |
| How was participant eligibility defined? |
|
| How many people were randomized? | |
| Number of participants in each intervention group | |
| Number of participants who received intended treatment | |
| Number of participants who were analysed | |
| Drug treatment(s) used | |
| Dose / frequency of administration | |
| Duration of treatment (State weeks / months, etc, if cross‐over trial give length of time in each arm) | |
| Median (range) length of follow‐up reported in this paper (state weeks, months or years or if not stated) | |
| Time‐points when measurements were taken during the study | |
| Time‐points reported in the study | |
| Time‐points you are using in RevMan | |
| Trial design (e.g. parallel / cross‐over*) | |
| Other | |
* If cross‐over design, please refer to the Cochrane Editorial Office for further advice on how to analyse these data
Data and analyses
Comparison 1. 30‐day mortality.
| Outcome or subgroup title | No. of studies | No. of participants | Statistical method | Effect size |
|---|---|---|---|---|
| 1 30‐day mortality | 2 | 125 | Risk Ratio (M‐H, Fixed, 95% CI) | 1.28 [0.39, 4.24] |
Comparison 2. Major complications.
| Outcome or subgroup title | No. of studies | No. of participants | Statistical method | Effect size |
|---|---|---|---|---|
| 1 Cardiovascular complications | 2 | Risk Ratio (M‐H, Random, 95% CI) | Subtotals only | |
| 1.1 Hypotension requiring inotropic support | 1 | 19 | Risk Ratio (M‐H, Random, 95% CI) | 0.30 [0.01, 6.62] |
| 1.2 Arrhythmia | 1 | 95 | Risk Ratio (M‐H, Random, 95% CI) | 0.36 [0.04, 3.29] |
| 1.3 Myocardial infarction | 1 | 95 | Risk Ratio (M‐H, Random, 95% CI) | 3.19 [0.13, 76.42] |
| 2 Respiratory complications | 5 | 280 | Risk Ratio (M‐H, Random, 95% CI) | 0.62 [0.26, 1.52] |
| 2.1 Postoperative ventilatory support | 1 | 75 | Risk Ratio (M‐H, Random, 95% CI) | 0.39 [0.02, 7.88] |
| 2.2 Acute carbon dioxide retention | 1 | 30 | Risk Ratio (M‐H, Random, 95% CI) | 1.2 [0.47, 3.09] |
| 2.3 Pneumonia | 3 | 175 | Risk Ratio (M‐H, Random, 95% CI) | 0.38 [0.10, 1.45] |
| 3 Neurological complication (Delirium) | 2 | 125 | Risk Ratio (M‐H, Fixed, 95% CI) | 0.31 [0.09, 1.00] |
| 4 Unexpected ITU admission | 2 | 139 | Risk Ratio (M‐H, Fixed, 95% CI) | 0.63 [0.19, 2.07] |
Comparison 3. Acute pain.
| Outcome or subgroup title | No. of studies | No. of participants | Statistical method | Effect size |
|---|---|---|---|---|
| 1 VAS scores 2 to 6 hours | 6 | Std. Mean Difference (IV, Random, 95% CI) | Subtotals only | |
| 1.1 VAS at rest | 6 | 239 | Std. Mean Difference (IV, Random, 95% CI) | 0.32 [‐0.30, 0.94] |
| 1.2 VAS on coughing/after physiotherapy | 3 | 126 | Std. Mean Difference (IV, Random, 95% CI) | 0.41 [‐0.20, 1.03] |
| 2 VAS scores at 24 hours | 6 | Std. Mean Difference (IV, Random, 95% CI) | Subtotals only | |
| 2.1 VAS at rest | 6 | 239 | Std. Mean Difference (IV, Random, 95% CI) | 0.16 [‐0.17, 0.48] |
| 2.2 VAS on coughing/after physiology | 3 | 126 | Std. Mean Difference (IV, Random, 95% CI) | ‐0.23 [‐0.58, 0.12] |
| 3 VAS scores at 48 hours | 5 | Std. Mean Difference (IV, Random, 95% CI) | Subtotals only | |
| 3.1 VAS at rest | 5 | 220 | Std. Mean Difference (IV, Random, 95% CI) | ‐0.12 [‐0.46, 0.22] |
| 3.2 VAS on coughing/after physiotherapy | 3 | 126 | Std. Mean Difference (IV, Random, 95% CI) | 0.25 [‐0.16, 0.66] |
| 4 Failure of technique | 4 | 199 | Risk Ratio (M‐H, Fixed, 95% CI) | 0.27 [0.09, 0.86] |
Comparison 4. Minor complications.
| Outcome or subgroup title | No. of studies | No. of participants | Statistical method | Effect size |
|---|---|---|---|---|
| 1 Hypotension | 8 | 445 | Risk Ratio (M‐H, Fixed, 95% CI) | 0.16 [0.07, 0.38] |
| 2 Nausea and vomiting | 6 | 345 | Risk Ratio (M‐H, Fixed, 95% CI) | 0.48 [0.30, 0.75] |
| 3 Excessive sedation | 3 | 175 | Risk Ratio (M‐H, Fixed, 95% CI) | 0.84 [0.57, 1.24] |
| 4 Pruritis | 5 | 249 | Risk Ratio (M‐H, Fixed, 95% CI) | 0.29 [0.14, 0.59] |
| 5 Urinary retention | 5 | 258 | Risk Ratio (M‐H, Fixed, 95% CI) | 0.22 [0.11, 0.46] |
Comparison 5. Hospital stay.
| Outcome or subgroup title | No. of studies | No. of participants | Statistical method | Effect size |
|---|---|---|---|---|
| 1 Duration of hospital stay | 3 | 124 | Mean Difference (IV, Fixed, 95% CI) | ‐0.41 [‐1.54, 0.72] |
Characteristics of studies
Characteristics of included studies [ordered by study ID]
Bimston 1999.
| Methods | Prospective, randomized trial | |
| Participants | 50 patients scheduled for open thoracotomy from 2 hospitals (Evanston Hospital, Northwestern University Western Hospital, USA) between March 1996 and February 1997. | |
| Interventions | TEB vs PVB 0.1% bupivacaine infusion. TEB inserted by anaesthetists (n=20), PVB inserted by surgeons under direct vision (n=30) | |
| Outcomes | Pulmonary function by FEV₁ and FVC; blood levels of bupivacaine and fentanyl at 6, 12, 24, 48 and 72 hrs, acute pain by VAS every 8 hrs until 96 hrs post‐op | |
| Funding sources | Supported by Lung Cancer Study Fund of Evanston Northwestern Healthcare and Evanston Faculty Practice Association, Anesthesiology Research and Development Fund. | |
| Conflict of interests | None declared | |
| Notes | Detailed description of insertion of PVB catheter, no information on care of TEB participants. 2 groups of participants were cared for in separate locations according to treatment received. TEB participants were under the care of anaesthetists and PVB participants were under surgical team | |
| Risk of bias | ||
| Bias | Authors' judgement | Support for judgement |
| Random sequence generation (selection bias) | Low risk | Random units table |
| Allocation concealment (selection bias) | Unclear risk | No information available |
| Blinding of participants and personnel (performance bias) All outcomes | High risk | 2 groups of participants were cared for in separate locations according to treatment received. TEB participants were under the care of anaesthetists and PVB participants were under surgical team |
| Blinding of outcome assessment (detection bias) All outcomes | High risk | 2 groups of participants were cared for in separate locations according to treatment received. TEB participants were under the care of anaesthetists and PVB participants were under surgical team |
| Incomplete outcome data (attrition bias) All outcomes | Low risk | All participants completed study |
| Selective reporting (reporting bias) | Unclear risk | Study was not registered on trial registration. It was not possible to assess selective reporting |
| Other bias | High risk | Surgical procedures between 2 groups were different. Higher proportion of TEB patients underwent more extensive surgery, although authors argued that participants in PVB group underwent longer surgery and suffered higher blood loss. No information on the care of TEB group described (e.g. infusion rate, rescue analgesia) |
Casati 2006.
| Methods | Prospective, randomized controlled trial | |
| Participants | 42 patients scheduled for open thoracotomy from single centre (University of Parma, Italy) | |
| Interventions | TEB (n=21) vs PVB (n=21) 0.2% ropivacaine infusion 5 ‐ 10 ml/hr. PVB inserted by 3‐injection technique and then inserted percutaneously by anaesthetists | |
| Outcomes | Acute pain scores (VAS) at rest and coughing, systolic BP, PaO₂/FiO₂, participant satisfaction | |
| Funding sources | Not specified | |
| Conflict of interests | None declared | |
| Notes | Participant follow‐up for 48 hours only | |
| Risk of bias | ||
| Bias | Authors' judgement | Support for judgement |
| Random sequence generation (selection bias) | Low risk | Computer‐generated sequence |
| Allocation concealment (selection bias) | Low risk | Sealed envelope |
| Blinding of participants and personnel (performance bias) All outcomes | Low risk | Same catheter and dressing used |
| Blinding of outcome assessment (detection bias) All outcomes | Low risk | Blinded observer |
| Incomplete outcome data (attrition bias) All outcomes | Low risk | All participants completed study |
| Selective reporting (reporting bias) | Unclear risk | Study was not registered on trial registration. It was not possible to assess selective reporting |
| Other bias | Low risk | Follow‐up was for 48 hours only |
De Cosmo 2002.
| Methods | Prospective randomized controlled trial | |
| Participants | 50 patients undergoing elective thoracotomy. Study was conducted at Universita Cattolica del Sacro Cuore in Rome, Italy. | |
| Interventions | TEB (n=25) inserted pre‐operatively, 0.2% ropivacaine 5 ml loading dose, catheter used during operation if required. For TEB, infusion of 0.2% ropivacaine with sufentanil 0.75 µg/ml at 5 ml/hr. PVB (n=25) inserted at the end of procedure, 20 ml 0.475% ropivacaine given as loading dose, followed by 0.3% ropivacaine at 5 ml/hr postoperatively. Both TEB and PVB infusions continued for 48 hours post‐surgery | |
| Outcomes | VAS at rest and during movements at 1, 4, 8, 12, 24, 36 and 48 hours post‐surgery. Pulmonary function, complications, hospital stay and participant satisfaction | |
| Funding sources | Not specified | |
| Conflict of interests | None declared | |
| Notes | ||
| Risk of bias | ||
| Bias | Authors' judgement | Support for judgement |
| Random sequence generation (selection bias) | Low risk | Computer‐generated random numbers |
| Allocation concealment (selection bias) | Unclear risk | No information available |
| Blinding of participants and personnel (performance bias) All outcomes | High risk | No method of blinding provided |
| Blinding of outcome assessment (detection bias) All outcomes | High risk | No method of blinding provided |
| Incomplete outcome data (attrition bias) All outcomes | Unclear risk | All participants completed study |
| Selective reporting (reporting bias) | Unclear risk | Study was not registered on trial registration. It was not possible to assess selective reporting |
| Other bias | Low risk | Follow‐up for 48 hours only |
Grider 2012.
| Methods | Prospective, 3‐arm randomized double‐blinded controlled trial | |
| Participants | 75 patients undergoing open thoracotomy from single site (University of Kentucky, USA) | |
| Interventions | TEB with bupivacaine ± hydromorphine (n=50), PVB with bupivacaine only (n=25) | |
| Outcomes | Acute pain VAS at rest and during incentive spirometry twice daily until day 4 morning, number of participants achieving spirometry volume > 2 L, basal infusion rates and use of PCA in each group | |
| Funding sources | Not specified | |
| Conflict of interests | None declared | |
| Notes | All participants also received 3 intercostal nerve blocks before chest closure | |
| Risk of bias | ||
| Bias | Authors' judgement | Support for judgement |
| Random sequence generation (selection bias) | Unclear risk | No information available |
| Allocation concealment (selection bias) | Unclear risk | No information available |
| Blinding of participants and personnel (performance bias) All outcomes | Low risk | Modality of analgesia that participant was not randomized to was also in place but not infused, to blind participant and personnel |
| Blinding of outcome assessment (detection bias) All outcomes | Low risk | Modality of analgesia that participant was not randomized to was also in place but not infused, to blind observer |
| Incomplete outcome data (attrition bias) All outcomes | Low risk | 6 participants did not complete study, data from participants analysed using intention‐to‐treat |
| Selective reporting (reporting bias) | Unclear risk | Study was not registered on trial registration. It was not possible to assess selective reporting |
| Other bias | Unclear risk | Participants from both groups also received 3 intercostal nerve blocks before chest closure, which can impact on pain control |
Gulbahar 2010.
| Methods | Randomized controlled trial | |
| Participants | 50 patients enrolled. Study conducted in Turkey. | |
| Interventions | Thoracic epidural inserted prior to induction of GA, 5 ml 0.25% bupivacaine followed by 0.1 ml/kg/hr infusion prior to closure (n=19) PVB catheter placed after surgical procedure. 0.1 ml/kg/hr of 0.25% bupivacaine infusion (n=25) Catheters removed day 4 |
|
| Outcomes | Serum cortisol and glucose at 15 min, 4 hr, 12 hr, 24 hr, 48 hr postop Number of participants who developed hypotension (> 20% decline in pre‐op systolic/diastolic pressure), urinary retention, sputum changes, auscultation disparities, radiological changes, temp > 38, oxygenation saturation < 90% Hospital stays Morbidities, mortality during hospital stay VAS scores, oxygen saturation, pulse, BP, spirometry (every 12 hrs), ABGs |
|
| Funding sources | Not specified | |
| Conflict of interests | None declared | |
| Notes | ||
| Risk of bias | ||
| Bias | Authors' judgement | Support for judgement |
| Random sequence generation (selection bias) | Unclear risk | No information available |
| Allocation concealment (selection bias) | Unclear risk | No information available |
| Blinding of participants and personnel (performance bias) All outcomes | High risk | No method of blinding provided |
| Blinding of outcome assessment (detection bias) All outcomes | High risk | No method of blinding provided |
| Incomplete outcome data (attrition bias) All outcomes | High risk | 6 participants with epidural. Data not included in analyses |
| Selective reporting (reporting bias) | Unclear risk | Study was not registered on trial registration. It was not possible to assess selective reporting |
| Other bias | Unclear risk | TEB catheter was used for analgesia throughout operation, PVB catheter inserted at the end only |
Ibrahim 2009.
| Methods | Randomized controlled trial | |
| Participants | 50 consecutive patients scheduled for lung resection with open thoracotomy. Study conducted in Ain Shams University, Cairo. | |
| Interventions | TEB (n=25) vs PVB (n=25) 0.375% ropivacaine at 0.1 ml/kg/hr | |
| Outcomes | Mean ABP, HR, CVP and SPO₂ were recorded pre‐operatively, immediately after induction of general anaesthesia, (5, 10,15, 20 min) after the initial bolus of ropivacaine, 15 min after skin incision, every 15 min intra‐operative, every hr for 6 hrs postop, and then every 4 hrs. PaO₂/Fio₂, PaCO₂, FVC, FEV25 ‐ 75, FEV₁/FVC, PEFR postop. Duration of the operation and intra‐operative fentanyl consumption. Also the total ropivacaine consumption. The extent of the sensory blockade was tested by loss of pin‐prick sensation, serum cortisol and glucose concentrations before the start of the operation, 15 min after maximal surgical stimulus (rib retraction), 4 hours after maximal surgical stimulus and 12 hours postoperatively. Incidence of N&V, hypotension, difficulties in breathing, VAS score every 4 hrs for first 24 hrs postop | |
| Funding sources | Not specified | |
| Conflict of interests | None declared | |
| Notes | ||
| Risk of bias | ||
| Bias | Authors' judgement | Support for judgement |
| Random sequence generation (selection bias) | Low risk | Computer‐generated numbers |
| Allocation concealment (selection bias) | Low risk | Sealed envelopes |
| Blinding of participants and personnel (performance bias) All outcomes | Low risk | Identical dressing applied to blind participant and personnel |
| Blinding of outcome assessment (detection bias) All outcomes | Low risk | Identical dressing applied to blind observer |
| Incomplete outcome data (attrition bias) All outcomes | Low risk | All participants included |
| Selective reporting (reporting bias) | Unclear risk | Study was not registered on trial registration. It was not possible to assess selective reporting |
| Other bias | Low risk | Standard general anaesthetic technique, same operating surgeon |
Kaiser 1998.
| Methods | Prospective randomized trial | |
| Participants | 30 patients undergoing open thoracotomy. Study conducted in University Hospital, Zurich. | |
| Interventions | TEB placed before induction of GA, continuous infusion (4 to 6 mL/h) of 0.5% bupivacaine during the operation; continuous infusion of 4 ‐ 8 mL/h of 0.25% to 0.375% bupivacaine with 2 mg/mL fentanyl postop (n=15). PVB placed before chest closure, infusion of 20 mL bupivacaine 0.5% over 20 min. A continuous perfusion (0.1 mL/kg/hr) with 0.5% bupivacaine with 0.05 U/mL of ornipressin (n=15) | |
| Outcomes | Acute pain 4 times/day using VAS. Daily consumption of opioid analgesics. Daily FVC, FEV₁ (best 3 consecutive measurements used). Serum levels of bupivacaine on day 1, day 3 in participants in PVB group. Serious complications. | |
| Funding sources | Not specified | |
| Conflict of interests | None declared | |
| Notes | Ornipressin is a vasoconstrictor | |
| Risk of bias | ||
| Bias | Authors' judgement | Support for judgement |
| Random sequence generation (selection bias) | Unclear risk | No information available |
| Allocation concealment (selection bias) | Unclear risk | No information available |
| Blinding of participants and personnel (performance bias) All outcomes | High risk | No method of blinding provided |
| Blinding of outcome assessment (detection bias) All outcomes | High risk | No method of blinding provided |
| Incomplete outcome data (attrition bias) All outcomes | Unclear risk | All patients completed the study. |
| Selective reporting (reporting bias) | Unclear risk | Study was not registered on trial registration. It was not possible to assess selective reporting |
| Other bias | Unclear risk | TEB placed preoperatively and used throughout the operation. PVB inserted post operatively only. |
Kobayashi 2013.
| Methods | Prospective randomized trial, non‐inferiority design | |
| Participants | 70 open thoracotomy patients undergoing pulmonary resections in Aichi Cancer Centre Hospital, Japan recruited between April and November 2008 | |
| Interventions | TEB group had catheters inserted by anaesthetists prior to start of surgery but the catheter was not used until end of surgery (n=35). PVB catheters were placed by surgeons under direct vision at the end of the procedure (n=35). Both groups of participants received an infusion of 0.2% ropivacaine with 10 mcg/ml of fentanyl for pain relief after operation. Both groups of participants received an infusion of 0.2% ropivacaine with 10 mcg/ml of fentanyl for pain relief after operation | |
| Outcomes | VAS scores and additional analgesic use were collected from both groups for 48 hours after surgery | |
| Funding sources | Not specified | |
| Conflict of interests | None declared | |
| Notes | 2 participants from TEB group received PVB as treatment instead: 1 requested PVB as treatment and TEB could not be inserted in the second participant. Data from both participants were analysed in allocated TEB in compliance with intention‐to‐treat | |
| Risk of bias | ||
| Bias | Authors' judgement | Support for judgement |
| Random sequence generation (selection bias) | Unclear risk | No information available |
| Allocation concealment (selection bias) | Unclear risk | No information available |
| Blinding of participants and personnel (performance bias) All outcomes | High risk | No method of blinding provided |
| Blinding of outcome assessment (detection bias) All outcomes | High risk | No method of blinding provided |
| Incomplete outcome data (attrition bias) All outcomes | Low risk | 2 participants from TEB group received PVB as treatment. Data included and analysed on intention‐to‐treat basis, according to original group |
| Selective reporting (reporting bias) | Unclear risk | Study was not registered on trial registration. It was not possible to assess selective reporting |
| Other bias | Low risk | Neither TEB nor PVB were used until the end of surgery |
Matthews 1989.
| Methods | Randomized controlled trial | |
| Participants | 20 patients undergoing thoracotomy and pulmonary resection. Study conducted in UK. | |
| Interventions | Epidural at T4/T5 after wound closure (n=10) Paravertebral at T4/T5 (n=10) 10 ml 0.25% bupivacaine bolus given before extubation, 3 ‐ 10 ml/hr |
|
| Outcomes | Systolic BP and urine output hourly Hypotension: decrease of BP > 30 mmHg Urine retention if catheterization is required VAS at 4, 12 and 24 hrs |
|
| Funding sources | Not specified | |
| Conflict of interests | None declared | |
| Notes | ||
| Risk of bias | ||
| Bias | Authors' judgement | Support for judgement |
| Random sequence generation (selection bias) | Unclear risk | No information available. |
| Allocation concealment (selection bias) | Unclear risk | No information available. |
| Blinding of participants and personnel (performance bias) All outcomes | High risk | No method of blinding provided |
| Blinding of outcome assessment (detection bias) All outcomes | High risk | No method of blinding provided |
| Incomplete outcome data (attrition bias) All outcomes | Low risk | Data from 1 participant out of 10 in TEB group excluded due to sustained hypotension |
| Selective reporting (reporting bias) | Unclear risk | Study was not registered on trial registration. It was not possible to assess selective reporting |
| Other bias | Unclear risk | Neither intervention was started until after the procedure |
Messina 2009.
| Methods | Prospective randomized controlled trial | |
| Participants | 24 patients undergoing thoracic surgery. Study conducted at Vita‐Salute San Raffaele University, Milan | |
| Interventions | Both PVB (n=12) and TEB (n=12) catheters were inserted percutaneously with landmark technique before induction of general anaesthesia. Infusions were started at the end of operation (0.25% levobupivacaine with fentanyl 1.6 µg/ml at 0.1 ml/kg/hr for PVB group; 0.125% levobupivacaine and fentanyl 2 µg/ml at 0.08 ml/kg/hr in TEB group) | |
| Outcomes | Cumulative dose of morphine, VAS at rest and on movement, sedation level, spirometry data (FVC, FEV₁) and arterial blood gases for 72 hrs | |
| Funding sources | Not specified | |
| Conflict of interests | None declared | |
| Notes | ||
| Risk of bias | ||
| Bias | Authors' judgement | Support for judgement |
| Random sequence generation (selection bias) | Unclear risk | No information available |
| Allocation concealment (selection bias) | Unclear risk | No information available |
| Blinding of participants and personnel (performance bias) All outcomes | High risk | No method of blinding provided |
| Blinding of outcome assessment (detection bias) All outcomes | High risk | No method of blinding provided |
| Incomplete outcome data (attrition bias) All outcomes | Low risk | All participants completed the study |
| Selective reporting (reporting bias) | High risk | VAS on movement, sedation scores and arterial blood gases were collected but not reported. Spirometry data were poorly reported |
| Other bias | Unclear risk | Institute has extensive experience in performing TEB. PVB was a new technique being acquired after 30 cases |
Murkerjee 2010.
| Methods | Prospective, randomized single‐blinded study | |
| Participants | 60 patients undergoing open thoracotomy in the Institute of Postgraduate Medical Education and Research, Kolkata, recruited between February 2007 and August 2008. | |
| Interventions | TEB vs PVB; both blocks used 30 mins prior to the end of surgery. 7.5 ml for TEB and 15 ml for thoracic PVB of 0.25% bupivacaine, along with 1 ml of fentanyl for postoperative analgesia | |
| Outcomes | Pulse rate (P), SBP, DBP and MAP, incidence of adverse events (dural puncture, failure of placement) | |
| Funding sources | Not specified | |
| Conflict of interests | None declared | |
| Notes | 1 TEB, 3 PVB vascular puncture, block successfully replaced after | |
| Risk of bias | ||
| Bias | Authors' judgement | Support for judgement |
| Random sequence generation (selection bias) | Unclear risk | No information available |
| Allocation concealment (selection bias) | Unclear risk | No information available |
| Blinding of participants and personnel (performance bias) All outcomes | High risk | No method of blinding provided |
| Blinding of outcome assessment (detection bias) All outcomes | High risk | No method of blinding provided |
| Incomplete outcome data (attrition bias) All outcomes | Low risk | All participants completed the study |
| Selective reporting (reporting bias) | Unclear risk | Study was not registered on trial registration. It was not possible to assess selective reporting |
| Other bias | Unclear risk | Short study, terminated when patients requested rescue analgesia, severity of pain not recorded |
Perttunen 1995.
| Methods | Prospective randomized study | |
| Participants | 45 patients undergoing open thoracotomy at Helsinki University Central Hospital, Finland. | |
| Interventions | Intrathoracic 4 intercostal nerve blocks by surgeons (16 ml 0.5% bupivacaine), TEB were inserted pre‐op (n=15), PVB (n=15)at chest closure by surgeon (0.25% bupivacaine 8 ‐ 12 mls at 4/6/8ml/hr infusion rate according to height of participants) | |
| Outcomes | Acute pain by VAS and VRS at rest and coughing hourly (first 6 hrs), 20, 24, 30, 48 hr. Spread of sensory block by pin prick. Incidence of adverse events (drowsiness, confusion, N&V, itchiness, abdominal pain, dizziness, hallucination, difficulties in breathing or allergic reactions), performance status. SpO₂, Hb, PCV and urine output (2 days), ABG (every 30 min until 6 hrs then 24, 48 hrs), serum bupivacaine concentration pre‐operatively, 10 min, 30 min, 60 min, 2, 4, 6 and 24 hrs | |
| Funding sources | Authors supported by Urho Kankkanen and Academy of Finland | |
| Conflict of interests | None declared | |
| Notes | 3 groups, only data from TEB and PVB group included in this review | |
| Risk of bias | ||
| Bias | Authors' judgement | Support for judgement |
| Random sequence generation (selection bias) | Unclear risk | No information available |
| Allocation concealment (selection bias) | Unclear risk | No information available |
| Blinding of participants and personnel (performance bias) All outcomes | High risk | No method of blinding provided |
| Blinding of outcome assessment (detection bias) All outcomes | High risk | No method of blinding provided |
| Incomplete outcome data (attrition bias) All outcomes | High risk | < 15% excluded, only 45 participants completed the study |
| Selective reporting (reporting bias) | Unclear risk | Study was not registered on trial registration. It was not possible to assess selective reporting |
| Other bias | Low risk | VAS scores, morphine consumption and sensory block assessed |
Pintaric 2011.
| Methods | Prospective randomized study | |
| Participants | 32 patients undergoing open thoracotomy at University Medical Centre Ljubljana, Slovenia. | |
| Interventions | Epidural analgesia (0.25% levobupivacaine and 30 µg/kg morphine, n=16) or paravertebral block (0.5% levobupivacaine and 30 µg/kg morphine, n=16) | |
| Outcomes | Oxygen delivery, stroke volume and SVR indices, HR, and MAP measurements before administration of local anaesthetic, after induction of GA, institution of 1‐lung ventilation, first skin incision, retractor placement, lung‐inflation manoeuvre, and at last skin suture. Primary end point:volume of the colloid infusion necessary to maintain oxygen delivery index of 500 mL/min per squared meter or higher. Pain, rescue‐analgesia consumption, arterial pressure, and HR were recorded at 6, 24, and 48 hrs after surgery | |
| Funding sources | Not specified | |
| Conflict of interests | None declared | |
| Notes | One participant from PVB excluded due to insufficient block | |
| Risk of bias | ||
| Bias | Authors' judgement | Support for judgement |
| Random sequence generation (selection bias) | Low risk | Computer‐generated sequence |
| Allocation concealment (selection bias) | Low risk | Sealed envelopes |
| Blinding of participants and personnel (performance bias) All outcomes | High risk | Identical dressing used to disguise group allocation |
| Blinding of outcome assessment (detection bias) All outcomes | Low risk | Identical dressing used to disguise group allocation, single‐blinded physiotherapist as observer |
| Incomplete outcome data (attrition bias) All outcomes | Low risk | One participant from PVB excluded due to insufficient block |
| Selective reporting (reporting bias) | Unclear risk | Study was not registered on trial registration. It was not possible to assess selective reporting |
| Other bias | Low risk | Both TEB and PVB inserted preoperatively and used |
Richardson 1999.
| Methods | Prospective randomized trial | |
| Participants | 100 patients undergoing planned thoracotomy at Bradford Royal Infirmary, Bradford. | |
| Interventions | TEB (0.5% bupivacaine 10 ‐ 15 ml bolus, n=54), PVB by surgeons (0.25% bupivacaine 20 ml, infusion rate at 0.1 ml/kg/hr, n=46) | |
| Outcomes | 4‐hourly VAS scores, PCA morphine requirements, sedation score, N&V, SpO₂, 12‐hourly spirometry, serum glucose and cortisol at 15 min, 4, 12, 24 hrs. Incidence of hypotension, urinary retention, postoperative pulmonary complications. N of patients complaining of pain at follow‐up clinic | |
| Funding sources | Laboratory analysis supported by Lungs for Life | |
| Conflict of interests | None declared | |
| Notes | TEB inserted at T7 ‐ 10 pre‐operatively, lower levels than levels of thoracotomy (T5/6 or T7/8) | |
| Risk of bias | ||
| Bias | Authors' judgement | Support for judgement |
| Random sequence generation (selection bias) | Low risk | Sequential allocation of computer‐generated random numbers |
| Allocation concealment (selection bias) | Unclear risk | No information available |
| Blinding of participants and personnel (performance bias) All outcomes | High risk | No method of blinding provided |
| Blinding of outcome assessment (detection bias) All outcomes | High risk | No method of blinding provided |
| Incomplete outcome data (attrition bias) All outcomes | Low risk | < 15% or fewer |
| Selective reporting (reporting bias) | Unclear risk | Study was not registered on trial registration. It was not possible to assess selective reporting |
| Other bias | Unclear risk | None identified |
ABGs: arterial blood gases
ABP: arterial blood pressure BP: blood pressure CVP: central venous pressure DBP: diastolic blood pressure FEV₁: forced expiratory volume over 1 second FVC: Forced vital capacity GA: General anaesthesia mmHg: millimetres of mercury HR: heart rate Hrs: hours Kg: kilogram MAP: mean arterial pressure min: minutes ml: millilitres mm: millimetre N&V: nausea and vomiting PaO₂: partial pressure of oxygen in arterial blood PCA: patient‐controlled analgesia PCV: packed cell volume PEFR: peak expiratory flow rate PVB: paravertebral blockade RCT: randomized controlled trial SBP: systolic blood pressure SPO₂: Oxygenation saturation T4: fourth thoracic vertebra TEB: thoracic epidural U: unit µg: microgram VAS: visual analogue scale VRS: verbal rating scale
Characteristics of excluded studies [ordered by study ID]
| Study | Reason for exclusion |
|---|---|
| Elsayed 2012 | Retrospective analysis |
| Kanazi 2012 | Subpleural analgesia technique did not constitute a paravertebral block |
| Kozar 2011 | Chronic pain measured at 3 months |
Characteristics of studies awaiting assessment [ordered by study ID]
Raveglia 2014.
| Methods | Prospective, randomized study |
| Participants | 71 patients undergoing thoracotomy |
| Interventions | Thoracic epidural, paravertebral blockade |
| Outcomes | VAS for pain control, FEV₁ and saturation for respiratory function, blood cortisol for response to pain |
| Notes | Paravertebral blockade considered as effective as thoracic epidural |
Wedad 2004.
| Methods | Unknown |
| Participants | Unknown |
| Interventions | Thoracic epidural, thoracic paravertebral and interpleural analgesia with wound infiltration. |
| Outcomes | Acute pain using VAS day 1 & 2, pethidine consumption |
| Notes | Unable to obtain a copy of this study |
FEV₁: Forced expiratory volume over 1 second VAS: Visual analogue scale
Differences between protocol and review
There has been a change from the protocol authorship (Yeung 2011), Dr Matthew Wilson has replaced Professor Martin Leuwer as one of the co‐authors of the review.
The handsearching of the Journal of Cardiothoracic Surgery and Journal of Cardiothoracic and Vascular Anesthesia (from 1996 to 2013) yielded a much higher number of articles than previously expected. The handsearching has been added to Search methods for identification of studies section.
We intended to include cluster‐randomized controlled trials but found no suitable cluster‐randomized controlled trials.
We planned to review trial protocol or registration to assess selective reporting but found no protocol or registration for included studies.
We were not able to pool results from all included studies due to high heterogeneity found in terms of technique of TEB and PVB insertion, the type of anaesthetic given through TEB and PVB, method and duration of use.
There were not enough data to allow for subgroup analyses.
Contributions of authors
Joyce HY Yeung (JY), Simon Gates (SG) Babu V Naidu (BN), Matthew JA Wilson (MW), Fang Gao Smith (FG): Conceiving the review: FG Designing the review: FG, JY, SG Co‐ordinating the review: FG Undertaking manual searches: JY, SG Screening search results: JY, SG Organizing retrieval of papers: JY, SG Screening retrieved papers against inclusion criteria: JY, SG Appraising quality of papers: JY, SG Abstracting data from papers: JY, SG Writing to authors of papers for additional information: FG Providing additional data about papers: FG Obtaining and screening data on unpublished studies: FG Data management for the review: JY Entering data into Review Manager (RevMan 5.3): JY, SG RevMan statistical data: SG Other statistical analysis not using RevMan: SG Double entry of data: (data entered by person one: JY; data entered by person two: SG) Interpretation of data: JY, SG, FG, BN Statistical inferences: SG Writing the review: JY, SG, FG, BN, MW Providing guidance on the review: FG, BN, MW Securing funding for the review: FG Performing previous work that was the foundation of the present study: FG Guarantor for the review (one author): FG Person responsible for reading and checking review before submission: FG, MW
Sources of support
Internal sources
No sources of support supplied
External sources
-
Queen Elizabeth Hospital Birmingham Charity, UK.
Small grant in support for administration required to perform review
Declarations of interest
Joyce HY Yeung: The preparation of this systematic review was supported by a small grant from Queen Elizabeth Hospital Charities (Sources of support). Joyce Yeung is a co‐applicant on NIHR Research for Patient Benefit grant, Thoracic epidural and paravertebral block in reducing chronic post‐thoracotomy pain ‐ a feasibility study. Joyce Yeung is chief investigator in Evaluation of non‐technical skills in ALS courses funded by Resuscitation Council UK Research Grant.
Simon Gates: none know
Babu V Naidu: none known
Matthew JA Wilson: Grants/grants pending: UK National Institute of Health Research. Expert testimony: medical expert witness ‐ Obstetric Anaesthesia.The financial activities listed reflect my regular salary from my main employer (Sheffield University), occasional medical expert witness work, restricted to Obstetric Anaesthesia and grants supporting my academic activities in other research areas. None of these declarations have a direct relationship to the submitted work.
Fang Gao Smith: none known
Edited (no change to conclusions)
References
References to studies included in this review
Bimston 1999 {published data only}
- Bimston D, McGee J, Liptay M, Fry W. Continuous paravertebral extrapleural infusion for post‐thoracotomy pain management. Surgery 1999;126(4):650‐7. [PUBMED: 10520911] [PubMed] [Google Scholar]
Casati 2006 {published data only}
- Casati A, Alessandrini P, Nuzzi M, Tosi M, Iotti E, Ampollini L, et al. A prospective, randomized, blinded comparison between continuous thoracic paravertebral and epidural infusion of 0.2% ropivacaine after lung resection surgery. European Journal of Anaesthesiology 2006;23(12):999‐1004. [PUBMED: 16824243] [DOI] [PubMed] [Google Scholar]
De Cosmo 2002 {published data only}
- Cosmo G, Aceto P, Campanale E, Congedo E, Clemente A, Mascia A, et al. Comparison between epidural and paravertebral intercostal nerve block with ropivacaine after thoracotomy: effects on pain relief, pulmonary function and patient satisfaction. Acta Medica Romana 2002;40(4):340‐7. [Google Scholar]
Grider 2012 {published data only}
- Grider J, Mullet T, Saha S, Harned M, Sloan P. A randomized, double‐blind trial comparing continuous thoracic epidural bupivicaine with and without opioid in contrast to a continuous paravertebral infusion of bupivicaine for post‐thoracotomy pain. Journal of Cardiothoracic and Vascular Anesthesia 2012;26(1):83‐9. [PUBMED: 22100213] [DOI] [PubMed] [Google Scholar]
Gulbahar 2010 {published data only}
- Gulbahar G, Kocer B, Muratli S, Yildirim E, Gulbahar O, Dural K, et al. A comparison of epidural and paravertebral catheterisation techniques in post‐thoracotomy pain management. European Journal of Cardio‐thoracic surgery 2010;37(2):467‐72. [PUBMED: 19709893] [DOI] [PubMed] [Google Scholar]
Ibrahim 2009 {published data only}
- Ibrahim A, Mamdouh N. Comparison between continuous thoracic epidural block and continuous thoracic paravertebral block for thoracotomy pain relief. Ain Shams Journal of Anesthesiology 2009;2:16‐26. [Google Scholar]
Kaiser 1998 {published data only}
- Kaiser A, Zollinger A, Lorenzi D, Largiader F, Weder W. Prospective, randomized comparison of extrapleural versus epidural analgesia for postthoracotomy pain. Annals of Thoracic Surgery 1998;66(2):367‐72. [PUBMED: 9725371] [DOI] [PubMed] [Google Scholar]
Kobayashi 2013 {published data only}
- Kobayashi R, Mori S, Wakai K, Fukumoto K, Saito T, Katayama T, et al. Paravertebral block via the surgical field versus epidural block for patients undergoing thoracotomy: a randomised clinical trial. Surgery Today 2013;43(9):963‐9. [PUBMED: 23702705] [DOI] [PubMed] [Google Scholar]
Matthews 1989 {published data only}
- Matthews P, Govenden V. Comparison of continuous paravertebral and extradural infusions of bupivicaine for pain relief after thoracotomy. British Journal of Anaesthesia 1989;62(2):204‐5. [PUBMED: 2923769] [DOI] [PubMed] [Google Scholar]
Messina 2009 {published data only}
- Messina M, Boroli F, Landoni G, Binami E, Dedola F, N'zepa Batonga J, et al. A comparison of epidural vs paravertebral blockade in thoracic surgery. Minerva Anestesiologica 2009;75(11):616‐21. [PUBMED: 19881458] [PubMed] [Google Scholar]
Murkerjee 2010 {published data only}
- Murkerjee M, Goswami A, Gupta S, Sarbapalli D, Pal R, Kar S. Analgesia in post‐thoracotomy patients: comparison between thoracic epidural and thoracic paravertebral blocks. Anesthesia Essays and Researches 2010;4(2):75‐80. [DOI: 10.4103/0259-1162.73511] [DOI] [PMC free article] [PubMed] [Google Scholar]
Perttunen 1995 {published data only}
- Perttunen K, Nillson E, Heinonen E, Hirvisalo J, Kalso A. Extradural, paravertebral and intercostal nerve blocks for post‐thoracotomy pain. British Journal of Anaesthesia 1995;75(5):541‐7. [PUBMED: 7577277] [DOI] [PubMed] [Google Scholar]
Pintaric 2011 {published data only}
- Pintaric T, Potocnik I, Haszic A, Stupnik T, Pintaric M, Jankovic V. Comparison of continuous thoracic epidural with paravertebral block on perioperative analgesia and haemodynamic stability in patients having open lung surgery. Regional Anesthesia and Pain Medicine 2011;36(3):256‐60. [PUBMED: 21490523] [DOI] [PubMed] [Google Scholar]
Richardson 1999 {published data only}
- Richardson J, Sabanathan S, Jones J, Shah RD, Cheema S, Mearns AJ. A prospective randomized comparison of preoperative and continuous balanced epidural or paravertebral bupivacaine on post‐thoracotomy pain, pulmonary function and stress responses. British Journal of Anaesthesia 1999;83(3):387‐92. [PUBMED: 10655907] [DOI] [PubMed] [Google Scholar]
References to studies excluded from this review
Elsayed 2012 {published data only}
- Elsayed H, McKevith J, McShane J, Scawn N. Thoracic epidural or paravertebral catheter for analgesia after lung resection: is the outcome different?. Journal of Cardiothoracic and Vascular Anesthesia 2012;26(1):78‐82. [DOI] [PubMed] [Google Scholar]
Kanazi 2012 {published data only}
- Kanazi GE, Ayoub CM, Aouad M, Abdallah F, Sfeir PM, Adham AB, et al. Subpleural block is less effective than thoracic epidural analgesia for post‐thoracotomy pain: a randomised controlled study. European Journal of Anaesthesiology 2012;29(4):186‐91. [DOI] [PubMed] [Google Scholar]
Kozar 2011 {published data only}
- Kozar S, Maric S, Jankovic VN. Development of post‐thoracotomy pain syndrome in patients undergoing lung surgery ‐ comparison of thoracic paravertebral and epidural analgesia. Periodicum Biologorum 2011;2:229‐33. [Google Scholar]
References to studies awaiting assessment
Raveglia 2014 {published data only}
- Raveglia F, Rizzi A, Mauro P, Moro DG, Leporati A, Cioffi U, et al. Epidural versus paravertebral analgesia in thoracotomy patients: a randomized, prospective study. Interactive Thoracic and Cardiovascular Surgery 2014;17(1):469‐74. [DOI] [PubMed] [Google Scholar]
Wedad 2004 {published data only}
- Wedad M, Zaki MK, Haleem M. The effect of addition of wound infiltration with local anaesthetics to interpleural block on post‐thoracotomy pain, pulmonary function and stress response in comparison to thoracic epidural and paravertebral block. Egyptian Journal of Anaesthesia 2004;20:67‐72. [Google Scholar]
Additional references
Baidya 2014
- Baidya DK, Khanna P, Maitra S. Analgesic efficacy and safety of thoracic paravertebral and epidural analgesia for thoracic surgery: a systematic review and meta‐analysis. Interactive CardioVascular and Thoracic Surgery 2014;18(5):1‐10. [DOI] [PubMed] [Google Scholar]
Benedetti 1998
- Benedetti F, Vighetti S, Ricco C, Amanzio M, Bergamasco L, Casadio C, et al. Neurophysiologic assessment of nerve impairment in posterolateral and muscle‐sparing thoracotomy. Journal of Thoracic Cardiovascular Surgery 1998;115(4):841‐7. [DOI] [PubMed] [Google Scholar]
Cook 1997a
- Cook TM, Riley RH. Analgesia following thoracotomy: a survey of Australian practice. Anaesthesia Intensive Care 1997;25(5):520‐4. [PubMed] [Google Scholar]
Cook 1997b
- Cook TM, Eaton JM, Goodwin AP. Epidural analgesia following upper abdominal surgery: United Kingdom practice. Acta Anaesthesiologica Scandanavia 1997;41(1 Part 1):18‐24. [DOI] [PubMed] [Google Scholar]
Cook 2009
- Cook TM, Counsell D, Wildsmith JAW. Major complications of neuraxial blocks: report on the third national audit project of the Royal College of Anaesthetists. British Journal of Anaesthesia 2009;102(2):179‐90. [DOI] [PubMed] [Google Scholar]
D'Arsigny 1998
- D'Arsigny C, Goldberg P. Mechanical ventilation for respiratory failure post thoracotomy. Chest Clinics of North America 1998;8(3):585‐610. [PubMed] [Google Scholar]
Daly 2009
- Daly DJ, Myles PS. Update on the role of paravertebral blocks for thoracic surgery: are they worth it?. Current Opinion in Anaesthesiology 2009;22(1):38‐43. [MEDLINE: ] [DOI] [PubMed] [Google Scholar]
Davies 2006
- Davies RG, Myles PS, Graham JM. A comparison of the analgesic efficacy and side‐effects of paravertebral vs epidural blockade for thoracotomy‐‐a systematic review and meta‐analysis of randomized trials. British Journal of Anaesthesia 2006;96(4):418‐26. [MEDLINE: ] [DOI] [PubMed] [Google Scholar]
De Cosmo 2009
- Cosmo G, Aceto P, Gualtieri E, Congedo E. Analgesia in thoracic surgery: review. Minerva Anestesiologica 2009;75(6):393‐400. [MEDLINE: ] [PubMed] [Google Scholar]
DeLoach 1998
- DeLoach LJ, Higgins MS, Caplan AB, Stiff JL. The visual analog scale in the immediate postoperative period: intrasubject variability and correlation with a numeric scale. Anesthesia & Analgesia 1998;86(1):102‐6. [DOI] [PubMed] [Google Scholar]
Egger 1997
- Egger M, Davey Smith G, Schneider M, Minder C. Bias in meta‐analysis detected by a simple, graphical test. BMJ 1997;315(7109):629‐34. [MEDLINE: ] [DOI] [PMC free article] [PubMed] [Google Scholar]
Guyatt 2008
- Guyatt GH, Oxman AD, Kunz R, Vist GE, Falck‐Ytter Y, Schunemann HJ, et al. What is "quality of evidence" and why is it important to clinicians?. BMJ 2008;336(7651):995‐8. [MEDLINE: ] [DOI] [PMC free article] [PubMed] [Google Scholar]
Harbord 2006
- Harbord RM, Egger M, Sterne JAC. A modified test for small‐study effects in meta‐analyses of controlled trials with binary endpoints. Statistics in Medicine 2006;25(20):3443‐57. [MEDLINE: ] [DOI] [PubMed] [Google Scholar]
Hawker 2011
- Hawker G, Mian S, Kendzerska T, French M. Measures of adult pain. Arthritis Care and Research 2011;63(S11):S240‐52. [DOI] [PubMed] [Google Scholar]
Higgins 2011
- Higgins JPT, Green S, (editors). Cochrane Handbook for Systematic Reviews of Interventions Version 5.1.0 [updated March 2011]. The Cochrane Collaboration, 2011. Available from www.cochrane‐handbook.org.
Joshi 2008
- Joshi GP, Bonnet F, Shah R, Wilkinson RC, Camu F, Fischer B, et al. A systematic review of randomized trials evaluating regional techniques for postthoracotomy analgesia. Anesthesia and Analgesia 2008;107(3):1026‐40. [MEDLINE: ] [DOI] [PubMed] [Google Scholar]
Katz 1996
- Katz J, Jackson M, Kavanagh BP, Sandler AN. Acute pain after thoracotomy predicts long term post‐thoracotomy pain. Clinical Journal of Pain 1996;12(1):50‐5. [DOI] [PubMed] [Google Scholar]
Kotze 2009
- Kotze A, Scally A, Howell S. Efficacy and safety of different techniques of paravertebral block for analgesia after thoracotomy: a systematic review and meta‐regression. British Journal of Anaesthesia 2009;103(5):626‐36. [MEDLINE: ] [DOI] [PubMed] [Google Scholar]
Lonnqvist 1995
- Lonnqvist PA, MacKenzie J, Soni AK, Conacher ID. Paravertebral blockade. Failure rate and complications. Anaesthesia 1995;50(9):813‐5. [MEDLINE: ] [DOI] [PubMed] [Google Scholar]
Luyet 2009
- Luyet C, Eichenberger U, Greif R, Vogt A, Szucs Farkas Z, Moriggl B. Ultrasound‐guided paravertebral puncture and placement of catheters in human cadavers: an imaging study. British Journal of Anaesthesia 2009;102(4):534‐9. [MEDLINE: ] [DOI] [PubMed] [Google Scholar]
Marret 2005
- Marret E, Bazelly B, Taylor G, Lembert N, Deleuze A, Mazoit JX, et al. Paravertebral block with ropivacaine 0.5% versus systemic analgesia for pain relief after thoracotomy. Annals of Thoracic Surgery 2005;79(6):2109‐13. [MEDLINE: ] [DOI] [PubMed] [Google Scholar]
Naja 2001
- Naja Z, Lonnqvist PA. Somatic paravertebral nerve blockade. Incidence of failed block and complications. Anaesthesia 2001;56(12):1184‐8. [MEDLINE: ] [DOI] [PubMed] [Google Scholar]
Ng 2007
- Ng A, Swanevelder J. Pain relief after thoracotomy: is epidural analgesia the optimal technique?. British Journal of Anaesthesia 2007;98(2):159‐62. [MEDLINE: ] [DOI] [PubMed] [Google Scholar]
Norum 2010
- Norum HM, Breivik H. A systematic review of comparative studies indicates that paravertebral block is neither superior or safer than epidural analgesia for pain after thoracotomy. Scandinavian Journal of Pain 2010;1:12‐23. [DOI] [PubMed] [Google Scholar]
Peters 2006
- Peters JL, Sutton AJ, Jones DR, Abrams KR, Rushton L. Comparison of two methods to detect publication bias in meta‐analysis. JAMA 2006;295(6):676‐80. [MEDLINE: ] [DOI] [PubMed] [Google Scholar]
Powell 2009
- Powell ES, Pearce AC, Cook D, Davies P, Bishay E, Bowler GMR, et al. UK pneumonectomy outcome study (UKPOS): a prospective observational study of pneumonectomy outcome. Journal of Cardiothoracic Surgery 2009;4:41. [MEDLINE: ] [DOI] [PMC free article] [PubMed] [Google Scholar]
RevMan 5.3 [Computer program]
- The Nordic Cochrane Centre, The Cochrane Collaboration. Review Manager (RevMan). Version 5.3. Copenhagen: The Nordic Cochrane Centre, The Cochrane Collaboration, 2014.
Richardson 1994
- Richardson J, Sabanathan S, Mearns AJ, Evans CS, Bembridge J, Fairbrass M. Efficacy of pre‐emptive analgesia and continuous extrapleural intercostal nerve block on post‐thoracotomy pain and pulmonary mechanics. Journal of Cardiovascular Surgery 1994;35(3):219‐28. [PubMed] [Google Scholar]
Riley 2011
- Riley RD, Higgins JPT, Deeks JJ. Interpretation of random effects meta‐analyses. BMJ 2011;342:d549. [DOI] [PubMed] [Google Scholar]
Rogers 2000
- Rogers ML, Duffy JP. Surgical aspects of chronic post‐thoracotomy pain. European Journal of Cardio‐thoracic Surgery 2000;18(6):711‐6. [DOI] [PubMed] [Google Scholar]
Shelley 2008
- Shelley B, Macfie A, Schragg S. Analgesic techniques and attitudes towards the management of hypotension and peri‐operative fluid balance in thoracic anaesthesia: a UK survey. ACTA 2008.
Wang 1999
- Wang J, Olak J, Ultmann E, Ferguson MK. Assessment of pulmonary complications after lung resection. Annals of Thoracic Surgery 1999;67(5):1444‐7. [DOI] [PubMed] [Google Scholar]
References to other published versions of this review
Yeung 2011
- Yeung JHY, Gates S, Naidu BV, Leuwer M, Gao Smith F, Wilson MJA. Paravertebral block versus thoracic epidural for patients undergoing thoracotomy. Cochrane Database of Systematic Reviews 2011, Issue 5. [DOI: 10.1002/14651858.CD009121] [DOI] [PMC free article] [PubMed] [Google Scholar]