Abstract
With the recent advancement of nanomaterials and nanostructured materials, the point-of-care biosensor devices have shown a potential growth to revolutionize the future personalized health care diagnostics and therapy practices. This chapter deals with the fundamentals of nanomaterials-based biosensors. The first chapter covers the brief details of nanotechnology with its types and an introduction to the synthesis of nanomaterials and their importance to construct transducers. The different components of transducers such as electrochemical, optical, piezoelectric, thermal, surface plasmon resonance, and so on for biosensors have been explained in this chapter. Various principles utilized for development of enzymatic biosensors, immunosensors, DNA, and whole-cell biosensors have been included in this chapter. Immobilization of bioreceptors is a crucial step to fabricate biosensors and their stepwise demonstration and conjugation of nanomaterials with nanomaterials have been described.
Keywords: Electrochemical biosensors, Immobilization, Nanomaterials, Nanotechnology, Optical biosensors
1.1.0. Introduction
Nanomaterials have recently aroused much interest due to the increased need for control of desired molecules present in the human body and environment [1], [2]. A nanomaterial comprises of nanoparticles (NPs) that are less than 100 nm at least in one dimension. The term “nanotechnology” deals with small-sized materials when the size is down to subnanometer or several hundred nanometers [3]. The controlled synthesis and tuning properties of nanomaterials require knowledge of different disciplines such as physics, chemistry, electronics, computer science, biology, engineering, agriculture, etc. that may lead to the emergence of novel and multifunctional nanotechnologies. In this context, the exciting properties of nanomaterials have attracted the world scientific community toward their application in various sectors such as health, food, security, transport, and information technology, etc. The intelligent use of nanomaterials is predicted to enhance the performance of biomolecular electronic devices with high sensitivities and detection limits.
Diagnostics is clinically important both for identification of a disease and therapeutics. Early diagnostics plays an important role to detect a disease (prevention) or the outcome of a disease (prognosis). A number of biodevices have been fabricated for studies of blood gas, glucose/lactate/cholesterol, nucleic acid sequence analysis, proteins/peptides, combinatorial synthesis, toxicity monitoring, immunoassays, environment, defense, and forensic analysis. A biosensor for blood glucose monitoring has been successfully commercialized (Fig. 1.1.1 ). Efforts are being made to enhance the resolution, accuracy, and miniaturization of biosensors for detection of biomolecules along with microfluidics and sample preprocessing [4]. Because of their portability, the short time to obtain results, biosensors have been predicted to fulfill a number of unmet needs in the diagnostics industry. Microfluidic biosensing devices offer important opportunities for research, especially for clinical diagnosis, due to their numerous advantages. These miniaturized devices require minute volumes (10−9 to 10−18 L) in micron-sized channels and containers leading to the development of a “lab-on-a-chip” [5].
Figure 1.1.1.
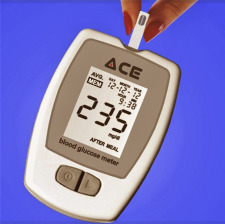
A blood glucose biosensor [63].
Nanomaterials are currently undergoing rapid development due to their potential applications in the field of nanoelectronics, catalysis, magnetic data storage, structural components, biomaterials, and biosensors [6]. The use of NPs, nanotubes, and nanowires, etc. in biosensor diagnostic devices are being explored. With the advancement in properties of nanomaterials, their dimensions at the nanoscale level, new biodevices (smart biosensors) that can detect minute concentration of a desired analyte are emerging. Nanomaterials are generally used as transducer materials that are an important part for biosensor development. A biosensor consists of four parts namely (1) bioreceptor, (2) a transducer, (3) a signal processor for converting electronic signal to a desired signal, and (4) an interface to display. A variety of samples such as body fluids, food samples, and cells culture can be explored to analyze using biosensors.
The engineered nanomaterials provide higher electrical conductivity, have nanoscale size, can be used to amplify desired signals, and are compatible with biological molecules [7]. For example, carbon materials can be utilized for conjugation of biomolecules (enzyme, antibody, DNA, cell, etc.). It has been found that the use of nanomaterials may lead to increased biosensor performance including increased sensitivities and low limit-of-detection of several orders of magnitudes. Nanostructured materials show increased surface-to-volume ratio, chemical activity, mechanical strength, electrocatalytic properties, and enhanced diffusivity. Nanomaterials have been predicted to play an important role toward the high performance of a biosensor. To probe biomolecules such as bacteria, virus, DNA, etc. biocompatibility of nanomaterials is an important factor for designing a biosensor. Nanomaterials with various applications for biosensor development are discussed in this chapter.
An important challenge is the standardization of immobilization procedure that can be utilized to intimately conjugate a biomolecule onto a nanomaterial. Therefore, the technique used to immobilize a given enzyme is one of the key factors in developing a reliable biosensor. A nanomatrix can be an excellent candidate to immobilize biomolecules on a transducer surface that can efficiently maintain bioactivity of the biomolecules. There are still many challenges such as miniaturization, automation, and integration of the nanostructured-based biosensors. The next section (Section 1.2.0) discusses the challenges and strategies currently being used for the immobilization of biomolecules onto nanomaterials (Table 1.1.1 ).
Table 1.1.1.
Advantages and Disadvantages of Biosensor Devices
| Advantage | Disadvantage |
|---|---|
| Ease of use | Quality of result |
| Portable | Clinically focused operators |
| Unprocessed samples | Inappropriate and overutilization |
| Rapid result | Cost |
| Small sample volume | Regulatory compliance |
1.2.0. Nanotechnology and Challenges
The nanomaterials have aroused much interest soon after the discovery of nanostructures in the early meteorites. Synthesis of gold NPs was the first reported by Michael Faraday on 1857. In 1940, the fumed silica NPs were synthesized and commercialized in the United States of America. In 1959, Richard Feynman, an American physicist said “there is plenty of room at the bottom” at the American Physical Society meeting held in Caltech, which was an inspiration for the evolution of nanotechnology [8]. Metallic nanopowders were developed for magnetic recording tapes in 1960. To explain semiconductor thin-film deposition and ion beam milling that exhibited a characteristic control on the nanometer scale, Norio Taniguchi, a Japanese scientist at the Tokyo University of Science, used the term “nano-technology” at a conference held in 1974 [9]. He described “nano-technology” as comprising of the process of separation, and deformation of materials by one atom or molecule. Nanocrystals were first produced by an inert-gas evaporation technique and published by Granqvist and Buhrman in 1976. Eric Drexler utilized the term “nanotechnology” and published his first research article on nanotechnology in 1981. The vision of Eric Drexler is often known as “molecular nanotechnology” or “molecular manufacturing” [10]. With two major inventions such as scanning tunneling microscope and cluster science, the nanotechnology received a boost in the early 1980s. These developments, thereafter, led to the discovery of fullerenes in 1985, and after a few years, the synthesis of “carbon nanotubes” was reported.
Nanomaterials can be defined as a set of materials having at least one dimension less than ∼100 nanometer (nm or 10−9 m) or 1–100 nm. 1 nm is one-millionth of a millimeter or ∼100,000 times smaller as compared to the diameter of a human hair. Some nanomaterials can be found naturally. Nanomaterials can be designed with specific applications and are being used already for various commercial products and processes. Because of their small size, nanomaterials exhibit unique or novel properties.
The length scale indicating the size of nanomaterials in comparison to various biological components is shown in Fig. 1.1.2 . Atoms are the basic building blocks of nature [3]. The size of an atom is measured in angstrom: 10−10 m or 0.1 nm which is comparable with the Bohr radius (0.5 nm). Two atoms provide a molecule, e.g., fullerene contains 100 atoms. The quantum effect is an important factor for the size of a semiconductor particle. The Bohr radius of a particle can be defined as ; is a dielectric constant of a material, m is the rest mass of the electron, m∗ is the particle mass, and a 0 is the Bohr radius. A 1 mm-sized cube crystal of salt can contain ∼1019 atoms or more, thus a bulk material can be made by a number of atoms. Similarly, the building blocks of living organisms are cells (size 1 μm) that consist of thousands of small and large molecules that are much larger than a NP.
Figure 1.1.2.
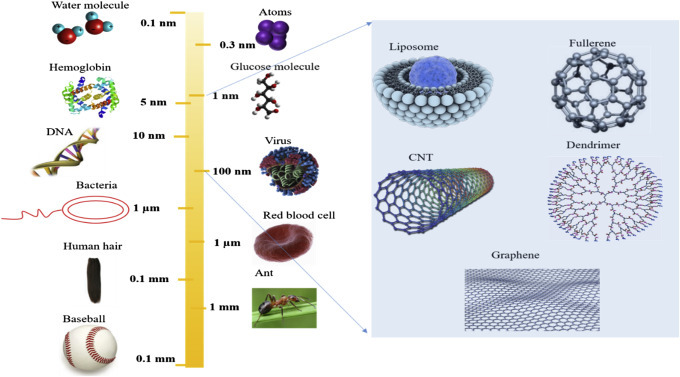
An overview of length scale for nanomaterials.
The materials at the nanoscale have interesting properties as described below:
1. Surface Area: Suppose a cube having a size of 1 cm × 1 cm × 1 cm is cut into several equal pieces ending in cubes of size 0.1 mm × 0.1 mm × 0.1 mm each. If we cut the cube, the volume of all small cubes would be the same as that of the starting cube. The surfaces of all cubes have 100 times more area than that of the cube with which we started. And if we cut more cubes of the size of 1 nm × 1 nm × 1 nm, the area of the surfaces will increase 10 million times as compared with that of the original cube. This is how nanomaterials have extremely high surface-to-volume ratio (Fig. 1.1.3 ). This allows for nanomaterials to interact with the environment or other materials strongly compared with bulk materials. In a material, the interior atoms are much more coordinated due to more bonds than surface atoms, resulting in stable atoms. At corners and edges, the atoms have less coordination leading to lesser stability than the interior atoms. The surface of a nanomaterial becomes quite reactive with nanoscale dimensions material and shows extraordinary catalytic and absorbance activity.
Figure 1.1.3.
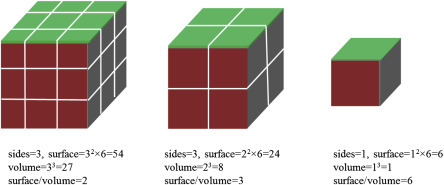
The effect of surface-to-volume ratio with reducing particle size.
2. Quantum Confinement: In quantum mechanics, the characteristic radius of an electron is defined as Bohr exciton radius. In bulk semiconductor materials, the radius of electron mobility is known to be higher than the Bohr exciton radius, with the result that mobility is not disturbed or not confined. The quantum confinement effect can be found when the size of the particle is too small to be comparable with the wavelength of the electron. When a particle size of a material becomes too small or comparable with Bohr exciton radius the electron mobility is confined. The electrons and holes are thus squeezed into small particles resulting in “quantum confinement” of the electron-hole pairs. The confinement means restricting the motion of randomly moving electrons to specific energy levels (discreteness). If a particle is of nanoscale dimensions the confining dimensions make energy levels discrete and this will increase or widen the material band gap or energy gap (Fig. 1.1.4 ). When the size of a particle becomes nearly Bohr exciton radius, the excitonic transition energy, blue shift in the absorption, and luminescence band gap energy increases due to the quantum confinement effect.
Figure 1.1.4.
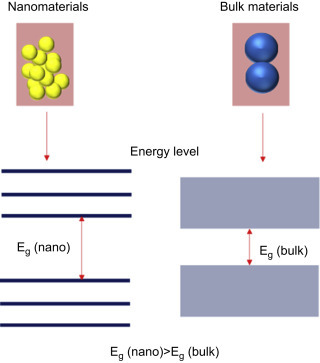
The schematic representation of an energy level diagram for nanomaterials and bulk materials.
1.2.1. Classification of Nanomaterials
Nanomaterials can be classified as per the size and dimensions. There are four types of nanomaterials such as zero dimension, one dimension, two dimensions, and three dimensions.
-
1.
Zero-dimensional: In zero-dimensional (0D) nanomaterials, all three dimensions of materials exist in nanoscale, e.g, NPs such as gold, palladium, platinum, silver, or quantum dots. NPs can be spherical in size with a diameter of 1–50 nm. It has been found that some cube and polygon shapes constitute 0D nanomaterials.
-
2.
One-dimensional: These nanomaterials having one dimension are in the range of 1–100 nm and the other two dimensions can be in macroscale. Nanowires, nanofibers, nanorods, and nanotubes are examples of one-dimensional (1D) nanomaterials. Some metals (Au, Ag, Si, etc.), metal oxides (ZnO, TiO2, CeO2, etc.), quantum dots, and others can provide 1D nanostructures.
-
3.
Two-dimensional: In this class of nanomaterials, two dimensions are in nanoscale and one dimension is in macroscale. Nano thin-films, thin-film multilayers, nanosheets, or nanowalls are two-dimensional (2D) nanomaterials. The area of 2D nanomaterials can be several square micrometers keeping thickness always in the nanoscale range.
-
4.
Three-dimensional: In three-dimensional (3D) nanomaterials, there are no dimensions in nanoscale, and all dimensions are in macroscale. Bulk materials are 3D nanomaterials that are composed of individual blocks which may be in nanometer scale (1–100 nm) or more.
In particular, charge carriers in quantum dots are considered to be confined to all 3D spaces wherein the electrons show a spectrum of discrete energy [11]. However, quantum wires can be obtained when two dimensions of the nanostructure are confined. The electrons and holes (charge carries) are confined and are free to transfer to the 2D state in a quantum well. The quantum well consists of a greater density of electronic states locate the edges of the conduction and valence bands than in bulk materials. The density of electron states in 0D, 1D, 2D, and 3D (bulk) semiconductor structure is shown in Fig. 1.1.5 , where 0D nanomaterials have well-defined and quantized energy levels. The quantum confinement effect for quantum dots and wires can be calculated by using a simple effective-mass approximation model. Considering that the barriers have an infinite confining potential, it is possible to predict the confined energy level for nanostructured materials by solving the Schrödinger equation [12]. The “effective-mass” approximation for a quantum dot or quantum wire is given by (1.1.1), (1.1.2)
| (1.1.1) |
| (1.1.2) |
Figure 1.1.5.
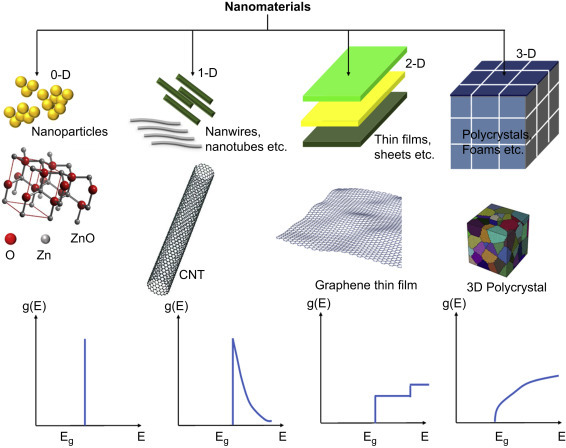
Schematic representation of zero-dimensional (0D), one-dimensional (1D), two-dimensional (2D), and three-dimensional (3D) nanomaterials and density of electron states of a semiconductor by varying dimension, where g(E) is the density of states.
1.2.2. Synthesis of Nanostructured Materials
A number of techniques can be used to produce nanomaterials in different forms such as colloidal NPs, nanoclusters, nanopowders, nanotubes, nanorods, nanowires, thin films, etc. The conventional techniques with some modification can be utilized to obtain nanomaterials. Fig. 1.1.6 shows a flow chart of different techniques that can be utilized for the synthesis of nanomaterials. The physical, chemical, biological, and hybrid techniques have been developed for the preparation of nanomaterials.
Figure 1.1.6.
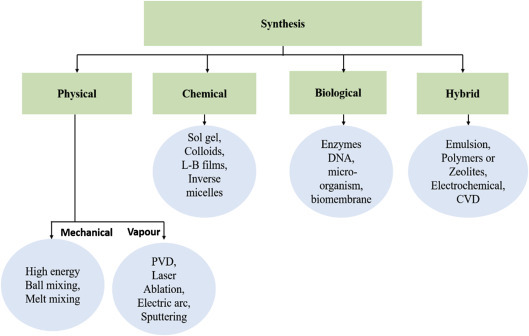
Schematic representation of different techniques that can be used for the synthesis of nanomaterials. CVD, chemical vapor deposition; L-B, langmuir blodgett; PVD, physical vapor deposition.
The selection of a synthesis technique depends on the material of interest or the type of nanomaterial such as 0D, 1D, 2D, their sizes, and the desired quantity. Fig. 1.1.7 shows morphology of some nanomaterials obtained using different techniques. Bottom-up and top-down are the main approaches for synthesis of nanostructures materials (Fig.1.1.8 ).
-
1.
Bottom–up approach: In this approach, the miniaturization of material elements (atomic level) followed by self-assembly results in the creation of nanostructures. During the self-assembly process, the basic unit of a larger structure is composed of nanostructured materials. This method has been used for the formation of quantum dots during the epitaxial growth and the formation of NPs from colloidal dispersion. This approach yields lesser defects and a more homogeneous chemical composition.
-
2.
Top–down approach: In this method, the large (macroscopic) structure can be externally controlled during processing of the desired nanostructures. Etching through the mask, ball milling, and application of severe plastic deformation are examples of this approach. A major drawback in this technique is the presence of imperfections in the surface structure. Surface defects in this approach can have an impact on physical and surface properties of NPs due to the high aspect ratio.
Figure 1.1.7.

(A) Scanning electron microscopic image of Si-based nanostructured Cu for magnetron sputtering deposition (physical) [64], (B) aligned ZnO nanotubes by chemical synthesis [65], and (C) microscopic image of silver nanoparticles (NPs) using biological synthesis [66].
Figure 1.1.8.
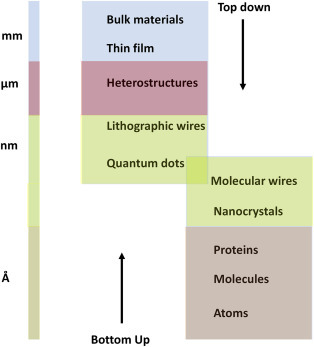
Bottom–up and top–down approaches for nanomaterials synthesis.
Nanomaterials have attracted much interest since early 1980s and are largely based on metals, metal oxides, etc. nanostructures can be prepared by various methods such as chemical, vapor, physical etc. methods. Besides this, attrition and pyrolysis have been used. In particular to pyrolysis, a vaporous liquid or gas precursor is forced by an orifice at high pressure and is burnt. Pyrolysis often results in aggregates and agglomerates rather than single primary particles. Interestingly, the chemical route for the synthesis of NPs has been developed which includes the sol–gel technique. These materials possess many attractive properties ascribed to the high volume fraction of interfacial structures. The studies have been extended to form nanocomposites with synergistic properties. Additionally, nanostructured powders such as titanium dioxide, silicon dioxide, etc. were obtained by using a flame pyrolysis process have led to commercial products. NPs, through colloidal chemistry in liquid environments, involve numerous processes in nature (e.g., the fabrication of water glass). Colloidal solution is representative of NPs stabilized in solution so as to stop aggregation. Usually, the stabilization happens due to absorption of electric charges on the surface, leading to repulsion of the NPs providing a critical distance. The use of this chemical colloidal route shows the ways pertaining to developments in research of nanomaterials synthesis. NPs and nanocomposites synthesized by chemical precipitation or in situ development in a given matrix during the sol–gel process have been explored for more than a decade. This is an interesting route for the production of nanocomposites by chemical means. The sol–gel technique is exploited for the synthesis of metal oxides starting from a chemical solution (or sol), which proceeds as the precursor to make network (or gel) with discrete particles or network polymers. In the sol–gel process, metal alkoxides and chlorides are typical precursors, wherein hydrolysis and polycondensation reactions can occur in an elastic solid network or a colloidal suspension. To facilitate a sufficient amount of dispersion of the particles, the surface should be compatible to the matrix, and surface functionalization of the NPs is crucial via suitable processing routes. The size range of NPs are found to be as nanometers (10−9 m) to micrometers (10−6 m).
The sol–gel method is known as a wet chemical process to create colloidal dispersions of inorganic and organic–inorganic nanostructures including oxides and oxide-based nanohybrids [13]. It offers many advantages including low processing temperature, molecular level homogeneity, formation of complex metal oxides, and organic–inorganic hybrid materials.
In a typical sol–gel process, hydrolysis and condensation of precursors are known to occur and are given by as (1.1.3), (1.1.4)):
Hydrolysis:
| (1.1.3) |
Condensation:
| (1.1.4) |
Both reactions are sequential, multi-step process and each reaction can be reversible. As a result of condensation, the metal oxide nanoclusters can be formed and they may embedded with organic groups due to incomplete hydrolysis reactions or introduction of nonhydrolysable organic ligands. Morphological shape and size of NPs produced by this technique can be tuned by controlling hydrolysis and condensation reactions. Fig. 1.1.9 shows a microscopic image of sol–gel preparation of ZnO/TiO2 composite nanorods.
Figure 1.1.9.
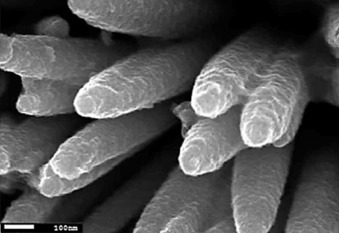
Microscopic image of sol–gel synthesis of ZnO/TiO2 composite nanorods [67].
1.2.3. Applications of Nanomaterials
Nanomaterials are being explored for applications in different disciplines including physics, medicine, biomedical, and chemistry with the aim to develop miniaturized devices. The scope of nanomaterial applications in biomedical fields is one of the important areas that is gaining momentum as all biological systems exemplify the principles of nanotechnology. An enormous impact on biology, biotechnology, and medicine of nanomaterials has been predicted due to its comparable size with biological materials including enzymes, antibodies, proteins, and nucleotides that facilitate their use in medical applications. By realizing the extraordinary properties of nanomaterials such as their high surface area, tuning property in optical emission, electrical and magnetic properties, etc., these can be exploited in bioengineering ranging from drug delivery to biosensors. A schematic of application of nanomaterials in different areas including medical, energy, electronics, and packaging is demonstrated in Fig. 1.2.0 .
Figure 1.2.0.
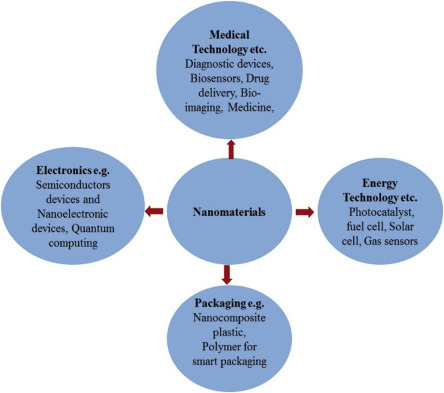
An overview of nanomaterials application in different fields.
1. Nanomaterials for Medical Technology: The applications of nanomaterials such as NPs in the medical field including point-of-care diagnostics, drug delivery, biomaterials, and imaging have led to increased interest [14]. The excellent water solubility of NPs can be utilized as a carrier for targeted drugs to the tumor sites for cancer therapeutics. Liposomes, nanogels, micelles and dendrimers, etc., are the building blocks for NPs due to their unique properties such as high degree of biodegradability, and effective endocytosis with the target cell. NPs are being investigated for the delivery of therapeutic agents, e.g., small molecule drugs, aptamer sequences, and antigenic proteins. The multifunctional NPs can be utilized as optical imaging agents for mapping of cancerous cells or as detection probes and other targeted biomolecules.
Nanomaterials can be utilized for conjugation of the antibodies, proteins, bioactive molecules, peptides, and oligonucleotides to specifically determine target receptors on cancerous tumor cells. Fig. 1.2.1 shows a schematic representation for interaction of the targeted NPs with a cell. The encapsulated NPs containing a chemotherapy drug can be targeted to the surface of cancer cells using cell-specific ligands. By recognizing specific receptors, NPs can bind to a surface cancer cell leading to internalization of the NPs by endocytosis. The NP inside the cell can undergo endosomal escape resulting in the release of drugs for treatment causing cell death (Fig. 1.2.2 ).
Figure 1.2.1.
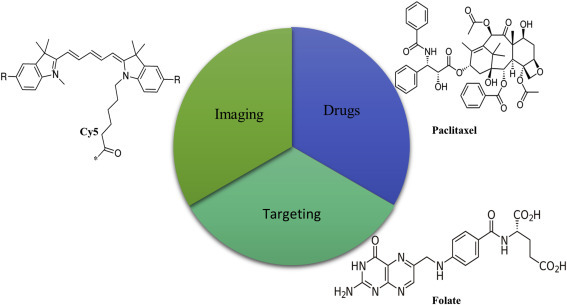
Functional nanoparticles (NPs) for quantification of cancer and therapy. A tumor-specific targeting moiety (folate molecule can recognize the folate receptor on the surface of tumor cell, Cy5 fluorescent molecule for bioimaging, and treatment agent such as chemotherapy drug paclitaxel) [14].
Figure 1.2.2.
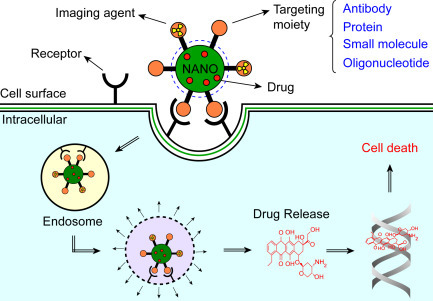
A schematic diagram for targeted multifunctional NPs [14].
The nanostructured metal NPs (gold, silver, nickel (Ni), etc.), semiconductors (TiO2, ZiO, SnO2, CeO2, etc.), and carbon materials are finding increased applications in the development of biosensor devices. This is because nanomaterials provide improved characteristics of biosensors. Besides this, they can be used to obtain enhanced immobilization of the biomolecules due to intrinsic and large surface areas. For example, a label-free, electrical detection of the severe acute respiratory syndrome virus N-protein with indium (III) oxide (In2O3) nanowire biosensors utilizing antibody mimics as capture probes has been developed [15]. Luo et al. have fabricated a boron-doped diamond nanorod-based electrode nonenzymatic glucose biosensing via amperometric technique [16]. Law et al. have reported the development of a NP-enhanced biosensor by integrating both the NPs and immunoassay sensing technologies into a phase interrogation surface plasmon resonance (SPR) system for detection of a femtomolar antigen concentration [17]. Choi et al. have developed free-standing flexible reduced-graphene-oxide/nafion hybrid films by combining self-assembly and directional convective-assembly toward the biosensor application [18]. Thus, nanomaterials can be used for immobilization of biomolecules, for amplification of signal, and as mediators, electroactive species, and detection nanoprobes. Depending on the transduction mechanism such as electrochemical, optical, thermoelectric, etc. in biosensors, nanomaterials are being utilized. A schematic of optical biosensor using a hybrid nanomaterial is shown in Fig. 1.2.3 .
Figure 1.2.3.
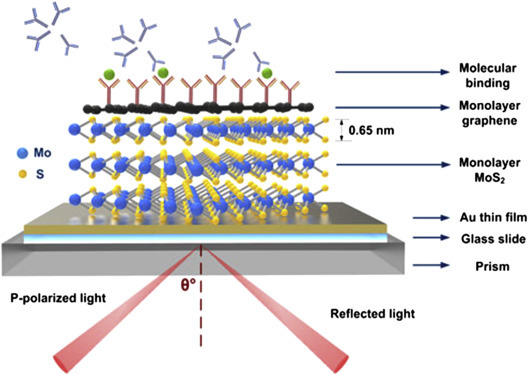
A surface plasmon resonance biosensor using graphene–MoS2 hybrid nanostructures [68].
To use a biosensor outside the laboratory, it should be simple and automated with samples processing and reagents addition. Automation and miniaturization of analytical techniques, as well as the development of online and remote sensing devices can be achieved using microfluidics. The use of NPs, nanotubes, and nanowires in microfluidic assembly is currently of much interest in various fields such as in biomedical engineering, physics, chemistry, etc. Their integration with a microfluidic platform through a combination of microfabrication and nanomaterial synthesis allows unique functionality of the device. Using this smart integrated microfluidic system, significant progress has been achieved for electrochemical and optical detection of biomolecules such as antigens, enzymes, antibodies, DNA hybridization, and oligonucleotides. Choi et al. have demonstrated the application of NPs for the detection of biomolecules, their integration with nanopatterning, and the microfluidic technologies for molecular diagnosis [19]. Lee et al. have developed an integrated zinc oxide (ZnO) surface acoustic wave microfluidics for cancer diagnostics. By using microfluidic systems, sample contamination and reaction analysis times can be reduced in a bio-detection unit [20]. Fig. 1.2.4 shows a photograph of ZnO nanowires–based electrochemical microfluidic chip for glucose monitoring [21]. Thus, in the miniature world, nanomaterials can influence to evaluate biosensing characteristics.
Figure 1.2.4.
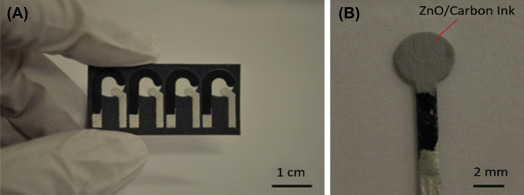
(A) An array of electrochemical microfluidic paper-based analytical device and (B) a working electrode with ZnO nanowires grown over its circular area (the gray color is from the ZnO nanowires) [21].
2. Nanomaterials for Energy: Nanomaterials have opened up new frontiers in materials to meet new challenges for efficient solar cells and fuel cells, supercapacitors, and batteries. For example, the excellent properties of carbon nanotubes (CNTs) are potentially used as anode in lithium-ion batteries. Besides this, these have been used as fuel cells, solar cells, and photovoltaic cells. The commercialization of silver NPs as an “anti-bacterial” agent by Samsung for toxicity risks to the environment and health issues. Nanomaterials (graphene, metal oxides, etc.) have been widely utilized for development of storage systems, lithium batteries, and supercapacitors. There are three major ways by which energy can be stored such as chemically, electrochemically, and electrically (Fig. 1.2.5 ). Because of the rapid economic expansion, population growth, and increasing human reliance on energy-based appliances worldwide are new types of storage devices is needed. With a higher surface area, graphene (2630 m2/g) has been explored for energy storage applications. Pumera discussed the utilization of graphene-based nanomaterials (Fig. 1.1.5) for hydrogen storage systems, lithium batteries, and supercapacitors [22].
Figure 1.2.5.
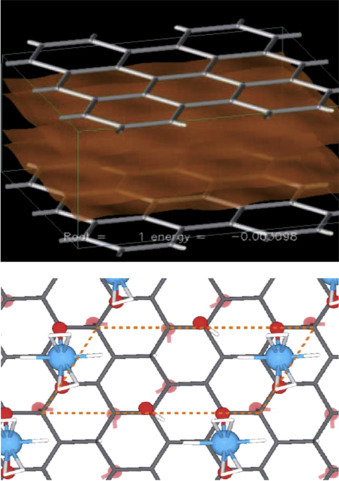
Graphene-based nanomaterials for hydrogen storage device. Storing hydrogen between spaced graphene sheets (top). Storing hydrogen on Ti atoms deposited on graphene sheets (bottom) [22].
3. Nanomaterials for electronics: Silicon wafers have been considered for construction of electronic circuits and microelectromechanical systems. Using silicon-processing technology, the commercialization of integrated circuits in the microelectronics industry began in 1965. The progress in reducing the size of circuits has increased over time. In 1965, prediction of “Moore Law” led to rapid developments of miniaturized integrated circuits via reduction of transistor dimensions, increased transistor counts, and enhanced operating frequencies. In 2000, field-effect transistor (FET) was first scaled below 100 nm, inaugurating the era of silicon nanoelectronics. In various companies including Intel, IBM, iMac G5, etc. the nanostructured materials have been considered for manufacture of chips. In this context, CNTs, graphene, fullerene, etc. and quantum dots can be explored for the electronics industries. For example, Nantero has developed a high-density nonvolatile random access memory chip known as the NRAM (nanotube-based/nonvolatile random access memory) chip using CNTs that may act as active memory elements. IBM developed CNTs-based transistors in 2006. Other nanomaterials such as ferroelectric oxides barium titanate (BaTiO3), lead zirconate titanate [Pb(Zr,Ti)O3], and barium-strontium titanate [(Ba,Sr)-TiO3] are being researched for development of transducers, actuators, and high-k dielectrics. Fig. 1.2.6 demonstrates FET electronic devices using different nanomaterials.
Figure 1.2.6.
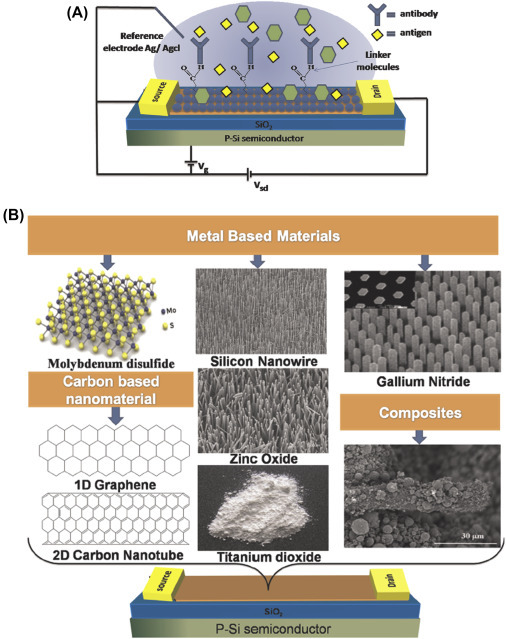
A schematic representation of field effect transistor (FET) based biosensor (A), and different nanomaterials applied to gated region of the FET device (B) [69].
1.3.0. Biosensors
Biosensors can be used to monitor environmental pollution in air, soil, water, etc.; toxic elements in food and quality control; biohazardous bacteria or virus, and biomolecules for clinical diagnostics, etc.; and to necessitate sensitive, fast, and selective equipments or tools. Biosensors have immense potential due to their inherent simplicity, low cost, fast analysis, and miniaturization, as well as easy handling. Biosensors have been predicted to have applications in military, health care, industrial process control, environmental monitoring, food control, and microbiology—bacterial and viral studies, etc. Researchers and scientists define a “bio-sensor” in different ways.
A biosensor is an analytical electronic device that generates an electronic signal by receptor–target analyte interactions. The main component in a biosensor is a bioreceptor or biologically derived sensing element that is either intimately connected or integrated with a physicochemical transducer [23]. The function of a biosensor is to produce a digital electronic signal that is directly proportional to the concentration of a target biomolecules. According to the International Union of Pure and Applied Chemistry definition, “a biosensor is a self-contained integrated device that is capable of providing specific quantitative or semi-quantitative analytical information using a biological recognition element (receptor) which is in direct spatial contact with a transducer element” [24]. In 1962, Clark and Lyons first fabricated an electrochemical biosensor by immobilizing glucose oxidase (GOD) enzyme molecules on the surface of an oxygen electrode to detect glucose concentration [25]. In the presence of GOD, glucose is converted to gluconic acid and produces two electrons and two protons resulting in a reduction of GOD (oxidized). Again, electrons, protons, oxygen, and reduced GOD react to produce hydrogen peroxide and GOD (oxidized). The increased hydrogen peroxide or reduction of oxygen content can be correlated with the glucose quantity.
In a typical biosensor, bioreceptor molecules such as enzymes, oligonucleotides, cells, antibodies, etc. can recognize the desired analytes. In addition to bioreceptor molecules, a transducer is an essential component that converts a biochemical signal to electronic signal by interaction of the bioreceptors with target analytes. The generated signal can be directly or inversely proportional to the concentration of a desired analyte. The transducer elements could be electric current, electric potential, intensity and phase of electromagnetic radiations, mass, conductance, impedance, temperature, viscosity, etc. A schematic diagram of a typical biosensor is shown in Fig. 1.2.7 . The output signal generated by a transducer can be digitized by a signal-conditioning circuit to real-time display in a liquid-crystal display monitor with the help of a microcontroller. There are three generations of biosensors. The electrode proposed by Clark in 1962 is known as first generation of biosensor, and this is oxygen dependent (Table 1.1.2 ). In this case, the product generated due to reaction can diffuse to the transducer resulting in an electrical signal. In the second generation, the biosensors do not require oxygen but need a specific mediator between the reaction and transducer to improve the response signal. In the third generation of biosensors, the reaction itself can cause the response signal, and no mediator is directly involved. Direct electron transfer (ET) between the biomolecules and the electrode excludes any intermediate ET reactions with redox species.
Figure 1.2.7.
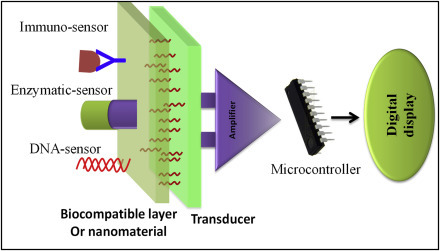
Schematic diagram showing the main components of a typical biosensor.
Table 1.1.2.
Milestones and Achievements Relevant to Biosensors [25a]
| Year | Contribution | References |
|---|---|---|
| 1956 | Leland C. Clark Jr. (1918–2005) presented his first paper about the oxygen electrode. In 1962, Clark and Ann Lyons from the Cincinnati Children's Hospital developed the first glucose enzyme electrode. | [26] |
| 1959 | Rosalyn Sussman Yalow (born 1921) and Solomon Aaron Berson (1918–72) developed the radioimmunoassay (RIA) which allows the very sensitive determination of hormones such as insulin based on an antigen–antibody reaction. Today the RIA technology is surpassed by enzyme-linked immunosorbent assay because the colorimetric or fluorescent detection principles are favored over radioactivity-based technologies. | [27] |
| 1963 | Garry A. Rechnitz together with S. Katz introduced one of the first papers in the field of biosensors with the direct potentiometric determination of urea after urease hydrolysis. At that time the term “biosensor” had not yet been coined. Thus, these types of devices were called enzyme electrodes or biocatalytic membrane electrodes. | [28] |
| 1967 | G.P. Hicks und S.J. Updike introduced the first practical enzyme electrode immobilizing the enzyme within a gel. In 1970, Bergveld introduced the ion selective field-effect transistor. | [29] |
| 1972 | Betso et al. showed for the first time that direct electron transfer of cytochrome c could be realized at mercury electrodes. | [30] |
| 1973 | Ph. Racine and W. Mindt (Hoffmann La Roche) developed a lactate electrode | [31] |
| 1975 | The first commercial biosensor was introduced for diabetic patients | [32] |
| 1976 | First microbe-based biosensors | [33] |
| 1980s | Self-assembled monolayers start to receive considerable attention in the scientific community and are employed in biosensor research. | [34] |
| 1981 | Oxidation of NADH at graphite electrodes is described for the first time | [35] |
| 1983 | First surface plasmon resonance immunosensor | [36] |
| 1984 | First ferrocene-mediated amperometric glucose biosensor by Cass et al. | [37] |
| 1988 | Adam Heller and Yinon Degani introduced the electrical connection (“wiring”) of redox centers of enzymes to electrodes through electron-conducting redox hydrogels | [38] |
| 1988 | Direct ET by means of immobilized enzymes was introduced | [39] |
| 1990 | Bartlett et al. introduce mediator-modified enzymes | [40] |
| 1997 | IUPAC introduced for the first time a definition for biosensors in analogy to the definition of chemosensors | [24] |
| 2002 | Schuhmann et al. introduced the use of electrodeposition paints as immobilization matrices for biosensors. In 2007, an implanted glucose biosensor operated for 5 days. | [41], [42] |
ET, electron transfer; IUPAC, International Union of Pure and Applied Chemistry; NADH, nicotinamide adenine dinucleotide.
1.3.1. Characteristics of a Biosensor
-
1.
Linearity: It is defined as the maximum sensor output signal that can be detected by a sensor. It should be high for a biosensor to detect substrate concentration.
-
2.
Sensitivity: It is the magnitude of electrode response per unit substrate concentration.
-
3.
Selectivity: The electrode response in the presence of other interfering chemicals or foreign materials. It is the minimal chemical interference with the target analyte. It should be minimum for a biosensor.
-
4.
Stability: It is the maximum electrode response over a period of time.
-
5.
Limit-of-detection: The lowest quantity of a substance that can be determined from the absence of that substance (blank signal). It can be calculated from the mean of the blank and its standard deviation.
1.3.2. Types of Biosensors
The components of a biosensor are listed in Fig. 1.2.8 . The types of biosensor can be categorized based on transducers and biorecognition elements that are utilized for the fabrication of a biosensor. On the basis of the transducer, a biosensor can be electrochemical (amperometric, potentiometric, impedimetric, etc.), optical (absorption, reflection, refraction, transmission, surface plasmon, fluorescence, wave guide, etc.), calorimetric, piezoelectric (acoustic wave, quartz crystal microbalance, etc.), and thermoelectric (heat). On the basis of recognition elements, biosensor could be termed as enzymatic, DNA or RNA biosensors, immunosensors (antibody, antigens, or biomarkers), whole-cell sensors, microbial biosensors, etc.
Figure 1.2.8.
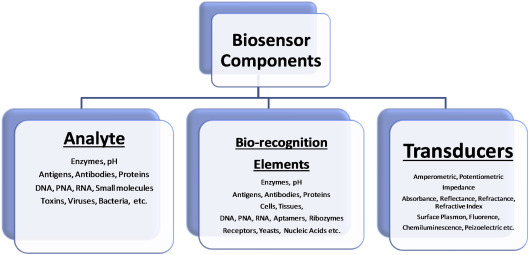
Main components of biosensors.
1.3.2.1. Electrochemical Biosensors
This category of biosensors involves an electrochemical reaction on a transducer surface between bio-receptors or biomarkers and detectable analytes and produce an electrochemical signal. The electrochemical biosensors provide label-free detection with high signal-to-volume ratio, and they can detect biomolecules without damaging the system. In this configuration, bioreceptor molecules are either coated onto or covalently bonded to a transducer surface (Fig. 1.2.9A ). The bioreceptor molecules react specifically with target biomolecules that to be detected, generated a corresponding electrical signal in terms of voltage, current, impedance, capacitance, etc. Based on the operating principle, electrochemical biosensors can be employed to work as potentiometric, capacitive, amperometric, and impedimetric transducers, convert the biological/chemical into a measurable signal. Electrochemical biosensors can be operated using an electrochemical cell. The types of electrochemical biosensors are given below:
-
1.
Amperometric: Amperometric biosensors measure either the current or potential resulting from a chemical reaction of electroactive materials on transducer surface while a constant potential or current, respectively, is applied. The change in current is related to the concentration of the target species. The working electrode (WE) of the amperometric biosensor is usually a noble metal (gold, titanium, nickel, etc.), indium tin oxide (ITO), or carbon covered by the bioreceptor elements. In an amperometric biosensor, on application of potential, the current (typically nA to mA range) due to catalytic conversion or the absorption of proteins that occurs at the electrode surface is measured.
-
2.
Potentiometric: Potentiometric biosensors can detect potential from a chemical reaction of electroactive materials when constant current is applied. Potentiometric biosensors can measure species such as pH, H+, NH4 +, and other ions, as well as biomolecules including glucose, urea, penicillin, etc. Potentiometric biosensors are based on ion-sensitive FETs (is-FETs), graphene-FET, or bioFET (Fig. 1.2.9B and C). In case of an is-FET, the output signal can be measured from ions (H+, pH etc.) accumulated at the ion-selective membrane interface. Carbon material such as graphene, CNT, etc. can be used to immobilize biomolecules for drain potential/current in FET devices. Mao et al. have grown graphene vertically for the development of FET potentiometric biosensors [43].
-
3.
Impedimetric and Capacitive: These techniques are label-free techniques and can be utilized for quantification of biomolecular interactions such as enzymatic, DNA hybridization, antigen–antibody and protein–protein interactions. A target biomolecule, when it reacts with a specific bioreceptor on sensor surface, the changes in the dielectric constant or resistance can result exclusively due to the presence of the target molecules. Thus, there is no label required for impedance sensing, which is beneficial for protein detection for the construction of third-generation biosensors. The electrical impedance is the measure of the resistance that a circuit presents to a current when a voltage is applied. It can be defined as the ratio of the voltage to the current in a given frequency domain. Impedance biosensors measure the electrical impedance generated on electrode/electrolyte interface in the alternating current (AC) steady-state under constant direct current (DC) bias conditions. In an electrochemical cell, various phenomena such as kinetics of antigen–antibody interactions, redox reactions, and other molecular interactions at the electrode surface can be considered to impede the flow of electrons in a typical AC circuit for impedance analysis. Usually, impedance is demonstrated as a complex number, where the ohmic and capacitive reactance have the real and imaginary components, respectively. To represent electrochemical impedance data are the Nyquist and Bode plots are widely used. In a typical Nyquist plot, the imaginary component (Z″, out of phase) is plotted versus the real component (Z′, in phase) by varying frequencies. But in a Bode plot, the logarithm of the absolute impedance, |Z|, and the phase shift (φ) of the impedance are displayed versus the logarithm of the applied frequency. Capacitive biosensors utilize the change in dielectric properties at the electrolyte–electrode interfaces due to the interaction of biomolecules. An ideal capacitor has the capacity to store charge, and thus the electric capacitance can be expressed as
| (1.1.5) |
where A is the area, d is the separation between the plates, is the dielectric constant, and ε is the relative static permittivity. Lee et al. have developed an impedance-based electrochemical biosensor using aptamer-functionalized pyrolyzed carbon electrode for detection of protein molecules [44]. Wang et al. fabricated a TiO2 nanowire bundle microelectrode-based impedimetric biosensor for sensitive detection of Listeria monocytogenes [45].
-
4.
Conductimetric: It can be used to quantify the change in the electrical conductivity of a cell solution. When electrochemical reactions produce electrons/ions, the conductivity of the solution is changed. The measurement of conductance has a relatively low sensitivity. With a sinusoidal applied, the generated electric field can reduce the undesirable effects including Faradaic process, concentration polarization, and double-layer charging.
Figure 1.2.9.

Example of the three-electrode microfabricated amperometric electrode screen-printed sensor [70] (A), an example of ion-sensitive field-effect transistors (FET) [71], (B) and a schematic of graphene-based FET, and potentiometric biosensor (C) [72].
1.3.2.2. Electrochemical Measurements
An example of a circuit diagram for electrochemical measurement is shown in Fig. 1.3.0 . In the potentiostatic mode, a potentiostat/galvanostat (PGstat) can be used to control the potential of a counter electrode (CE) with respect to the WE, thus, the potential difference between the WE and the reference electrode (RE) is well controlled. In the galvanostatic mode, the current flow through the WE and the CE is controlled. The potential difference of WE with respect to RE and the current flow through the WE with respect to CE are monitored continuously. With a negative feedback mechanism in PGstat, applied current or potential can be controlled during measurements.
Figure 1.3.0.
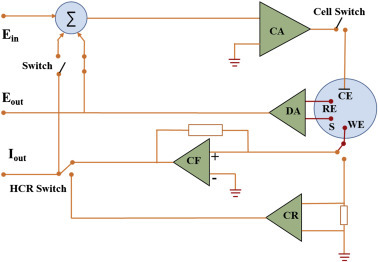
Electrochemical cell circuit for electrochemical measurement (https://www.metrohm.com/). CA, control amplifier; CF, current follower; DA, differential amplifier; Ein, input voltage; Eout, output voltage; Iout, out current.
As shown in Fig. 1.3.0, CE connects to the output of the control amplifier (CA) that forces the current in order to flow through the electrochemical cell. The current value is measured using a current follower (CF) or a shunt (CR). The potential difference of RE with respect to S is measured using a differential amplifier. Then, the signal is connected into the summation point (Σ) which couple with the waveform set by the ADC (digital-to-analog converter; E in) is used as an input for the CA. The potential difference can be measured between the RE and the S, and the current value can be measured between the WE and CE.
The counter electrode is known as the auxiliary electrode and utilized to close the current circuit in an electrochemical cell. The counter electrode can be made of platinum, indium tin oxide, gold, glassy carbon, etc. which does not play role in participating for the electrochemical activities. Generally, to complete cell reaction, a half of electrochemical cell reaction occurred at CE while half of other electrochemical cell reaction occurred at WE. That is if oxidation take place in CE then reduction will be in WE in ideal conditions.
The reference electrode is an electrode that has a stable electrode potential, and it is used for potential control. The current flow through the reference electrode is kept close to zero (ideally, zero) which is achieved by placing Ag/AgCl, calmel etc. nonpolarized electrodes in electrochemical cell. These electrodes are not polarized within a specific potential window and current will not flow through it while at same time the potential of WE electrode can be controlled. There are common uses reference electrode types:
Silver (Ag)/Silver chloride (AgCl) electrode: There is an Ag wire that is coated with AgCl and dipped into NaCl solution.
| AgCl + e− → Ag + Cl−; (E0 = +0.22V) |
Saturated calomel electrode: Calomel is the other name of mercurous chloride (Hg2Cl2).
| Hg2Cl2 → 2Hg + 2Cl2; (E0 = +0.24V) |
The working electrode is the main electrode of an electrochemical system at which the reaction of interest occurs. Working electrode can undergo oxidation or reduction and according to the reaction the WE can be referred to as cathodic or anodic. The WE can be easily made using materials such as gold, silver, platinum, indium tin oxide, glassy carbon. The size and shape of the WE also varies, and it depends on the application. There are several types of electrochemical techniques as described below:
1. Cyclic Voltammetry
This is a label-free technique and is widely used for biosensor technology. CV is used to study the interfacial electrochemical properties (surface area, concentration, roughness, diffusion coefficient, ET, etc.) of an electrode in an electrolyte solution. It can measure electrochemical current that arises due to reaction/absorption occurring at the surface of the electrode under certain conditions wherein the generated voltage can be predicted by the Nernst equation. CV can be performed by cycling the potential of a WE with respect to the RE and measuring the resulting current of WE with respect to CE. Current evolved at WE versus the applied voltage provides a typical CV of a redox reaction (Fig. 1.3.1 ). The potential of the WE is measured with respect to a RE which maintains a constant potential and produces an excitation signal. Fig. 1.3.1A shows an input excitation signal for CV measurement and Fig. 1.3.1B its output signal which is called CV resulting from a single electron reduction and oxidation.
Figure 1.3.1.
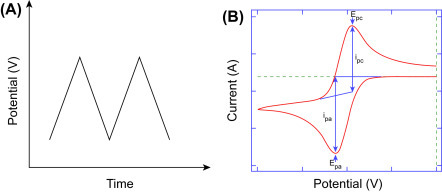
Input signal or excitation signal for cyclic voltammetry (CV) measurement (A). Output signal of a CV (B).
Considering a reversible reaction:
| (1.1.6) |
Electrode potential (E) is given by
| (1.1.7) |
where Ei, ν, and t are the potential in volts, scan rate in mV/s, and time in seconds, respectively. With an opposite potential direction, the Eq. (1.1.7) becomes:
| (1.1.8) |
where Es is also known be a potential at switching point. Electron stoichiometry (n):
| (1.1.9) |
where Epa, Epc, and n are anodic, cathodic peak potential and number of electrons involved in a redox system. The formal reduction potential (E 0) is the mean value of the E pc and E pa: E 0 = (E pa + E pc)/2. Fig. 1.3.2 describes a simple electrode reactions process with an equivalent cell circuit. A species (O) in reduction can receive an electron from the electrode diffuses away from the surface. At the electrode surface, the generated current due to electrons/ions transfers from electrode to electrolyte solution. In the electrolyte solution, current is carried by migration of ions.
Figure 1.3.2.
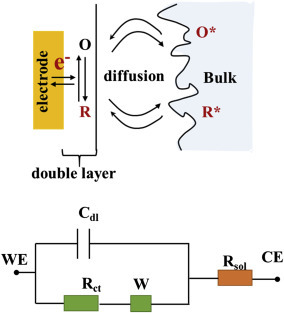
Equivalent electrochemical cell circuit that includes electron transfer along with its equivalent circuit. Cdl, double-layer capacitance; Rct, charge transfer resistance; Rsol, solution resistance; W, Warburg resistance.
In a typical CV, there are two types of current generated known as Faradaic and non-Faradaic currents (Fig. 1.3.3 ). The charge transferred across the electrified interface as a result of electrochemical oxidation and reduction of electroactive species in an electrolyte solution in known as Faradaic current. The non-Faradaic is the background current in CV. The charge associated due to transportation of electrolyte ions, adsorption or desorption, reorientation of solvent dipoles, etc. at the interface of the electrode–electrolyte is known as non-Faradaic. The capacitive current is generated due to double-layer charging and is small than that of the current from ET (Faradaic current). Faradaic current rely on on the kinetics of ET and the rate at which the redox species diffuses to the surface. According to the Nernst equation, the relationship for the potential of an electrode with the concentrations of the two species (O and R) involved in the redox reaction is given by
| (1.2.0) |
Figure 1.3.3.
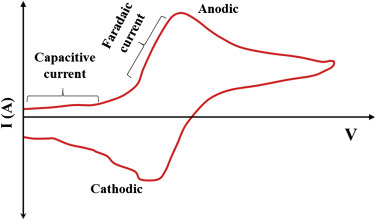
Cyclic voltammetrycurve showing the capacitive and Faradaic current.
For example, considering a redox couple , the kinetics of ET are reasonably fast, the concentrations of and at the electrode surface can be explained by the Nernst Eq. (1.2.1).
| (1.2.1) |
where E and E 0 are the applied and formal electrode potential. The concentration of is decreased at the electrode surface when the applied potential will set to more negative value and reduced to .
The mass transport in a static electrolyte to the electrode surface is known to occur via diffusion. Fick's law of diffusion associates with the time (t), distance from the electrode (x), and concentration (C ∗) to the diffusion coefficient (D). The diffusive flux according to this law move from regions of high to regions of low concentration that is directly proportional to the concentration gradient. This law can be described as
| (1.2.2) |
In a CV, the peak current of a species can be described by Randles–Sevcik equation [46] that can be obtained from Fick's law of diffusion.
| (1.2.3) |
where ip, n, A, D, C, and ν are the redox peak current (A), number of electrons that involved in a redox reaction, electrode area (cm2), diffusion coefficient (cm2/s), surface concentration (mol), and scan rate (mV/s), respectively. The electrochemically active surface area is an important factor for adsorption or desorption of adsorbate molecules. The overall charge related with adsorption or desorption of molecules provides the indication of the number of atoms present on the surface electrode. The electrical charge (Q) is defined as the integral of electrochemical cell current (I) against time (t) and can be expressed as
| (1.2.4) |
The magnitude of the adsorbates charge at the electrode surface (Q m) and the charge linked with monolayer coverage of the said adsorbate (Q ad) can be associated to the electrochemical surface area A ec (cm2) using the relation
| (1.2.5) |
The specific active surface area (S) can be thus defined as
| (1.2.6) |
where Ag and W are the geometric area (cm2) and loading of catalyst (mg/cm2), respectively. The surface roughness (R f) of an electrode is given by
| (1.2.7) |
Another important factor in CV studies is the determination of heterogeneous ET of an electrochemical electrode. The phenomenon such as electron transport between a chemical species and a solid-state electrode is known as heterogeneous ET. The Laviron method can be used for determining heterogeneous ET rate constant (k 0) and the charge-transfer coefficient, α, of a surface-controlled redox reaction using the plot between anodic and cathodic peak potentials in CV and logarithm of the scan rates [47]. For extraction of the kinetic parameters, the slopes of the linear segments are equal to 2.303RT/(1−α)nF and 2.303RT/αnF for the cathodic and anodic peaks, respectively. The (s−1) can be expressed as
| (1.2.8) |
where is the anodic and cathodic peak potential separation, R is the gas constant (8.314 J/mol), and F is the Faraday constant (96 485.3329 s A/mol). Other than evaluating electrochemical kinetic parameters, the CV technique is widely used for quantification of various biomolecules. A cholesterol biosensor has been developed by analyzing the oxidation peaks at different cholesterol concentrations from 10 to 400 mg/dL (Fig. 1.3.4 ). This biosensor utilizes sol–gel-derived nanoporous cerium oxide film as a WE while the nanoporous feature of film was utilized for conjugation of cholesterol oxidase that allows an enzymatic reaction on the sensor surface [48]. The oxidation peak of CV increases with increasing concentration of cholesterol due to the catalytic reaction on the sensor surface. Because of the wide range of potential applications in a cyclic manner, the CV spectra can identify the sensing potential at which the sensor will generate the maximum output signal to make a biosensor circuitry for commercial portable product.
Figure 1.3.4.
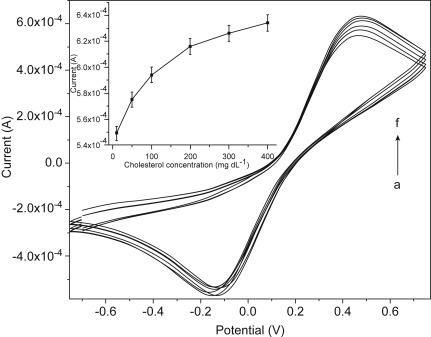
Cyclic voltammetry response curves for a cholesterol sensor by varying the concentration of cholesterol (10–400 mg/dL) at a scan rate of 50 mV/s, inset showing a plot for the oxidation peak current with respect to concentration of cholesterol solution [48].
2. Pulse Voltammetric Techniques
The voltammetric techniques measure the current in a pulsed manner (current due to charging or non-Faradaic) by changing the potential. With an applied potential in between WE and RE, the exchange of electrons occurs between the WE and the electroactive species. Charging and discharging at the electrode due to the formation of electrical double layer are responsible for change in the potential difference resulting in the introduction of capacitance (charging). For diffusion controlled reactions, while a Faradaic current decays with t −1/2, the capacitive current for the same reactions can decay exponentially over time. By sampling the currents at the end of applied pulses, we can achieve significant Faradaic currents with a negligible capacitive current. Thus, the sensitivity of the voltammetric technique can be significantly increased, and the measured current is due to the Faradaic reaction of interest. The pulse amplitude, pulse width, and sampling period are known as important parameters for all pulse voltammetry techniques.
a. Normal Pulse Voltammetry
The normal pulse voltammetry (NPV) tool utilizes a series of potential pulses with increasing amplitude (Fig. 1.3.5A ). In this technique, current is quantified at the end of each pulse where the charging current is negligible. It is usually conducted in an unstirred electrolyte using solid electrodes. The duration of the pulse (t) is about 1–100 ms, and the interval between the pulses remain about 0.1–5 s. The output signal is the sampled current displayed on the y-axis with respect to the potential to which the pulse is stepped on the x-axis. The output voltammogram has a sigmoidal shape as shown in Fig. 1.3.5B. The limiting current (i l) of an NPV is given by
| (1.2.9) |
where t m is the time after application of pulse when the current is measured.
Figure 1.3.5.

(A) Potential wave form for normal pulse voltammetry and (B) a typical normal pulse voltammogram.
b. Differential Pulse Voltammetry
The differential pulse voltammetry (DPV) technique is close to NPV. But in case of DPV, the potential scans with a series of pulses. The wave form of input and output potential for DPV is shown in Fig. 1.3.6A and consists of small pulses with a constant amplitude (∼10–100 mV). In DPV, each pulse of potential superimposes with changing base potential. The current is sampled twice for each pulse of period, first at the beginning of the applied pulse and second at the ending of the same pulse, and the difference between these two current values is displayed and plotted against the base potential. The selection of sampling points will allow for the decay of the non-Faradaic current. The output signal of DPV is shown in Fig. 1.3.6B. The current measured in DPV is much higher than NPV resulting in higher sensitivity of DPV with respect to NPV.
Figure 1.3.6.

(A) Potential wave form for differential pulse voltammetry (DPV) and (B) a typical DPV.
The DPV technique in biosensor technology is widely used for quantification of biomolecules. Like CV, this technique is also used to evaluate electrochemical parameters, as well as for sensitive detection of various biomolecules including virus, Vibrio cholerae, glucose, cholesterol, pathogens, etc. Patel et al. utilized DPV technique for detection of V. cholerae using chitosan-modified magnesium oxide NPs [73]. Fig. 1.3.7 shows the different steps of a genosensor fabrication (A and B) and DPV curves for this sensor is shown in Fig. 1.3.7C. With increasing genomic concentration of V. cholerae, the intensity of the DPV peak is found to increase. This is due to free guanine bases (unhybridized bases) of fragmented genomic DNA on intercalation with methylene blue. The enhanced redox centers present in fragmented genomic DNA of V. cholerae with methylene blue promote fast ET toward the electrode.
Figure 1.3.7.
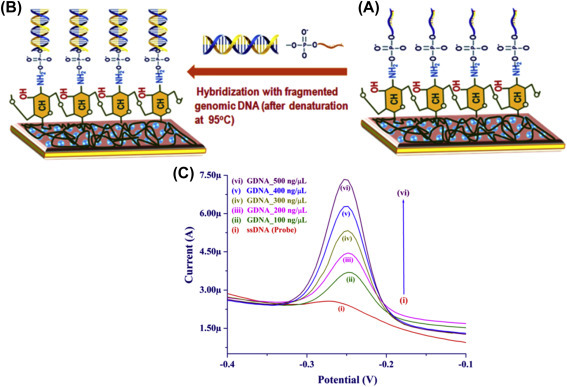
(A) Schematic showing the immobilization of single-stranded probe DNA (ssDNA) sequence of Vibrio cholerae on the surface of chitosan-modified nanostructured magnesium oxide, (B) hybridization of the fragmented genomic DNA with ssDNA, and (C) differential pulse voltammetry response studies of genosensor different concentrations of genomic DNA (GDNA) (100–500 ng/mL) [73].
c. Square Wave Voltammetry
The wave form of input and output potential for square wave voltammetry (SWV) is shown in Fig. 1.3.8A . It consists of a square wave having a constant amplitude that superimposed on a staircase wave form. The current can measure at one end of the reverse half-cycle (ir) and is subtracted from the current measured at the end of the forward half-cycle (if). The difference in current in between if and ir is displayed against applied potential. The output signal waveform is shown in Fig. 1.3.8B, and this provides a peak-shaped voltammogram. In SWV, the net current is higher than the forward or reverse currents.
Figure 1.3.8.
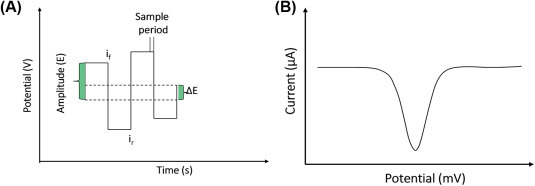
(A) Potential wave form for square wave voltammetry and (B) a typical square wave voltammogram.
SWV is the most sophisticated tool among all pulse voltammetric techniques. An ultrasensitive, label-free electrochemical biosensor [49] has been developed for determination of protein kinase activity using SWV technique (Fig. 1.3.9A ). The electrode is composed by a thiol-containing peptide monolayer on the surface of gold. The monolayer has been phosphorylated by incubation with a kinase enzyme which undergoes the conformational changes resulting in a change of electrochemical signal quantified before and after phosphorylation. By varying the concentration of protein kinase C, the peak current of SWV has been found to increase (Fig. 1.3.9B).
Figure 1.3.9.

(A) The monolayer formation with and without phosphorylation. The peptides in the monolayer are densely packed that block the redox species from the electrode and repulsion of phosphate groups after phosphorylation creates disruption in the order, resulting in the formation of pinhole. (B) Square wave voltammogram of 1 mM [Fe(CN)6]3− found at the peptide 1-modified gold electrode before [red (black in print versions)] and after (all others) the addition of 20,000 nM (6), 970 nM (5), 490 nM (4), 97 nM (3), 49 nM (2), and 10 nM (1) protein kinase C for 20 min. Scatter-line depicts the control experiment for Au electrode [blue (light gray in print versions)] [49].
3. Chronoamperometry and Chronocoulometry
For chronoamperometric measurement, the steady-state current is measured against time while a constant potential is applied between the working and reference electrode. The input and output signals in the chronoamperometric measurement are shown in Fig. 1.4.0A . A diffusion layer is created in between the electrolyte solution and electrode interface. Diffusion controls the transportation of electrolyte species or biospecies from the bulk solution of higher concentration toward electrode. As a result of this, a concentration gradient occurs from the bulk solution to the electrode surface. Cottrell equation can be used to describe this situation and is given by
| (1.3.0) |
where, i, n, F, A, D, and t are the current, number of electrons transferred in redox reaction, Faraday, electrode area, diffusion coefficient, and concentration of target and time, respectively.
Figure 1.4.0.
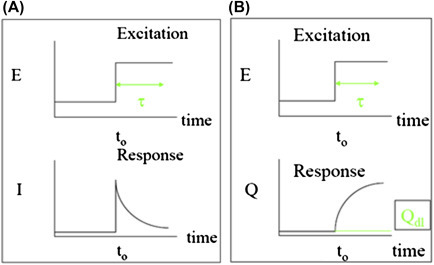
(A) Current versus time for chronoamperometric measurement and (B) charge versus time for chronocoulometric studies.
Chronocoulometry involves the measurement of charge versus time in response to an applied potential waveform (Fig. 1.4.0B). Resulting chronocoulogram can be predicted by assuming the concentration gradients in the solution near to the electrode surface. This technique is widely used for quantification of effective electrochemcial surface area, diffusion coefficient, time window, adsorption/desorption of electrospecies, rate constant, etc. for electrochemical reactions. The charge (Q) versus time (t) curve (the Anson equation) can be obtained by integrating the Cottrell equation is given by
| (1.3.1) |
The chronoamperometric technique can be used for detection of glucose and cholesterol and of other biomolecules and chemical species at constant sensing potential because it is easy and cost-effective. The nickel oxide NPs decorated on CNTs have been explored for the development of microfluidic biochip to monitor the concentration of esterified cholesterol [50] via chronoamperometric technique (Fig. 1.4.1A ). The generated current is directly proportional to the concentration of cholesterol molecules. The change in current due to catalytic reaction on the sensor surface can be quantified by the chronoamperometric technique, which is found to be sensitive at a minute concentration level of the target molecules. In this technique, the detected current is saturated within few seconds, resulting in a fast detection technique compared with other techniques (Fig. 1.4.1B).
Figure 1.4.1.
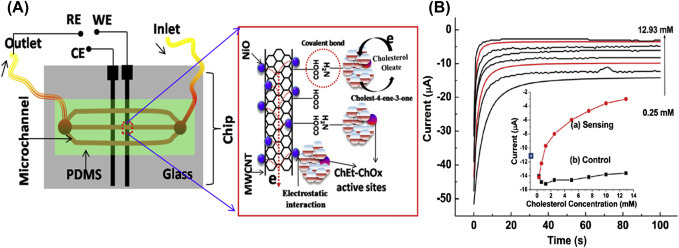
(A) The schematic of the microfluidic device used for quantification of total cholesterol using nickel oxide (NiO) nanoparticles decorated on carbon nanotubes (CNTs) and (B) the chronoamperometric response of the microfluidic device by varying cholesteryl oleate concentration (0.25–12.93 mM) (inset: the response current obtained for both (A) ChEt-ChOx/nNiO-CNT and (B) nNiO-CNT/indium tin oxide (ITO) electrodes with respect to cholesterol concentration) [50]. ChEt-ChOx, cholesterol esterase-cholesterol oxidase; MWCNT, multiwalled carbon nanotubes; PDMS, polydimethylsiloxane.
4. Impedance Spectroscopy
The electrochemical impedance measures the capacity of a circuit to resist the flow of electrical current. It can be measured by applying a sinusoidal AC potential to an electrochemical cell and then, measures the current flow through the cell [51]. The current signal can be demonstrated as a sum of sinusoidal functions (a Fourier series). The excitation signal can be explained as a function of time and is given by
| (1.3.2) |
where, is the potential at time t, is the amplitude of the signal, and is the radial frequency. The relationship of radial frequency (ω, radians/s) with frequency f (Hz) is expressed as
| (1.3.3) |
In a linear system, the response signal, , is shifted in phase, φ, and has a different amplitude,.
| (1.3.4) |
The impedance (Z) can be defined as the ratio of the incremental change in voltage, to the resulting change in current,, and Z can be written as Eq. (1.3.5).
| (1.3.5) |
where Y is the complex admittance, and the impedance is demonstrated either by the modulus and the phase shift φ or by its real (Z′) and imaginary (Z″). The impedance is then explained as a complex number,
| (1.3.6) |
The Randles circuit is an equivalent electrical circuit and is used to measure impedance consisting of an active solution resistance R S in series with R ct (charge transfer resistance) and in parallel combination of the double-layer capacitance C dl or constant phase element (CPE) of a Faradaic reaction. A typical Nyquist plot contains a semicircle region followed by a straight line lying on the real axis. The linear part (Ψ = π/4), found in the low frequency range, indicates a mass-transfer limited process, whereas the semicircle portion in the high-frequency range, indicates a charge-transfer limited process (Fig. 1.4.2B). Both Nyquist and Bode plots can be used to measure the relative change in surface-charge resistance. Interfacial R ct and C dl in the Nyquist plot are obtained from real (Z′) and imaginary (−Z″) impedance as a function of frequency using the following Eq. (1.3.7) for a parallel RC circuit.
| (1.3.7) |
where Rs and Rct are the solution resistance and charge transfer resistance, respectively. The frequency linked with maximum (−Z″) and R ct are used to calculate C dl using Eq. (1.3.8).
| (1.3.8) |
where and are the time constant and maximum frequency. The Warburg resistance (Z w) also can be calculated from the Nyquist plot and is demonstrated by an intercept of a straight line having a slope of unity and is given by in the following Eq. 1.3.9.
| (1.3.9) |
where , and are forward and backward electron-transfer rate constants; and are the diffusion coefficient of the oxidant and reductant. The ET rate (k 0) of an electrode can be calculated by using charge transfer kinetics:
| (1.4.0) |
where R, T, n, F, A, and C are the gas constant, temperature, number of electrons in a redox couple, effective area, and concentration of redox species.
Figure 1.4.2.
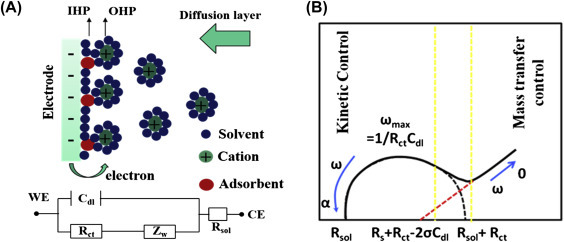
(A) Schematic of a negatively charged electrified electrode wherein the cations are aligned on the interface (top). Electrical circuit elements correspond to each interface component (bottom), where Cdl is the double-layer capacitor, IHP is the inner Helmholtz plane, OHP is the outer Helmholtz plane, Rct is the polarization resistance, Rs is the solution resistance, and ZW is Warburg impedance. (B) A Nyquist plot of electrochemical impedance spectroscopy (EIS) measurement showing the semicircle and straight regions indicating kinetic and mass transfer control.
To interpret electrochemical impedance spectroscopy (EIS) experimental data, Randles equivalent circuit (Fig. 1.4.2A ) can be to calculate the electrolyte (R S), in series with the double-layer capacitance (C dl), charge-transfer resistance (R CT), and Warburg impedance (Z w). At high frequency, the imaginary component moves downward to zero because it provides no impedance. As the frequency drops, the capacitance C dl provides high impedance and as a consequence current flows through R CT and R S. The Cdl or CPE can be estimated from the frequency at the maximum of the semicircle (ω = 2f = 1/R ct C dl). The R ct and the C dl are the most important electrical parameters in analyzing for antibody–antigen interaction.
1. Electrolyte Resistance: It is a resistance due to ionic solution. This resistance value depends on the concentration ions, type, temperature, pH, and geometry of the area in which current is conducted.
2. Double-Layer Capacitance: An electrical double layer is formed at the interface between the electrode and electrolyte solution. The charged electrode is separated from the charged ions which form a capacitor. The double-layer capacitance value rely on several factors such as the potential, ionic concentration, temperature, type of ions, oxide layers, roughness of electrode, impurity adsorption, etc.
3. Charge Transfer Resistance: A resistance can be formed by a single kinetically controlled electrochemical reaction at equilibrium under a fixed potential. In a redox reaction, the electrons enter the electrode and the generated ions diffuse into the electrolyte. The potential and the current relation is given by
| (1.4.1) |
where , , , , , , T, and R are the exchange current density, concentration of oxidant at the electrode surface, concentration of oxidant in the bulk, concentration of reductant at the electrode surface, overpotential, and gas constant. When electrode surface concentration is same with bulk concentration, and , Eq. (1.4.1) is known as the Butler–Volmer equation. This equation describes that how electrical current of a electrode rely on the electrode potential.
4. Warburg Impedance: Diffusion can result in impedance which is called Warburg impedance, and it depends on the frequency of the potential perturbation. At low frequencies, the reactants diffuse resulting in increased Warburg impedance while at high frequencies, the Warburg impedance is small. Warburg impedance is given by Eq. (3.3.6).
5. Constant Phase Element: In EIS experiments, a capacitor is not ideal. It acts like a CPE as defined below. The impedance of a capacitor is given by
| (1.4.2) |
where is the capacitance (C) and for an ideal capacitor, , and Y0 = 1/|ZCPE|, at ω = 1 rad/s.
The adsorption of biomolecules on a bioelectrode surface can introduce changes in the impedance signal. Other than detection of biomolecules, this technique can be used for determination of various electrochemical parameters. For example, a microfluidic-based nucleic acid biosensor has been developed using impedance spectroscopic technique for quantification of DNA sequences specific to chronic myelogenous leukemia (Fig. 1.4.3A ). In this microfluidic sensor, the cadmium selenide quantum dots were deposited on a patterned conductive electrode via the Langmuir–Blodgett technique for detection of the target complementary DNA concentration by measuring the interfacial charge transfer resistance (R ct) via hybridization [52]. Increasing concentrations of complementary DNA followed by DNA hybridization can result in the double-stranded DNA helix formation on the sensor surface that increases the negative charge of the electrode surface and hence decreasing R ct (Fig. 1.4.3B). A selective, reproducible, and sensitive immunosensor [53] has been developed using antibody-functionalized reduced graphene oxide sheets for detection of low-density lipoprotein (LDL) molecules via the impedance method (Fig. 1.4.4 ). The antiapolipoprotein-functionalized reduced graphene oxide platform was found to be highly sensitive to LDL molecules, and the variation of the impedance signal with increasing LDL molecules causes adsorption of LDL via antigen–antibody interactions.
Figure 1.4.3.
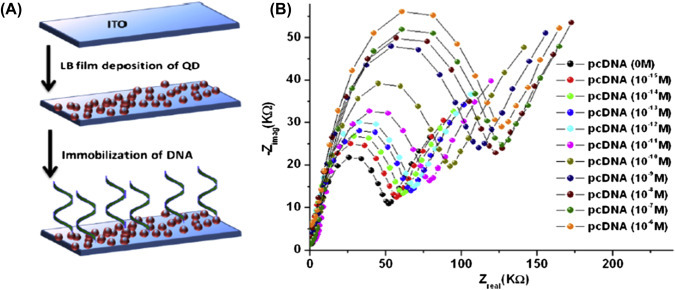
(A) The fabrication of microfluidic biochip for electrochemical detection of DNA hybridization using quantum dots and (B) the electrochemical impedance spectroscopy response spectra by varying the complementary DNA from 10−15 to 10−6[52]. pcDNA, probe complementary DNA.
Figure 1.4.4.
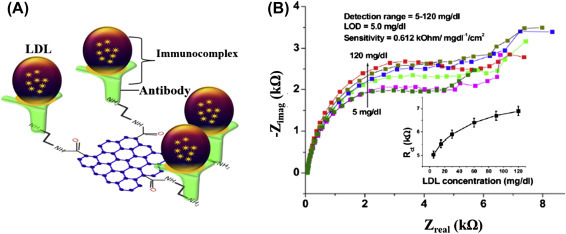
(A) A reduced graphene oxide based impedance immunosensor for detection low-density lipoprotein (LDL) molecules and (B) electrochemical response studies of the antibody functionalized bioelectrode as a function of LDL concentration (5–120 mg/dL); inset: a calibration curve between Rct values and the LDL concentration [65].
1.3.2.3. Optical Biosensors
Optical biosensor is an analytical device comprising of an optical transducer and bioreceptor molecules [54]. An optical transducer can be integrated with a source of light and converts a biological event to electronic signal. In optical biosensors, the transduction process induces the change in the absorption, transmission, reflection, refraction, phase, amplitude, frequency, or polarization of light in response to the physical/chemical change created by the biorecognition events. The optical biosensors can also be fabricated using SPR, fluorescence, biochemi/luminescence, Raman scattering, and refractive index (RI). A light source (light-emitting diode, laser, etc.), an optical transmission media (waveguide, fiber, etc.), a bioreceptor (enzymes, antibodies, or microbes), and an optical detection system are the main components of an optical biosensor. The classification of optical biosensors is shown in Fig. 1.4.5 .
Figure 1.4.5.
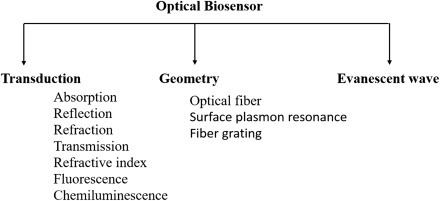
The classification of optical biosensor.
Advantages of an optical biosensor are:
-
▪
fast, label-free, real-time measurements
-
▪
high selectivity
-
▪
highly sensitive
-
▪
remote sensing
-
▪
isolation from electromagnetic interference
-
▪
multiple channels/multi parameters detection
-
▪
minimally invasive for in vivo measurements
-
▪
biocompatibility
-
▪
kinetic analysis of target analytes.
Optical biosensors have potential demand in environmental monitoring, food safety and quality maintain, biomedical research, and diagnostics. Detection of biomolecules (e.g., DNA, proteins, cells, etc.) and binding kinetics of interactions between proteins and DNA, cells, etc. by optical probes have been exploited in recent years. In 1980s, SPR and evanescent waves–based techniques were applied for the investigation of biological and chemical interactions. After development of the first commercial optical biosensor (late 1980s), researchers published more than 3000 research papers relating to optical biosensors for pharmaceutical and diagnostic industries. These include ligand fishing, virology, bacteriology, epitope mapping, cell biology, cell adhesion, enzymatic analysis, signal transduction, nucleotide–nucleotide, and nucleotide–protein binding, etc. With recent advances, optical biosensors are employed for detection of small-molecule binding to immobilized receptors in drug screening application. Several companies currently offer optical biosensors that can be used for various applications.
1. Absorption: It is a process in which light energies are absorbed by an atom or a molecule. According to the Lambert–Beer law, the intensity of the transmitted light (I) can be described by
| (1.4.3) |
where I 0, , C, and are the incident light intensity, extinction coefficient, concentration of analyte, and thickness of the absorption medium. Absorption is wavelength dependent. It is known that different species can have different absorption spectra, and by measuring the absorption spectra via a fiber optic sensor, various samples and concentration levels can be quantified. Absorption-based optical biosensors utilize absorptions phenomenon to detect the changes in the concentration of desired analytes. In this type of biosensor, the incident light can be absorbed by the sample and the light absorbed can be measured by an optical detector.
2. Fluorescence: It is a sensitive tool for detection of biomolecules such as live cells, antigens, nucleotides, etc. with unprecedented sensitivity and selectivity. The fluorescence can be due to the emission of light or radiation upon external exposure of an object that absorbs light or other radiation. In the fluorescence detection system, four components are needed namely an excitation light source, a fluorophore molecule, wavelength filters to isolate emission photons from excitation photons, and a detector. Fluorescence is a three-stage process that can occur in particular molecules such as polyaromatic hydrocarbons or heterocycles known as fluorophores or fluorescent dyes. A fluorophore molecule can be predicted to respond to a specific stimulus or to confine within a specific region of a biomolecule. The mechanism of fluorescence for fluorophore molecules can be illustrated by the electronic-state diagram or Jablonski diagram (Fig. 1.4.6A ).
Figure 1.4.6.
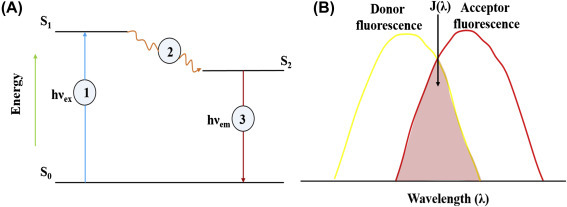
(A) The Jablonski diagram describing the processes for the creation of an excited electronic singlet state by optical absorption and corresponding emission of fluorescence. (B) Fluorescence resonance energy transfer mechanism.
In the Jablonski diagram of the first stage a photon of energy (hν em) is provided by a source and absorbed by the fluorophore, producing an excited singlet state (S1). In the second stage, the excited state occurs for a finite time of ∼1–10 ns. Within this time, the fluorophore experiences conformational changes and can have multiple interactions at molecular levels. The energy of S1 can partially be dissipated, providing a relaxed singlet excited state (S2) where fluorescence emission originates. However, all molecules are not initially excited by absorption back to S0 (ground state) by fluorescence emission. And collisional quenching, fluorescence resonance energy transfer (FRET) may occur to depopulate S2. In the third stage, after emission with a photon energy of hν em, the fluorophore returns to S0. A longer wavelength and lower energy can be achieved than the excitation photon hν em due to energy dissipation during the excited-state lifetime. The difference of excitation and emission energy such as hν ex − hν em is known as Stokes shift. The emission photons may be probed with a low background and can be isolated from excitation photons resulting in high sensitivity of the device. There are several examples of fluorescence-based instruments that are given below:
-
▪
Spectrofluorometer and microplate reader can measure the fluorescence properties of bulk samples.
-
▪
Fluorescence-based microscope measures fluorescence with respect to spatial coordinates in 2D or 3D.
-
▪
Fluorescence scanner resolves fluorescence with respect to spatial coordinates in 2D or 3D for macroscopic objects.
-
▪
Flow cytometer measures fluorescence per cell in a flow system, permitting subpopulations within a large sample to be quantified.
The FRET is a nonradiative quantum mechanical technique for probing interactions of the biomolecules that yield changes in molecular proximity (Fig. 1.4.6B). The FRET is a distance-dependent interaction between the electronic excited states of two fluorophores or chromophores or dyes in which energy is transferred from a donor to an acceptor without any emission of a photon. The efficiency of this energy transfer is inversely proportional to the sixth power of the intermolecular separation, allowing it to become extremely sensitive to a comparable dimension of macrosized biomolecules. When this energy transfer is utilized as a contrast mechanism, colocalization of proteins or biological molecules can be imaged by the spatial resolution (i.e., number of pixels used in construction of a digital image) beyond the limits of conventional optical microscopy. In FRET, a donor fluorophore absorbs the energy with exciting light and transfers the energy to an acceptor chromophore.
| (1.4.4) |
| (1.4.5) |
| (1.4.6) |
For FRET, there are some conditions that need to be satisfied that are given below:
-
▪
The spectrum of fluorescence emission for a donor must be overlapped with the spectrum of absorption for acceptor molecules. The degree of overlap is known to as spectral overlap integral (J).
-
▪
The donor and acceptor must be ∼1–10 nm range.
-
▪
The transition dipoles of donor and acceptor molecules must be nearly parallel.
-
▪
The fluorescence lifetime of the donor must have sufficient time for energy transfer to occur.
The efficiency of the energy transfer (E FRET) is dependent on the inverse sixth power of the distance between the donor and acceptor pairs (r) and is given below:
| (1.4.7) |
where R 0 is the Förster radius (half of the excitation energy of donor transfers to acceptor at this radius). Thus, Förster radius is a charateristic distance having energy transfer efficiency of 50%. The spectral overlap integral of the donor–acceptor pair (J) is given by:
| (1.4.8) |
where, fd(λ) is the emission spectrum (normalized) of the donor, εA is represent the standard for the molar absorption coefficient of the acceptor and λ is the wavelength. FRET-based biosensors consist of a bioreceptor element fused to a pair of fluorophore or a system containing the FRET pair and the bioreceptor element. FRET can be potentially for biosensor applications by measuring the distance and can be used to detect molecular interactions. FRET can be utilized to detect location, interactions of genes, and cellular structures such as integrins, and membrane proteins and to study the metabolic or signaling pathways and lipid rafts in cell membranes. The popular fluorophores for biological applications are cyan fluorescent protein and yellow fluorescent protein for FRET applications and are color variants of green fluorescent protein. Engineered nanomaterials such as quantum dots (CdTe, CdSe, etc.) also act as fluorophore molecules which can be tagged with bioreceptors (antibody, DNA, etc.) in a FRET system for specific recognition of target molecules. Fig. 1.4.7 describes a FRET-based biosensor using graphene quantum dots and gold NPs for the quantification of the mecA gene sequence of Staphylococcus aureus [55].
Figure 1.4.7.
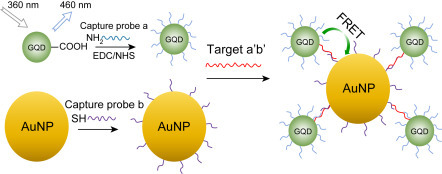
The sensing mechanism of the proposed quantum dots–gold nanoparticles (Au NPs)-based fluorescence resonance energy transfer biosensor for Staphylococcus aureus gene detection [55].
The chemiluminescence is known to be similar to fluorescence. However, a small difference is that chemiluminescence occurs by exciting biomolecules via chemical reaction due to oxidation of substances such as O2 or H2O2, whereas fluorescence occurs by exciting molecules with the help of light. No external light source is needed for chemiluminescence is required to start the reaction. Chemiluminescence can occur via two steps and is as given by:
| (1.4.9) |
| (1.5.0) |
where k 1 and k 2 are the excitation and decay rates. Production of signal by the reaction with a living organism is called bioluminescence. Several organisms can produce bioluminescence for signaling, mating, food hunting, and self-protection.
3. Surface plasmon resonance: Surface plasmons are the coherent delocalized electron oscillations that are known to confine to the metal surface. Plasmons arise at the interface of the metal and the buffer solution or metal–dielectric interface. Plasmons can produce an electric field that extends up to ∼100 nm and is known as an evanescent wave as it decays exponentially with distance. When monochromatic, polarized light strikes to an interface between prism and buffer solution) from the side where the media has the maximum RI (prism), the light can be partly reflected and refracted toward the plane of the interface. Above a certain angle of the incidence, all of the light would be reflected with diminishing refracted light. This phenomenon is known as total internal reflection (TIR), and this angle is called the resonance angle. Noble metals such as gold (Au), silver (Ag), etc. can be used to create surface plasmons. In SPR, Au film that is coated on the surface of a prism is widely used for biosensor applications.
The SPR occurs when an incident light beam has the correct incidence angle within TIR. At this resonance angle (θ), the photons of the incident light have a momentum equivalent to the momentum of the surface plasmons, and the photons are transformed into plasmons. In this condition, the optical energy is found to couple with the Au surface resulting in decreased reflection. Any change on the Au surface such as binding of biomolecules, aptamers, antibodies, etc. by immobilization can alter the momentum of the surface. As a result, SPR does not occur at the previous incidence angle, and a SPR shift will take place. The resonance angle shift in the SPR is proportional to the change in incorporated mass on the surface of Au.
Fig. 1.4.8 describes the basic components of a typical SPR biosensor. On top of the Au surface, the bioreceptor molecules (interactants) are immobilized via conjugation chemistry. For example, the Au surface can be functionalized by saline treatment where Au–sulfur covalent bond occurs with the remaining other functional groups e.g., —COOH that can be further used for proteins binding followed by N-ethyl-N-(3-dimethylaminopropyl) carbodiimide-N-hydroxysuccinimide chemistry. A flow-cell or fluidic channel on top of the Au can help for continuous injecting target molecules and desired buffer solution. When light is shone through a prism and toward the Au surface at an angle and a wavelength near the condition of SPR, the optical reflectivity of Au can be changed because of the presence of biomolecules which specifically binds with the target molecules. The SPR dip or shift of the SPR angle with and without target molecules is shown in Fig. 1.4.8. Thus, the concentration of the target biomolecules can be quantified by this reflectivity change. With high sensitivity and electrical interference free of SPR, biosensors provide real-time detection of biomolecules without tagging any fluorescents or other labeling of the interactants.
Figure 1.4.8.
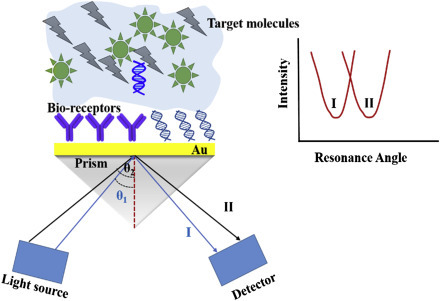
Basic components of a surface plasmon resonance (SPR) system for detection of biomolecules where the target analytes are captured by the immobilized bioreceptors on Au surface. Accumulation of the target analyte on the sensor surface results in a change of refractive index in the evanescent field leading to the shifting of SPR angle (shown in inset).
Fig. 1.4.9 shows a sensorgram; the plot between the angle where the dip is observed and the time; the sensor signal in the measurement cycle is demonstrated. In a typical SPR, each measurement initiates with conditioning the sensor surface having a buffer solution (step 1). In this step, no change arises at the sensor and a baseline can be measured with the dip at the SPR angle (step 1, Fig. 1.5.0 ). The target biomolecules on the surface are captured on the surface due to specific interactions, providing a change in the RI and a shift in the SPR angle to position (step 2, Fig. 1.4.8). In this step, real-time adsorption kinetics of the target molecules can be monitored. Consequently, the injection of buffer solution onto the sensor can flush-off the nonspecifically bound molecules (step 3) called dissociation. And the dissociation kinetics can be measured in real time. In this step, accumulation of mass can be gained from the SPR response (ΔR). In step 4, introducing the regeneration solution (low pH buffer) breaks the specific binding between the target molecule analyte and bioreceptor on the sensor surface. If the regeneration is not complete, the remaining accumulated mass can cause the level at baseline to increase.
Figure 1.4.9.
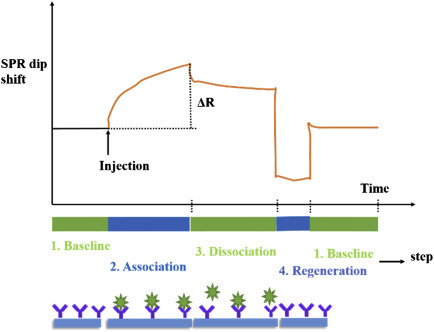
A typical sensorgram for detection of biomolecules. Step 1 (baseline) showing buffer is in contact with the biofunctionalized sensor, step 2 (association) is for continuous injection of solution containing target molecules allowing interaction on the sensor surface, and ΔR represents the measured response due to the bound target molecules. Step 3 (dissociation) is for injection-only buffer solution for allowing dissociation of target molecules. SPR, surface plasmon resonance.
Figure 1.5.0.
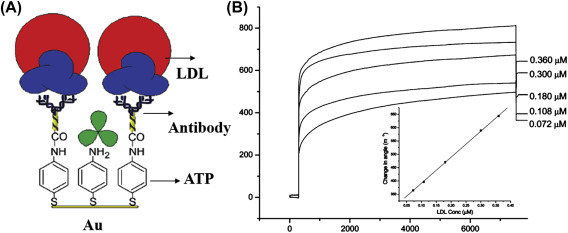
(A) Fabrication of an immunosensor for detection of low-density lipoprotein (LDL) molecules by surface plasmon resonance (SPR) technique and (B) the SPR response signal as function of LDL concentration, inset showing the change in the SPR angle versus LDL concentration [56].
The main advantage of SPR technique is the determination of real-time tracking and kinetics of biomolecular interactions. Also, the reaction rate and equilibrium constants of interactions can be quantified. A binding reaction equation for two molecules can be written as
| (1.5.1) |
In the association phase, the rate of the complex formation is given as (Eq. 1.5.2):
| (1.5.2) |
The integrated rate equation is given as (Eq. 1.5.4):
| (1.5.3) |
| (1.5.4) |
where is the association rate constant, is the dissociation rate constant, represents the signal at zero time, and is the maximal of change in the response. The relevant kinetic information is obtained from . The ka and kd can be estimated from the plot of k s versus concentration of the target analyte, where the slope of the curve gives the value of k a (M−1 s−1) and the y-intercept gives k d (s−1) and the equilibrium constant K A = k a/k d (M−1).
Matharu et al. fabricated a human plasma LDL immunosensor [56] using the SPR technique (Fig. 1.5.0A). In this immunosensor, the antiapolipoprotein B is immobilized onto a self-assembled monolayer (SAM) of 4-aminothiophenol (ATP) was utilized for detection of antigen (LDL) by antibody–antigen interactions. The SPR angle is found to be changed due to the binding of LDL molecules on the sensor surface with increasing LDL concentrations (Fig. 1.5.0B). Thus, the SPR technique can be used for quantification of biomolecules and their kinetic analysis.
A localized SPR (LSPR) is the surface plasmon that is confined in a NP of size comparable to the wavelength of light that can be used for excitation of NPs. Noble metal NPs show a strong absorption in the UV–visible region, which is not exist in bulk metals. LSPR spectroscopy is a powerful technique for biosensing applications. Two important effects for LSPR are
-
1.
Near to surface of NPs, the electric fields are greatly enhanced. The enhanced electric field falls off quickly with distance from the surface.
-
2.
The optical absorption of NPs has a maximum value at the plasmon resonance frequency that occurs at visible wavelengths.
LSPR can be used to enhance the electromagnetic field and can also be applied to surface-enhanced Raman scattering applications. Fig. 1.5.1 demonstrates a propagating plasmon (Fig. 1.5.1A) and a localized surface plasmon (Fig. 1.5.1B). In surface polaritons, plasmons propagate in the x-axis and y-axis directions within a distance of 10–100 μm along the metal–dielectric interface, and decay evanescently in the z-axis direction with 1/e decay lengths of 200 nm. The interaction of electromagnetic waves at the metal surface and a molecular surface can lead to shift in resonance condition that can be observed in three different modes, namely: resonance angle, wavelength shift, and imaging. The reflectivity of light obtained from the metal surface is measured as a function of the incidence angle (at constant wavelength) or wavelength (at constant incidence angle) in the first two modes. However, with constant wavelength and incident angle, mapping the reflectivity of the surface can be observed as a function of position in case of imaging. In case of LSPR, the light can interact directly with particles much smaller compared to the incident wavelength (Fig. 1.5.1B) indicating that the plasmon oscillates locally around the NP with a known frequency of LSPR. In SPR and LSPR, Ag and Au NPs are commonly used due to their unique optical properties and their absorption band in the visible region. Silver NPs have a narrower resonance spectra and thus provide a higher signal-to-noise ratio; however, Ag NPs exhibit a higher chemical reactivity.
Figure 1.5.1.
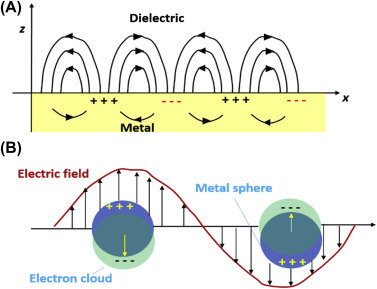
(A) Schematic representation of surface plasmon polariton or propagating plasmon and (B) a localized surface plasmon.
Au nanorods are synthesized for RI sensing by LSPR technique and obtain a high sensitivity (170 nm/RIU) with a figure of merit of 1.3 [57]. The schematic representation of LSPR-based biosensor and sensor response signal in the presence of target molecules is shown in Fig. 1.5.2 . The surface of gold nanorods is attached with a SAM that has been conjugated with antibodies by carbodiimide cross-linking. The interactions of the bioconjugated Au probes with a secondary antibody were investigated via LSPR spectral shifts. The binding rates and equilibrium constant were found to be excellent for an antibody–antigen system.
Figure 1.5.2.
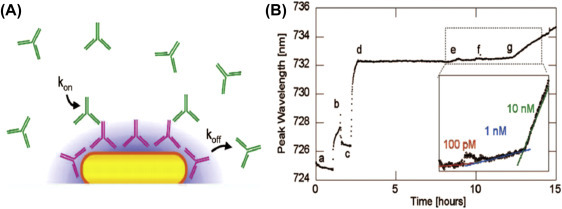
(A) The schematic representation of localized surface plasmon resonance (LSPR)–based biosensor using nanorod-based immunoassay, and the nanorods were attached to a glass surface with the help of (3-aminopropyl)triethoxysilane monolayer, and further, coated with a self-assembled monolayer to capture antibody by enabling carbodiimide cross-linking, and (B) sensor response curve showing LSPR wavelengths, at step e, the specific antibody of IgG was added (concentration of 100 pM). Furthermore, the IgG concentration was enhanced to 1 nM (at f) and 10 nM (at g) and the inset exhibits linear fits to the binding curve [57].
4. Fiber Optic Biosensors: Optical fibers-based biosensors or bio-optrodes are the analytical devices that can be used for biomolecules monitoring. The “optrode” is a merger of “optical” and “electrode” and can detect concentration of specific chemicals or biomolecules. Optical fibers are small, strong, durable, and flexible wires that are made of silica or plastic having a micrometer diameter, thus can be applied for harsh and hazardous environments and remote sensing. Optical fibers can be utilized for multiplex sensing due to their capability to transmit multiple light signals simultaneously. They consist of a cylindrical core and a surrounding cladding and have a circular waveguide (Fig. 1.5.3 ).
Figure 1.5.3.
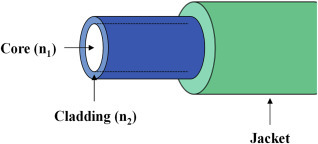
Schematic diagram of an optical fiber shows core and clad structure.
Optical fibers can transmit light from one end to another or for long distances with a minimal loss by the principle of TIR. When TIR occurs, the light rays are conducted through the core of the fiber with an insignificant loss of light to the surrounding. The formation of an optical fiber (OP) by a core with a RI n 1 and a cladding with a RI n 2 is shown in Fig. 1.5.4 . To transmit light by TIR, the RI of the core (n 1) and cladding (n 2) should be n 1 > n 2. When light strikes the boundary interface having different RI and the angle of incidence is larger than the critical angle as defined by Snell's law (θ c = sin−1[n 2/n 1]), the light will be totally reflected and guided through the fiber. The intensity of light is not zero at the interface when the incident light is totally reflected (Fig. 1.5.4A). A small part of light perforates the reflecting medium. The intensity decreases exponentially with distance from the interface and extends into the medium of lower RI. The penetration depth (d p) is the distance needed for the electric field amplitude to fall to 1/e (0.37) at the interface, and it is a function of the wavelength and incidence angle of light (Fig. 1.5.4B). The evanescent wave interacts with molecules within the dp and produces a net flow of energy across the reflecting surface. This transfer of energy is known as attenuation in reflectance and can be utilized for the development of biosensors (attenuated total reflection biosensors). When an evanescent wave excites a fluorophore molecule, the emission of fluorescence can be directed back into the OP and transported to the detector. This principle is known as TIR of fluorescence, and this has been widely used for imaging biomolecules. Several optical phenomena such as fluorescence, absorption, evanescent wave, and SPR can be exploited for optical biosensing.
Figure 1.5.4.
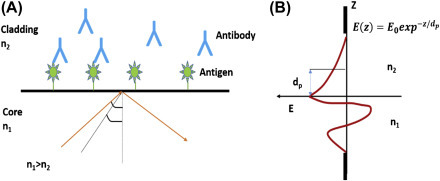
(A) Total internal reflection of light at the interface of two media having different RI such as n1 and n2. At an angle greater than critical angle (θc), the incident light will be reflected totally. (B) Schematic diagram of amplitude of electric filed (E) for core and cladding interface. The E of the evanescent wave decreases exponently with a penetration depth of (dp) in the lower index medium side.
Figure 1.5.7.
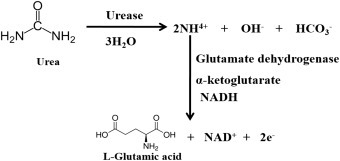
Utilization of urease and biochemical reaction of urea estimation [59].
OP bundles having thousands of similar single fibers with a diameter of a few micrometers were explored for constructing bio-optrodes. The coherent bundles (each fibers having identical ends) can be employed for imaging. By coating of metallic nanostructures on tips of fibers or on the cleaved facets of optical fibers, the SPR technique can be used for biosensing applications.
A sensitive fiber-optic DNA biosensor using a thin-core fiber modal interferometer (TCFMI) has been fabricated (Fig. 1.5.5A ). In this sensor, poly-ethylenimine, poly-acrylic acid, and single-stranded DNA (ssDNA) were employed for the fabrication of a polyelectrolyte multilayer film for detection of DNA [58]. This fabricated DNA sensor has been investigated in the presence of different types of target ssDNA solutions by exposing a concentration of 1 mM (Fig. 1.5.5B). The sensitivity of this sensor was found to be 0.27 nm/matched base at 1 mM concentration and can be used to quantify the number of matched bases of ssDNA chains.
Figure 1.5.5.
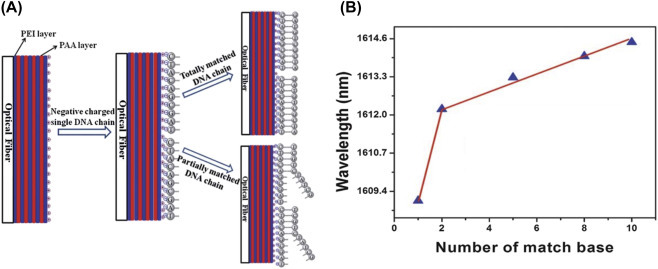
(A) Schematic of a fiber-optic DNA sensor and (B) wavelength shift of the thin-core fiber modal interferometer–based DNA sensor in detecting different types of target single-stranded DNA in solution [58]. PAA, poly(acrylic acid); PEI, poly(ethylenimine).
1.3.2.4. Piezoelectric Biosensors
In a piezoelectric sensor, the piezoelectric effect is exploited to measure strain, force, pressure, or acceleration by converting them to an electrical signal. To fabricate the piezoelectric sensors, the biorecognition molecules can be attached to a piezoelectric surface wherein the interactions between the target analyte and the recognition elements (enzyme, antibody, cells, etc.) set up mechanical vibrations that can be translated into sensor readable signal corresponding to target analyte. An example of such a sensor is quartz crystal micro- or nanobalance. An alternating potential can produce a standing wave in the crystal at a resonance frequency. This resonance frequency depends on the elasticity of the crystal and if the crystal is coated with a biomarker, the binding of a target analyte to that biomarker will generate a change in the resonance frequency. This resonant frequency changes by adsorption or desorption of the molecules on the surface of the crystal and is given by
| (1.5.5) |
where Δf, Δm, K, and A are the change in the resonance frequency (Hz), change in the mass of absorbed material (g), a constant, and surface area (cm2), respectively. The change in frequency can be detected by relatively unsophisticated electronic circuit. Thus, the mass-sensing transducer offers sensitive detection for the change in the mass adsorbed or desorbed onto the piezoelectric crystal. However, this technique cannot be used for truly static measurements.
1.3.2.5. Thermal Biosensors
Thermometric devices can detect changes in temperature due to heat produced or absorbed during a biochemical reaction between immobilized bioreceptors and target molecules. The total heat of production or absorption is directly proportional to the molar enthalpy and the total number of product molecules that were created due to the biochemical reactions. The change in temperature can be described as
| (1.5.6) |
where ΔT is change in temperature, ΔH is the change in enthalpy, np is moles of product, and Cp is heat capacity. For example, thermistor is a sensitive temperature sensor and is known to measure the change in temperature. This is a resistor consisting of a high negative temperature coefficient of resistance. This can be made by sintering mixtures of manganese (Mn), nickel, cobalt (Co), iron (Fe), and uranium (U) oxides. A change in temperature appears due to the change in the resistance. Thermal biosensors have been successfully used in laboratory conditions for clinical monitoring of blood glucose, cholesterol, cholesterol esters, heavy metal ions such as Hg2+, Cu2+, Ag+, and thermometric biosensor to enzyme-linked immunosorbent assay.
1.3.2.6. Enzymatic Biosensors
Enzymes are known to be proteins with macromolecular size and acting as biological catalysts. Enzymes catalyze and enhance the speed of a chemical/biological reaction without themselves experiencing any chemical change. A molecule at the beginning of the process is known as the substrate, an enzyme can convert the substrate into the product. An enzymatic reaction can be expressed as
| (1.5.7) |
where, k f, k r, and k cat are the rate constants, and the double arrows indicate that the enzyme–substrate binding is a reversible process. If the enzyme concentration is much less compared to the substrate concentration, then the rate of product formation can be given by
| (1.5.8) |
where V max is the maximum rate and is the initial enzyme concentration. The rate of reaction increases with increasing concentration of the substrate [S]. V max is equal to attained when the whole enzyme is bound to the substrate. The Michaelis–Menten constant (K m) is the substrate concentration, wherein the the reaction rate is half-maximum and is an inverse measure of the substrate affinity for the utilized enzyme. The low value of K m indicates high affinity of the enzyme with the substrate. It is dependent on the enzyme, substrate, temperature, pH, etc. In an enzymatic biosensor, the enzyme molecule is immobilized onto a transducer surface and produces a specific signal upon reaction with a desired analyte. The main aim is to convert an enzymatic reaction into a readable signal in term of electrochemical, or colorimetric, or optical properties, or others. The thrust is toward developing miniaturized biosensors for the easier detection of a number of biomarkers such as blood sugar, urea, and cholesterol that may serve as an indicator about the onset of a disease.
After the invention of the glucose biosensor in 1962, several devices based on enzymatic biosensors have been developed. Glucose monitoring in blood sample is an important factor for diabetic patients. In these biosensors, enzymes are employed as bioreceptors on a transducer material that allows specific biocatalytic reactions based on the sensor working principle. For example, GOD can be utilized for quantitative monitoring of glucose concentration with (1) and without mediator (2) as shown in Fig. 1.5.6 . With advancement in nanotechnology and nanoscience, the immobilization of enzymes onto NPs and nanostructures by surface chemistry can act as biofunctionalized electrodes for detection of desired target molecules. Similarly, monitoring the urea level in a biological sample is also an important factor because it may cause several diseases such as renal failure, hepatic failure, nephritic syndrome, cachexia, urinary tract obstruction, gastrointestinal bleeding, etc. on exceeding the normal concentration of urea. Two popular enzymes such as urease and glutamate dehydrogenase (GLDH) can be employed for urea level detection. The enzymatic reaction for urea detection is shown in Fig. 1.5.7 . Urea in the presence of urease can be converted into hydrogen bicarbonate (HCO3 −) and ammonia (NH3). GLDH is converted into ammonium ions (NH4 +), α-ketoglutarate, and nicotinamide adenine dinucleotide (NADH) to l-glutamate and NAD+. The generated electrons after conversion of NADH to NAD+ can be detected. To achieve high sensitivity, selectivity, and stability, the nanomaterials play an important role for conjugation of urease to construct urea biosensors [59]. For cholesterol detection, cholesterol esterase and cholesterol oxidase can be immobilized onto nanomaterials. The enzymatic reaction is shown in Fig. 1.5.8 . First the esterified cholesterol converts to cholesterol and fatty acid in the presence of cholesterol esterase. The cholesterol oxidase can convert cholesterol to 4-cholesten-3-one and hydrogen peroxide (H2O2) that further oxidize and generate electrons which can be detected by an electrochemical transducer [60].
Figure 1.5.6.
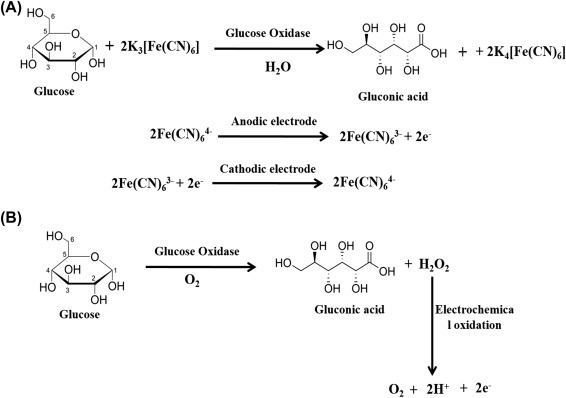
(A) Catalytic conversion for glucose oxidase with glucose in the presence of potassium ferricyanide where electrons are generated by conversion of Fe (II) to Fe (III), and (B) catalytic conversion of glucose with glucose oxidase without any mediator [60].
Figure 1.5.8.
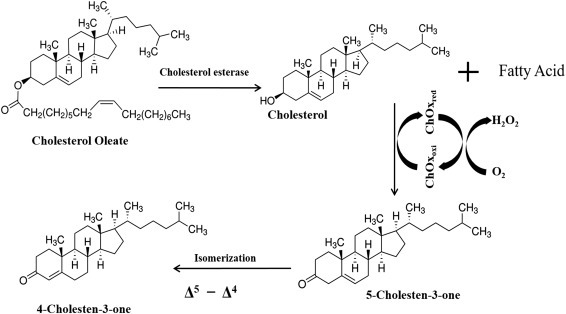
Enzymatic reactions of total cholesterol and free cholesterol estimation using cholesterol esterase and cholesterol oxidase [60].
1.3.2.7. Immunosensors
Immunosensors are affinity-based analytical devices. This sensor is based on an immunochemical reaction comprising of antigen or antibody as the biorecognition element that is immobilized on a transducer surface. The immunosensors can play an important role for detection of cancerous molecules, proteins, LDLs, food pathogens, bacteria, and virus due to their high specificity and label-free detection. Immunosensors are known to be highly sensitive and can detect nanomolar to femtomolar concentrations of biomolecules. Immunosensor-based devices can detect the change in resistance, current, RI, capacitance, etc. due to the formation of immunocomplex by antibody and antigen interactions. A conventional immunoassay uses an antibody comprising of a “Y”-shaped structure having two antigen-binding sites (Fig. 1.5.9A ). A antigen molecule can bind to an antibody by a specific interaction, making highly reproducible and highly specific, and suitable for a range of target biomolecules for biosensing applications. A paratope is known as an antigen-binding site and is a part of an antibody (Ab) that recognizes and binds to an antigen. An epitope is the part of an antigen (Ag) that is recognized by the immune system, specifically by antibodies or T cells. For noncovalent interaction, a high degree of complementarity is required between the binding site of the Ab and Ag resulting in the formation of a Ab–Ag complex. Ab is said to be bivalent due to its two similar Ag-binding sites.
Figure 1.5.9.

(A) Schematic presentation of an antibody and (B) immunological reaction.
The formation of an immunocomplex in shown in Fig. 1.5.9B. The labeled immunosensor measures a molecule attached to a receptor by optical, fluorescence, amperometric, and other detection. The produced electrochemical signal depends on the concentration of the electroactive species produced by the enzyme-catalyzed reaction that is influenced by the amount of labeled enzyme bound to the immunosensor. The uses of enzyme labels offer significant amplification in the output of immunosensor because the enzyme molecules can rapidly produce many detectable product leading to low limit of detection (LOD). The electrochemical tool for an immunosensor has many benefits such as high sensitivity and low cost. However, some of the disadvantages include depuration from bound label, washing and separation steps, increased complexity of the assay, etc. The nonspecific binding of an antibody with foreign molecules other than the target analytes is a major issue in immunosensors development. One of the major problems that has delayed the commercialization is the inability of integration and supporting accessories on a single format.
The nanomaterials for immunosensors can amplify the sensitivity by facilitating higher loading of biorecognition molecules with larger surface area. The immunosensors and immunoassays are widely used for clinical analysis due to their high selectivity, sensitivity, and specificity. Recently, the incorporation of nanomaterials into immunosensors and immunoassays has further improved their LOD and signal-to-noise ratio.
1.3.2.8. DNA Biosensors
A nucleic acid or DNA sensor is a biosensor that functionalized a nucleic acid as the biodetection element on the surface of a transducer. Currently, DNA biosensor technologies are of much interest because of their rapid and low-cost recognition of specific DNA sequences. These technologies commonly depend on the immobilization of a single-strand oligonucleotide probe onto transducer surfaces which can be optical, electrochemical, or mass-sensitive. The probe DNA (pDNA) is specific to recognize the complementary DNA (called duplex) target sequence via hybridization, resulting in a change in the measurable signal. Specific binding of the surface-confined ssDNA probe and its complementary DNA strand are translated into corresponding readout signals. Peptide nucleic acid (PNA) is known to be more specific than DNA for detection of biomolecular recognition. Structurally, PNA and DNA are almost similar, but the entire negatively charged sugar–phosphate backbone of DNA is exchanged with a neutral (peptide-like) backbone having repeated N-(2-aminoethyl) glycine units associated with amide bonds. The adenine, cytosine, guanine, and thymine are the four natural bases found in DNA molecules. The amperometric, potentiometric, and impedimetric are the electrochemical techniques that have been employed for development of genosensors, whereas SPR, absorption, etc. are optical techniques for genosensors. CNTs, graphene, metal NPs, and nanocomposites and conducting polymers are the nanomaterials that are utilized for development of genosensors due to their larger surface area and biocompatibility with DNA molecules. Fig. 1.6.0 shows the immobilization pDNA and hybridization of target DNA based on conducting polymer as an electrochemical transducer [61].
Figure 1.6.0.
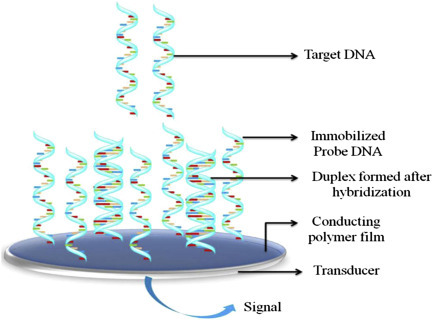
An electrochemical DNA sensor using conducting polymer [61].
1.3.2.9. Whole-Cell Biosensors
The whole-cell biosensor utilizes the immobilization of living components such as cells, microorganisms or bacteria that act as sensing elements instead of using enzymes, antibody and DNA molecules. The sensing element of a whole-cell biosensor recognizes specific species of interest and translates into functional information. The critical point in the development of the modern cell-based biosensors is the immobilization of cells onto a transducer under cellular conditions. The whole cell biosensors are promising tools for detection of pollutants. The interactions between the living cells with organic substances (xenobiotics, heavy metals, changes in pH, etc.) in water, soil, and air could provide a desired measurable signal. Bacteria, algae, cyanobacteria, fungi, plant cell, protozoa, and other organisms can be utilized for the development of whole-cell biosensors. For example, a bacterial biosensor can be used to detect the biochemical oxygen demand.
1.4.0. Immobilization Techniques
The immobilization of biomolecules including enzymes, antibody, DNA, and cells at a transducer surface is an important step to construct a biosensor [62]. The selectivity, stability, sensitivity, and reproducibility of a biosensor are the dominant parameters that can be improved by determining an effective method for immobilization. Various methods have been reported for the immobilization of desired biomolecules onto solid support materials are given below.
1.4.1. Adsorption
Adsorption is the simplest technique for immobilization of bioreceptor molecules such as enzyme, antibody, and DNA probe. In this case, enzyme or antibody can adsorb directly onto a transducer solid support (conducting electrode such as Au, Pt, Ni, ITO, etc.) or carrier (nanostructured materials) by electrostatic interactions (Fig. 1.6.1 ). It is known that there is no permanent bond formation that occurs on the solid support due to adsorption of bioreceptor molecules. Some weak bonds can stabilize the bioreceptors on the solid support, and these weak bonds are:
-
▪
ionic interaction
-
▪
hydrogen bonds
-
▪
van der Waal forces
Figure 1.6.1.
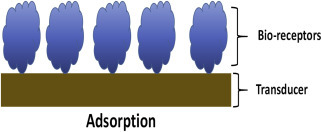
Schematic representation for immobilization of bioreceptor molecules by adsorption.
With small carrier particle sizes (diameter: 500 Å to 1 mm), significant surface bonding can be achieved. In this method, there are no “pore diffusion limitations” as bioreceptors are immobilized externally onto solid support or the carrier. There are different processes for methods of adsorption and are given by
1. Static Process: Immobilization of bioreceptors on solid support or carrier can be performed by allowing bioreceptors solution without stirring.
2. Dynamic Batch Process: Under stirring conditions, the carrier is placed in the solution containing bioreceptor molecules.
3. Reactor Loading Process: With continuous agitation, the carrier is placed in a reactor and transferred to the solution containing bioreceptors in it.
4. Electrode Position Process: an electrode is placed in a solution bath containing enzymes or other bioreceptors with carriers, and then under the electric field, the enzymes can migrate to the carrier and be deposited on its surface.
The advantages of these processes are:
-
▪
direct, easy, and cheap
-
▪
no pore diffusion limitation
-
▪
no reagents are needed
-
▪
minimum activation steps involved.
The disadvantages are as follows:
-
▪
desorption of enzymes from the carrier
-
▪
efficiency is less
1.4.2. Covalent Bonding
This method is widely used for immobilization of bioreceptor molecules. In this method, the covalent bonds occur between the functional groups in the bioreceptors (—NH2) and in the support or carrier (—COOH, —CHO, and —OH). The hydroxyl groups and amino groups of support can form covalent bonds easily with bioreceptors (enzymes, or proteins) (Fig. 1.6.2 ). Several functional groups are known as amino, imino, hydroxyl, carboxyl, thiol, methylthiol, guanidyl, imidazole and phenol ring can be generated at support or carrier that can performed to form covalent bonds. For example, the enzyme provides different chemical groups to form covalent bonds with a support or carrier which are given below
-
▪
alpha carboxyl group at “C” terminal of enzyme
-
▪
alpha amino group at “N” terminal of enzyme
-
▪
epsilon amino groups of enzyme
-
▪
β and γ carboxyl groups of aspartate and glutamate
-
▪
phenol ring of tyrosine
-
▪
thiol group of cysteine
-
▪
hydroxyl groups of serine and threonine
-
▪
imidazole group of histidine
-
▪
indole ring of tryptophan.
Figure 1.6.2.
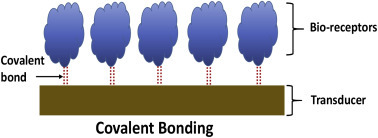
Schematic representation for immobilization of bioreceptor molecules by covalent bonding.
Carriers or supports are used for covalent bonding by using cellulose, agarose, polyacrylamide, collagen, gelatin, amino benzyl cellulose, and others such as porous glass, silica, NPs, nanotubes. Different methods for covalent bonding are
1. Diazoation: Bonding can occur between amino groups of support and tyrosil or histidyl groups of bio-receptor (enzyme).
2. Peptide Bond: Bond can form between amino or carboxyl groups of the support and enzyme.
3. Poly Functional Reagents: Use a reagent (glutaraldehyde) can be used for the formation of covalent bonds between the amino groups of the enzyme and support.
4. N-Ethyl-N-(3-Dimethylaminopropyl) Carbodiimide-N-hydroxysuccinimide Chemistry: Covalent bond can be created by activation of —COOH groups on solid support or carrier which will bind with —NH2 groups of proteins.
The advantages are given below:
-
▪
wide applicability
-
▪
strong linkage
-
▪
no leakage or desorption problem
-
▪
different functional groups are available
-
▪
not affected by adverse conditions of pH, ionic strength.
The disadvantages are:
-
▪
loss of functional conformation of bioreceptors (enzyme and antibody)
-
▪
may involve harsh/toxic chemicals
-
▪
matrix not regenerable
1.4.3. Entrapment
Bioreceptors are physically entrapped inside a porous matrix (water-soluble polymer). Covalent or noncovalent both can be involved in stabilizing bioreceptors into the matrix. Fig. 1.6.3 shows the schematic for an entrapped method for bioreceptors immobilization. By controlling the pore size of a matrix, we can prevent the loss of bioreceptors. The pore size of a matrix can be tuned by varying the concentration of the polymer. For entrapment, the common matrices that are used are polyacrylamide gels, cellulose triacetate, agar, gelatin, and carrageenan. Bioreceptors or enzymes can be directly trapped inside gels.
Figure 1.6.3.
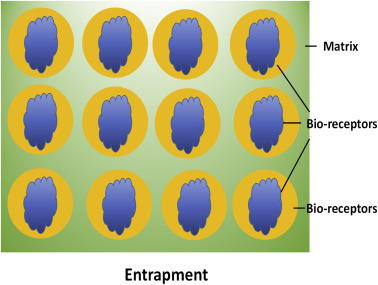
Schematic representation for immobilization of bioreceptor molecules by entrapment.
The advantages of entrapment method are as follows:
-
▪
cheap and easy
-
▪
mild conditions are needed
-
▪
little chance of conformational in enzyme
And the disadvantages are given below:
-
▪
leakage of enzyme
-
▪
pore diffusion limitation
-
▪
microbial contamination
1.4.4. Cross Linking or Copolymerization
In this method, there is no matrix or support involved (Fig. 1.6.4 ). Immobilized enzymes or bioreceptors can be directly linked via covalent bonds forming with enzymes by introducing polyfunctional reagents such as glutaraldehyde and diazonium salt. This technique is cost-effective and simple and is widely utilized for commercial preparations and industrial applications. In this method, the uses of polyfunctional reagents for cross-linking enzyme molecules may denature or may lose their catalytic properties.
Figure 1.6.4.

Schematic representation for immobilization of bioreceptor molecules by cross-linking.
1.4.5. Encapsulation
In this case, the immobilization is performed by enclosing the bioreceptors in a membrane capsule (Fig. 1.6.5 ). Capsules can be made of semipermeable membranes such as nitrocellulose or nylon. By using this method, a large quantity of bioreceptors can be predicted to immobilize by encapsulation. Pore size limitation and only small substrate molecules are able to cross the membrane are the main disadvantages of this technique.
Figure 1.6.5.
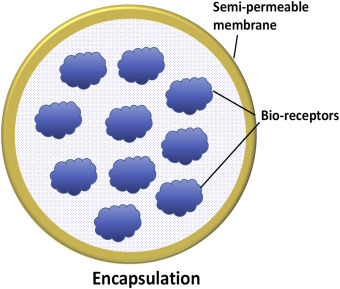
Schematic representation for immobilization of bioreceptor molecules by encapsulation.
1.4.6. Immobilization of Whole Cells
The immobilization of whole cells is an alternative approach to immobilization of enzymes. This is a well-developed technique for the utilization of enzymes from microbes. By this method, enzymes have been found to be active and stable for a long time due to exposure to a natural environment.
The advantages of this immobilization method are:
-
▪
With a single step, multiple enzymes can be introduced.
-
▪
Enzymes extraction and purification are not required.
-
▪
Conformational changes of enzyme will be maintained.
-
▪
Cell organelles such as mitochondria can be immobilized.
And the disadvantages of this technique are as under:
-
▪
concentration of enzymes will be small
-
▪
production of and unwanted products
1.5. Conclusions
The role of each component of a typical biosensor has been described in this chapter. This chapter has illustrated the fundamentals of nanomaterials and principles of biosensors with various techniques including electrochemical (amperometric, impedimetric, etc.) and optical (absorption, SPR, fluorescence, optical fiber, etc.), piezoelectric, and affinity-based sensor including enzymatic, antigen–antibody, nucleotide, etc. The immobilization techniques have been described in detail and selection of a particular application for immobilizing bioreceptor molecules is a crucial step for fabrication of biosensors. Efforts have also been made to describe applications of nanostructured materials in biosensors. The inherent excellent properties of nanomaterials including 1D, 2D, and 3D nanostructures have been extensively employed for fabrication of biosensors. The biomolecules such as antibody, enzyme, ssDNA, or cells can be linked with nanostructured materials by enabling surface chemistry for the establishment of a suitable bionanointerface that can detect a minute concentration of specific interest of target molecules. The uses of nanomaterials in biosensor technology are well explored for point-of-care applications by researchers. The incorporation of nanomaterials in biosensors provides distinct improvement of biosensor characteristics including sensitivity, selectivity, fast response, and low cost. The next chapter deals with the synthesis of the nanomaterials such as metals, metal oxides, carbon, and polymeric nanostructures for biosensor applications.
References
- 1.Lagerqvist B., James S.K., Stenestrand U., Lindbäck J., Nilsson T., Wallentin L. Long-term outcomes with drug-eluting stents versus bare-metal stents in Sweden. N. Engl. J. Med. 2007;356:1009–1019. doi: 10.1056/NEJMoa067722. [DOI] [PubMed] [Google Scholar]
- 2.Tansil N.C., Gao Z. Nanoparticles in biomolecular detection. Nano Today. 2006;1:28–37. [Google Scholar]
- 3.Ozin G.A., Arsenault A.C., Cademartiri L. second ed. Royal Society of Chemistry; 2009. Nanochemistry: A Chemical Approach to Nanomaterials. [Google Scholar]
- 4.Arlett J.L., Myers E.B., Roukes M.L. Comparative advantages of mechanical biosensors. Nat. Nanotech. 2011;6:203–215. doi: 10.1038/nnano.2011.44. [DOI] [PMC free article] [PubMed] [Google Scholar]
- 5.Yager P., Edwards T., Fu E., Helton K., Nelson K., Tam M.R. Microfluidic diagnostic technologies for global public health. Nature. 2006;442:412–418. doi: 10.1038/nature05064. [DOI] [PubMed] [Google Scholar]
- 6.Cao G. Imperial College Press; London: 2004. Synthesis, Properties and Applications. [Google Scholar]
- 7.Colvin V.L. The potential environmental impact of engineered nanomaterials. Nat. Biotechnol. 2003;21:1166–1170. doi: 10.1038/nbt875. [DOI] [PubMed] [Google Scholar]
- 8.Feynman R.P. There’s plenty of room at the bottom. In: Gilbert H.D., editor. Miniaturization. Reinhold; New York: 1961. [Google Scholar]
- 9.Sandhu A. Who invented nano? Nat. Nanotechnol. 2006;1:87. [Google Scholar]
- 10.Drexler K.E. Nanotechnology: from Feynman to funding. B. Sci. Technol. Soc. 2004;24:21–27. [Google Scholar]
- 11.Michler P. Springer Science & Business Media; 2003. Single Quantum Dots: Fundamentals, Applications and New Concepts. [Google Scholar]
- 12.Wang L.W., Zunger A. Solving Schrödinger’s equation around a desired energy: application to silicon quantum dots. J. Chem. Phys. 1994;100:2394–2397. [Google Scholar]
- 13.Mackenzie J.D., Bescher E.P. Chemical routes in the synthesis of nanomaterials using the sol–gel process. Acc. Chem. Res. 2007;40:810–818. doi: 10.1021/ar7000149. [DOI] [PubMed] [Google Scholar]
- 14.Srinivasan M., Rajabi M., Mousa S.A. Multifunctional nanomaterials and their applications in drug delivery and cancer therapy. Nanomaterials. 2015;5:1690–1703. doi: 10.3390/nano5041690. [DOI] [PMC free article] [PubMed] [Google Scholar]
- 15.Ishikawa F.N., Chang H.K., Curreli M., I Liao H., Olson C.A., Chen P.C. Label-free, electrical detection of the SARS virus N-protein with nanowire biosensors utilizing antibody mimics as capture probes. ACS Nano. 2009;3:1219–1224. doi: 10.1021/nn900086c. [DOI] [PMC free article] [PubMed] [Google Scholar]
- 16.Luo D., Wu L., Zhi J. Fabrication of boron-doped diamond nanorod forest electrodes and their application in nonenzymatic amperometric glucose biosensing. ACS Nano. 2009;3:2121–2128. doi: 10.1021/nn9003154. [DOI] [PubMed] [Google Scholar]
- 17.Law W.C., Yong K.T., Baev A., Prasad P.N. Sensitivity improved surface plasmon resonance biosensor for cancer biomarker detection based on plasmonic enhancement. ACS Nano. 2011;5:4858–4864. doi: 10.1021/nn2009485. [DOI] [PubMed] [Google Scholar]
- 18.Choi B.G., Park H., Park T.J., Yang M.H., Kim J.S., Jang S.Y. Solution chemistry of self-assembled graphene nanohybrids for high-performance flexible biosensors. ACS Nano. 2010;4:2910–2918. doi: 10.1021/nn100145x. [DOI] [PubMed] [Google Scholar]
- 19.Choi J., Oh B., Kim Y., Min J.U. Nanotechnology in biodevices. J. Microb. Biot. 2007;17:5–14. [PubMed] [Google Scholar]
- 20.Lee D.S., Fu Y.Q., Maeng S., Du X.Y., Tan S.C., Luo J.K. Electron Devices Meeting, IEDM 2007. IEEE International. 2007. Integrated ZnO surface acoustic wave microfluidic and biosensor system; pp. 851–854. [Google Scholar]
- 21.Li X., Zhao C., Liu X. A paper-based microfluidic biosensor integrating zinc oxide nanowires for electrochemical glucose detection. Microsyst. Nanoeng. 2015;1:15014. [Google Scholar]
- 22.Pumera M. Graphene-based nanomaterials for energy storage. Energy Environ. Sci. 2011;4:668–674. [Google Scholar]
- 23.Turner A., Karube I., Wilson G.S. Vol. 1. Oxford University Press; Oxford, New York: 1987. Biosensors: fundamentals and applications; p. 770. [Google Scholar]
- 24.Thevenot D.R., Toth K., Durst R.A., Wilson G.S. Electrochemical biosensors: recommended definitions and classification. Pure Appl. Chem. 1999;71:2333–2348. doi: 10.1016/s0956-5663(01)00115-4. [DOI] [PubMed] [Google Scholar]
- 25.Wang J. Glucose biosensors: 40 years of advances and challenges. Electroanalysis. 2001;13:983. [Google Scholar]; [25a] Borgmann S., Schulte A., Neugebauer S., Schuhmann W. Bioelectrochemistry: Fundamentals, Applications and Recent Developments. 2011. Amperometric biosensors. [Google Scholar]
- 26.Clark L.C., Wolf R., Granger D., Taylor Z. Continuous recording of blood oxygen tensions by polarography. J. Appl. Physiol. 1953;6:189–193. doi: 10.1152/jappl.1953.6.3.189. [DOI] [PubMed] [Google Scholar]
- 27.Yalow R.S., Berson S.A. Immunoassay of endogenous plasma insulin in man. Obes. Res. 1996;4:583–600. doi: 10.1002/j.1550-8528.1996.tb00274.x. [DOI] [PubMed] [Google Scholar]
- 28.Katz S.A., Rechnitz G.A. Direct potentiometric determination of urea after urease hydrolysis. Fresenius J. Anal. Chem. 1963;196:248–251. [Google Scholar]
- 29.Updike S.J., Hicks G.P. Reagentless substrate analysis with immobilized enzymes. Science. 1967;158:270–272. doi: 10.1126/science.158.3798.270. [DOI] [PubMed] [Google Scholar]
- 30.Betso S.R., Klapper M.H., Anderson L.B. Electrochemical studies of heme proteins. Coulometric, polarographic, and combined spectroelectrochemical methods for reduction of the heme prosthetic group in cytochrome c. J. Am. Chem. Soc. 1972;94:8197–8204. doi: 10.1021/ja00778a042. [DOI] [PubMed] [Google Scholar]
- 31.Racine P., Mindt W. On the role of substrate diffusion in enzyme electrodes. Biol. Aspects Electrochem. 1971:525–534. (Chapter 50) [Google Scholar]
- 32.Wang J. Electrochemical glucose biosensors. Chem. Rev. 2008;108:814–825. doi: 10.1021/cr068123a. [DOI] [PubMed] [Google Scholar]
- 33.Hikuma M., Obana H., Yasuda T., Karube I., Suzuki S. A potentiometric microbial sensor based on immobilized Escherichia coli for glutamic acid. Anal. Chim. Acta. 1980;116:61–67. [Google Scholar]
- 34.Nuzzo R.G., Allara D.L. Adsorption of bifunctional organic disulfides on gold surfaces. J. Am. Chem. Soc. 1983;105:4481–4483. [Google Scholar]
- 35.Huck H., Schmidt H.-L. Chloranil as a catalyst for the electrochemical oxidation of NADH to NAD+ Angew. Chem. Int. Ed. 1981;20:402–403. [Google Scholar]
- 36.Liedberg B., Nylander C., Lunström I. Surface plasmon resonance for gas detection and biosensing. Sens. Actuators. 1983;4:299–304. [Google Scholar]
- 37.Cass A.E.G., Davis G., Francis G.D., Allen H., Hill O., Aston W.J. Ferrocene-mediated enzyme electrode for amperometric determination of glucose. Anal. Chem. 1984;56:667–671. doi: 10.1021/ac00268a018. [DOI] [PubMed] [Google Scholar]
- 38.Csoeregi E., Schmidtke D.W., Heller A. Design and optimization subcutaneously implantable glucose electrode based on “wired” glucose oxidase. Anal. Chem. 1995;67:1240–1244. doi: 10.1021/ac00103a015. [DOI] [PubMed] [Google Scholar]
- 39.Ikeda T., FushimiI F., Miki K., Senda M. Direct bioelectrocatalysis at electrodes with D-gluconate dehydrogenase. Agric. Biol. Chem. 1988;52:2655–2658. [Google Scholar]
- 40.Bartlett P.N., Bradford V.Q., Whitaker R.G. Enzyme electrode studies of glucose oxidase modified with a redox mediator. Talanta. 1991;38:57–63. doi: 10.1016/0039-9140(91)80009-o. [DOI] [PubMed] [Google Scholar]
- 41.Kurzawa C., Hengstenberg A., Schuhmann W. Immobilization method for the preparation of biosensors based on pH shift-induced deposition of biomolecule-containing polymer films. Anal. Chem. 2002;74:355–361. doi: 10.1021/ac010830a. [DOI] [PubMed] [Google Scholar]
- 42.Weinstein R.L., Schwartz S.L., Brazg R.L., Bugler J.R., Peyser T.A., McGarraugh G.V. Accuracy of the 5-day free style navigator continuous glucose monitoring system comparison with frequent laboratory reference measurements. Diabetes Care. 2007;30:1125–1130. doi: 10.2337/dc06-1602. [DOI] [PubMed] [Google Scholar]
- 43.Mao S., Yu K., Chang J., Steeber D.A., Ocola L.E., Chen J. Direct growth of vertically-oriented graphene for field-effect transistor biosensor. Sci. Rep. 2013;3 doi: 10.1038/srep01696. [DOI] [PMC free article] [PubMed] [Google Scholar]
- 44.Lee J.A., Hwang S., Kwak J., Park S.I., Lee S.S., Lee K.C. An electrochemical impedance biosensor with aptamer-modified pyrolyzed carbon electrode for label-free protein detection. Sens. Actuator B-Chem. 2008;129:372–379. [Google Scholar]
- 45.Wang R., Ruan C., Kanayeva D., Lassiter K., Li Y. TiO2 nanowire bundle microelectrode based impedance immunosensor for rapid and sensitive detection of Listeria monocytogenes. Nano Lett. 2008;8:2625–2631. doi: 10.1021/nl080366q. [DOI] [PubMed] [Google Scholar]
- 46.Zanello P. second ed. RSC Publishing, Royal Society of Chemistry; August 5, 2003. Inorganic Electrochemistry: Theory, Practice and Applications. [DOI] [Google Scholar]
- 47.Nicholson R.S. Theory and application of cyclic voltammetry for measurement of electrode reaction kinetics. Anal. Chem. 1965;37:1351–1355. [Google Scholar]
- 48.Ansari A.A., Kaushik A., Solanki P.R., Malhotra B.D. Sol–gel derived nanoporous cerium oxide film for application to cholesterol biosensor. Electrochem. Commun. 2008;10:1246–1249. [Google Scholar]
- 49.Snir E., Amit E., Friedler A., Yitzchaik S. A highly sensitive square wave voltammetry based biosensor for kinase activity measurements. Pept. Sci. 2015;104:515–520. doi: 10.1002/bip.22653. [DOI] [PubMed] [Google Scholar]
- 50.Ali Md A., Srivastava S., Solanki P.R., Reddy V., Agrawal V.V., Kim C. Highly efficient bienzyme functionalized nanocomposite-based microfluidics biosensor platform for biomedical application. Sci. Rep. 2013;3 doi: 10.1038/srep02661. [DOI] [PMC free article] [PubMed] [Google Scholar]
- 51.Macdonald J.R., Barsoukov E. second ed. John Wiley & Sons; April 1, 2005. Impedance Spectroscopy: Theory, Experiment, and Applications. [Google Scholar]
- 52.Ghrera A.S., Pandey C.M., Ali Md A., Malhotra B.D. Quantum dot-based microfluidic biosensor for cancer detection. Appl. Phys. Lett. 2015;106:193703. [Google Scholar]
- 53.Ali Md A., Reza K.K., Srivastava S., Agrawal V.V., John R., Malhotra B.D. Lipid–lipid interactions in aminated reduced graphene oxide interface for biosensing application. Langmuir. 2014;30:4192–4201. doi: 10.1021/la4049852. [DOI] [PubMed] [Google Scholar]
- 54.Borisov S.M., Wolfbeis O.S. Optical biosensors. Chem. Rev. 2008;108:423–461. doi: 10.1021/cr068105t. [DOI] [PubMed] [Google Scholar]
- 55.Shi J., Chan C., Pang Y., Ye W., Tian F., Lyu J. A fluorescence resonance energy transfer (FRET) biosensor based on graphene quantum dots (GQDs) and gold nanoparticles (AuNPs) for the detection of mecA gene sequence of Staphylococcus aureus. Biosens. Bioelectron. 2015;67:595–600. doi: 10.1016/j.bios.2014.09.059. [DOI] [PubMed] [Google Scholar]
- 56.Matharu Z., Bandodkar A.J., Sumana G., Solanki P.R., Ekanayake E.M., Kaneto K. Low density lipoprotein detection based on antibody immobilized self-assembled monolayer: investigations of kinetic and thermodynamic properties. J. Phys. Chem. B. 2009;113:14405–14412. doi: 10.1021/jp903661r. [DOI] [PubMed] [Google Scholar]
- 57.Mayer K.M., Lee S., Liao H., Rostro B.C., Fuentes A., Scully P.T. A label-free immunoassay based upon localized surface plasmon resonance of gold nanorods. ACS Nano. 2008;2:687–692. doi: 10.1021/nn7003734. [DOI] [PubMed] [Google Scholar]
- 58.Yin M.J., Wu C., Shao L.Y., Chan W.K.E., Zhang A.P., Lu C., Tam H.Y. Label-free, disposable fiber-optic biosensors for DNA hybridization detection. Analyst. 2013;138:1988–1994. doi: 10.1039/c3an36791f. [DOI] [PubMed] [Google Scholar]
- 59.Srivastava S., Ali Md A., Solanki P.R., Chavhan P.M., Pandey M.K., Mulchandani A. Mediator-free microfluidics biosensor based on titania–zirconia nanocomposite for urea detection. RSC Adv. 2013;3:228–235. [Google Scholar]
- 60.Kumar S., Kumar S., Ali Md A., Anand P., Agrawal V.V., John R. Microfluidic-integrated biosensors: prospects for point-of-care diagnostics. Biotechnol. J. 2013;8:1267–1279. doi: 10.1002/biot.201200386. [DOI] [PubMed] [Google Scholar]
- 61.Rahman M.M., Li X.B., Lopa N.S., Ahn S.J., Lee J.J. Electrochemical DNA hybridization sensors based on conducting polymers. Sensors. 2015;15:3801–3829. doi: 10.3390/s150203801. [DOI] [PMC free article] [PubMed] [Google Scholar]
- 62.Putzbach W., Ronkainen N.J. Immobilization techniques in the fabrication of nanomaterial-based electrochemical biosensors: a review. Sensors. 2013;13:4811–4840. doi: 10.3390/s130404811. [DOI] [PMC free article] [PubMed] [Google Scholar]
- 63.https://www.pulsatom.com/.
- 64.Wang N., Hang T., Ling H., Hu A., Li M. High-performance Si-based 3D Cu nanostructured electrode assembly for rechargeable lithium batteries. J. Mater. Chem. A. 2015;3:11912–11919. [Google Scholar]
- 65.Weber J., Jeedigunta S., Kumar A. Fabrication and characterization of ZnO nanowire arrays with an investigation into electrochemical sensing capabilities. J. Nanomater. 2008;2008:1–5. doi: 10.1155/2008/638523. [DOI] [Google Scholar]
- 66.Parikh R.Y., Singh S., Prasad B.L., Patole M.S., Sastry M., Shouche Y.S. Extracellular synthesis of crystalline silver nanoparticles and molecular evidence of silver resistance from Morganella sp.: towards understanding biochemical synthesis mechanism. ChemBioChem. 2008;9:1415–1422. doi: 10.1002/cbic.200700592. [DOI] [PubMed] [Google Scholar]
- 67.Kwiatkowski M., Bezverkhyy I., Skompska M. ZnO nanorods covered with a TiO2 layer: simple sol–gel preparation, and optical, photocatalytic and photoelectrochemical properties. J. Mater. Chem. A. 2015;3:12748–12760. [Google Scholar]
- 68.Zeng S., Hu S., Xia J., Anderson T., Dinh X.Q., Meng X.M., Coquet P., Yong K.T. Graphene–MoS2 hybrid nanostructures enhanced surface plasmon resonance biosensors. Sens. Actuat. B Chem. 2015;207:801–810. [Google Scholar]
- 69.Nehra A., Singh K.P. Current trends in nanomaterial embedded field effect transistor-based biosensor. Biosens. Bioelectron. 2015;74:731–743. doi: 10.1016/j.bios.2015.07.030. [DOI] [PubMed] [Google Scholar]
- 70.Sanllorente-Méndez S., Domínguez-Renedo O., Arcos-Martínez M.J. Immobilization of acetylcholinesterase on screen-printed electrodes. Application to the determination of arsenic (III) Sensors. 2010;10:2119–2128. doi: 10.3390/s100302119. [DOI] [PMC free article] [PubMed] [Google Scholar]
- 71.www.topac.com.
- 72.https://www.graphene-info.com/graphene-fet-oxygen-adsorption-photo.
- 73.Patel M.K., Ali Md A., Zafaryab M., Agrawal V.V., Rizvi M.M., Ansari Z.A. Biocompatible nanostructured magnesium oxide-chitosan platform for genosensing application. Biosens. Bioelectron. 2013;45:181–188. doi: 10.1016/j.bios.2012.12.055. [DOI] [PubMed] [Google Scholar]


