

This chapter provides a comprehensive review of miniaturized immunoassays. The economic considerations and user needs are discussed. There is a comprehensive analysis of the fundamentals of miniaturization, explaining how the relative effects of forces like surface tension and gravity change as devices and fluidics are reduced in size. These effects can be harnessed to manage flow and other kinetic elements, using forces such as capillary flow. Other means of fluid actuation and movement are described. There is a review of the types of device available, including a systematic look at the key elements of an immunoassay: antibodies, capture/solid phase, calibration, and signal generation and detection, which are covered in further detail. Methods used for microfluidic flow control are described. Analytes for which microfluidic devices have been reported are listed. There is a comprehensive list of commercial microfluidic immunodiagnostic systems, with sources of further information. The final part of the chapter covers microarrays and the detection methods associated with them. This part includes tables of label-free detection methods and commercial microarray systems, The outlook for microarrays in clinical diagnosis is considered.
In the Products part (7) of this book, many different commercially available immunoassay systems are described. The instrumentation ranges in size from floor-standing laboratory analyzers to compact point-of-care (POC) testing devices. The first POC tests (for human chorionic gonadotropin) were based on agglutination on a slide (Santomauro and Sciarra, 1967) and since then there has been a continuous expansion in the available range (Kasahara and Ashihara, 1997, Price, 1998, Rasooly, 2006, Sia and Kricka, 2008, Gervais et al., 2011a). Although conventional POC tests were self-contained and comparatively small, the reagents and reaction vessels could easily be seen without the aid of magnification. However, over the last decade or so a large variety of microscale immunoassays have been demonstrated within research laboratories, and a considerable number is already in the market place with a strong pipeline of near market-ready devices. While some of the microscale immunoassays have nanoscale elements, true nanofluidic immunoassays are still in the early development stage, and it remains to be seen if they can become technically and commercially viable.
There are a number of primary objectives of miniaturization:
-
•
Financial—reduction in the costs of biological materials consumed and the manufacturing processes.
-
•
Environmental—reduction in biohazardous solid and liquid waste and packaging.
-
•
Simplification—integration of all of the immunoassay steps (including sample preparation, analysis, data handling, and result presentation), which is essential for POC, single use assays.
-
•
Mobility—ease of use in field situations, e.g., in resource poor settings.
-
•
Scope—capability for multiple simultaneous testing for many different analytes, for example, in proteomic studies.
-
•
Speed—faster reaction kinetics arising from shorter diffusional distances.
Taking the concept of assay miniaturization further, the analyzer instrumentation may also be re-engineered to become integral with the test unit, resulting in fully disposable immunodiagnostic tests. Microchip-based analyzers have a number of potential advantages and benefits when compared with conventional macroscale analyzers (Table 1 ).
TABLE 1.
Selected Advantages and Disadvantages of Miniaturized Analyzers
| Advantages |
| High-volume low-cost manufacture |
| Rapid low-cost design cycles |
| Low sample volume |
| Rapid analysis |
| Simultaneous multi-analyte assays |
| Integration of analytical steps (LOC) |
| Small footprint facilitates extra-laboratory applications |
| Encapsulation for safe disposal |
| Disposable |
| Disadvantages |
| Nonrepresentative sampling |
| Sensitivity limitations |
| Human interface with microchips |
| Calibration |
| Cost per test |
The idea to integrate complex analytical functionality into small compact devices is based on the concept of micro total analysis systems (µTAS), as first postulated by Manz and coworkers in the early 1990s (Manz et al., 1990, Manz et al., 1993). The concept is aimed at integrating as many as possible of the processing steps of sampling, sample pretreatment, separation, detection and data analysis into compact lab-on-a-chip (LOC) devices. Distinguishing these devices from immunosensors is the ability to incorporate a separation step, thereby avoiding typical sensor problems related to multi-analyte detection and interference (Harrison et al., 1992, Harrison et al., 1993). Although lateral flow tests may be regarded as a form of LOC, these are discussed elsewhere (see Lateral Flow Immunoassays).
Microchips as required for LOC-based devices are miniaturized assemblies, typically involving dimensions between 100 nm and 1 mm. Usually, these chips are two-dimensional in appearance and manufactured as a series of layers. Microfluidic microchips (also called fluidic microchips) are chips that contain chambers interconnected by narrow channels, along which sample and reaction fluids are transferred. Different assay stages are performed at different locations on the chip. Internal volumes depend on the cross-section and geometry of the particular structures but are usually in the nanoliter to microliter range.
Bioelectronics chips have an interface between biomolecules (antibodies, antigens, or signal generating molecules) and nonbiological materials, resulting in a transfer or modulation of signal from the biomolecule to the device, which can be amplified electronically. They contain built-in electrical components in combination with fluidic elements. The electrical components (e.g., electrodes) are located within, for example, a microchamber, and used to manipulate a fluid, or constituents thereof, contained within the chamber (Ronkainen et al., 2010). The chip is usually fabricated on an electronic board that provides the connections to the electrical components within the chip and plugs into a controller–monitor.
In its original form, a microarray comprised an ordered collection of reagents immobilized on the surface of a small, planar piece of silicon, glass, or plastic (a chip) (Schena, 1999, Schena, 2000). The array is formed by spotting, stamping, or depositing the reagents or by in situ synthesis of the reagents on the surface of the chip, and the location of the reagent on the array is used for identification. In an alternative, bead-based, format, the reagents are coupled to micron size beads of differing optical properties that are capable of being individually identified during measurement. Microarrayed reagents have included complementary deoxyribonucleic acid (cDNA), oligonucleotides, aptamers, antibodies, affibodies, antigens, oligopeptides, and tissue sections. The size, density, and number of locations (microspots) on an array vary widely. Spot sizes are often less than 100 µm, and arrays with hundreds of spots per square centimeter are in routine use.
Microfabrication of early microfluidic systems was mainly based on etching of glass or silicon substrates followed by thermal bonding to yield enclosed channels (Madou, 2011). Immunoassay applications focused on homogeneous formats with an electrophoretic separation step. Over the last 10 years or so, there has been a marked shift toward polymer chips fabricated by injection molding or embossing, followed by lamination (Becker and Locascio, 2002, Liu, 2007, Becker and Gaertner, 2008). These replication-based approaches make low-cost microfluidics a reality, as needed for disposable POC immunodiagnostics. Typical substrate materials include polystyrene, polycarbonate, polymethylmethacrylate, and cyclic olefin copolymers (Nunes et al., 2010). Polydimethylsiloxane (PDMS) devices have found widespread use in the academic domain, as they can be manufactured by a simple casting process, and the surface can be functionalized for immunoassay requirements (McDonald et al., 2000, Sia and Whitesides, 2003, Zhou et al., 2010). Interestingly, injection molding of thermoplastics and casting of PDMS can be extended into nanoscale patterning (Attia et al., 2009).
It is perhaps inevitable that immunoassay scientists and engineers, who have already proved to be exceptionally innovative, find themselves drawn to nanotechnology. Since immunoassays are effectively molecular reactions, immunoassays appear to lend themselves to miniaturization, with potential advantages of cost reduction and greater capacity. Nanotechnology describes systems that operate at the atomic, molecular, or macromolecular level with dimensions less than 100 nm. Although immunoassays involve molecular interactions, to qualify as nanotechnology, the system must have an element of structure, fabrication, or control at this scale. It includes larger structures that are assembled from components at the nanometer scale and nanoparticles, which have a size of 100 nm or less.
Compared to microfluidics, which can be filled via passive capillarity or actuation based on the application of, e.g., a pressure differential, electric fields, rotational forces, or dynamically altered surface wettability, the driving of fluids at the nanoscale necessitates novel nanofluidic approaches to overcome the dominating surface effects (Sparreboom et al., 2010, Eijkel and Van den Berg, 2005). While a multitude of nanoscale analytical systems has already emerged, immunodiagnostic devices have so far been elusive (Sparreboom et al., 2009, Napoli et al., 2010).
To understand the challenges and potential advantages of micro- and nanoscale immunoassays, some basic theoretical principles need to be understood. At the micro- and nanoscale, there are many differences from conventional immunoassays.
Fundamentals of Miniaturization
There are a number of fundamental differences between macroscale and micro- or nanoscale analytical systems as described in a number of publications (Janasek et al., 2006, Gad-El-Hak, 2006, Kirby, 2010). These changes affect immunoassays mainly in terms of fluid flow and the number of analyte molecules being sampled, i.e., the “detectability issue.” While this section focuses on the microscale format, nanoscale considerations are also introduced.
Viscosity and Surface Tension
Surface tension results from the intermolecular attractive forces at the surface of a liquid and is strong for water, due to the hydrogen bonding between adjacent water molecules. In aqueous biological fluids such as blood, urine, and sputum, additional intermolecular attractive forces create higher surface tension and increase viscosity.
Even at the centimeter scale, surface tension can affect the distribution of sample and reagents in an assay vessel, such as a microtiter® plate well. As the size of an object decreases, its volume and inertia decreases by a power of three. Surface tension only decreases linearly with downscaling. Hence at the micro- and nanoscale surface tension is the dominant force, and control of surface properties becomes crucial.
Wetting is the ability of a solid surface to be contacted by a liquid wetting phase. The degree of wetting, or wettability, is determined by the balance of adhesive forces on the surface (free surface energy) and cohesive forces within the wetting phase (surface tension). The wetting phase will tend to spread on the solid surface, and a porous solid will tend to imbibe the wetting phase. In the case of immunoassays, it is important that the channels along which fluids pass have a high wettability for aqueous solutions. Wettability is determined by measuring the contact angle of a drop of the aqueous solution on the solid, which may be plastic, glass, or metal.
Surface tension can be corrected for by using hydrophilic surfaces that attract the droplet. There are a number of methods used to increase the wettability of plastics used in assay devices. They include corona discharge and plasma treatment. Chemical surface treatments include cleaning, priming, coating, and etching. Increasing temperature decreases surface tension (and viscosity) but has limited potential with immunoassays as proteins denature at higher temperatures. Surfactants may also be added to the sample or flow matrix to enable wetting of hydrophobic surfaces such as injection molded plastics. However, surfactants may interfere with immunoassay binding.
Capillary Flow
Capillary flow exploits surface tension effects in high surface-to-volume media including porous substrates (e.g., nitrocellulose-based lateral flow devices) and enclosed microstructured surfaces (e.g., microchip-based immunodiagnostics) (Eijkel and van den Berg, 2006). Water molecules are attracted by hydrophilic surfaces on the inside of such media, causing the leading edge of a narrow tube of water to move along, even against the force of gravity. Capillary action occurs when the adhesion to the walls is stronger than the cohesive forces between the water molecules. The same attraction between water molecules that is responsible for surface tension causes the leading water molecules to pull the neighboring water molecules along behind them. Capillary forces are exerted at the contact perimeter of liquid and channel walls and therefore scale favorably with miniaturization. This is due to the perimeter becoming larger relative to the channel cross-sectional area upon downscaling. During capillary filling of microchannels, the meniscus proceeds with the square root of time based on the linearly increasing flow resistance of the filled channel segment, as described by the Lucas–Washburn equation (Delamarche et al., 2005). However, this slowdown of passive filling in constant cross-section channels can be overcome by tailoring the device geometry and/or the surface hydrophobicity, effectively yielding “programmable” passive microfluidic circuits.
Electroosmotic Flow
For electrokinetic microscale immunoassay systems, Electroosmotic flow (EOF) is a convenient means of fluid actuation. EOF is based on the formation of ion layers on charged surfaces, for instance microchannels on glass, silicon, or plasma-treated plastic substrates. Here, sample constituents form static and mobile layers of counter ions on the charged surface. When an electric field is applied along the channel, the mobile counter ion layer will migrate toward the oppositely charged electrode. For microscale systems this will generate a bulk flow of liquid in the channel. EOF is convenient for manipulating fluid around a microchip via electric fields but does require charged surfaces, which are more difficult to obtain on injection molded plastic microfluidics.
The Effects of Reduced Volume on Low-Concentration Samples
The concentration of analyte in a sample is constant, regardless of the sample size. As the sample size is reduced, the number of molecules in the sample decreases. Immunoassay analytes are typically in the micro-, nano-, or picomolar concentration range.
From Table 2 , it can be seen that this places a fundamental restriction on scale for immunoassays. If the sample size is 1 fL, the scale of the sample is 1 µm3, which is 10 times larger than a true nanotechnology component. Yet if the sample has a concentration of 1 nmol, there is a reasonable chance that not one molecule of analyte will be in the sample.
TABLE 2.
Effect of Volume on Number of Molecules in a Sample Containing 1 nmol Analyte per Liter
| Volume | Dimensions | Number of Molecules |
|---|---|---|
| 1 L | 100 mm × 100 mm × 100 mm | 6 × 10¹⁴ |
| 1 mL | 10 mm × 10 mm × 10 mm | 6 × 10¹¹ |
| 1 µL | 1 mm × 1 mm × 1 mm | 6 × 10⁸ |
| 1 nL | 100 µm × 100 µm × 100 µm | 600,000 |
| 1 pL | 10 µm × 10 µm × 10 µm | 600 |
| 1 fL | 1 µm × 1 µm × 1 µm | 0 or 1 |
The impact of low volume on the assay of low-concentration samples is different for qualitative and quantitative determinations. If a theoretically perfect immunoassay could be developed with a detection efficiency of 100% (i.e., it detects every molecule that is in the sample) and a signal-to-noise ratio of greater than 1000, then a qualitative assay could be designed based on a sample volume of less than 200 fL in the example above. However to reduce the error of a quantitative immunoassay to 1%, the number of analyte molecules has to be 10,000 (because the standard deviation is approximately equal to the square root of the number of molecules), and the sample size would have to be 17 pL.
One way to alleviate the problem of sample volume in a nanoscale device is to draw the required volume of sample across the device, so that the number of molecules brought into contact with the capture antibody or antigen is increased (Eijkel, 2007). Time integrated flow-through systems with antibody or antigen immobilized onto a surface allow analyte to be absorbed and concentrated at one point. However, it is important to remember that in both competitive and immunometric immunoassays, the volume of sample needs to be defined either via fixed volume addition or constrained by system design. The notable exception to this rule is ambient analyte immunoassay (see Ambient Analyte Immunoassay).
Effect of Reduced Volumes on Kinetics
A beneficial effect of immunoassay miniaturization is the reduced distance that molecules need to travel. The time it takes for a molecule to diffuse, scales with the second power of the diffusion distance and is inversely proportional to the molecule’s intrinsic diffusion coefficient, which is mainly governed by the molecule’s size.
In liquid-phase assays, all molecules move freely in solution. Unless the sample is excessively diluted by the assay reagents, the volume does not directly affect the chance of antigen and antibody coming into contact. But as assay methodology has progressed the focus has moved to heterogeneous, solid-phase immunoassay, a format that requires a separation step. In solid-phase assays, one of the key reactants is immobilized. This reduces the speed with which the assay progresses as only the reactant in the liquid phase can freely move about. The use of very small volumes with associated shortened diffusion times in microscale assays therefore increases the reaction rate and decreases the time required to equilibrium, resulting in overall reduced analysis times.
A further approach to enhance kinetics is to move the sample across a detector for a period of time or to use electric fields to attract molecules to binding surfaces. In this flow-through configuration, it is important to minimize the diameter of the flow cell comprising the immobilized capture antibody (Hofmann et al., 2002). Electric methods to attract biomolecules to sensing surfaces include electrothermal effects (Sigurdson et al., 2005, Feldman et al., 2007) and dielectrophoretic approaches (Yasukawa et al., 2007, Hart et al., 2010); for more details, see recent reviews (Wang, 2006, Ronkainen et al., 2010).
Toward Nanoscale Analysis Systems
Interestingly, a lot of the above considerations need to be refined for nanoscale analysis systems. Conventional scaling laws seem to break down at the nanoscale, with an additional “detectability” issue in that too few molecules are present for representative detection (Janasek et al., 2006). This could be partially responsible for the lack to date of meaningful nanoscale immunoassay systems. However, it should be pointed out that much of the nanotechnology research is still in its infancy and that the detectability issue can be overcome through systems that are nanoscale only in one dimension and/or through time integration approaches where the signal is built up over time (Eijkel, 2007).
Immunoassay Design at Micro- and Nanoscale
Assay Format
There are two commonly used immunoassay formats: competitive and immunometric (also referred to as noncompetitive) (see Principles of Competitive and Immunometric Assays). A fundamental limitation of competitive immunoassays is that the signal levels at zero and very low concentrations of analyte are relatively high, causing a low signal-to-noise ratio and impaired sensitivity. Since micro- and nanoscale immunoassays produce very low levels of signal, it is advantageous to use the immunometric format to maximize the signal-to-noise ratio.
The effective removal of unbound signal-generating moieties is crucial to heterogeneous immunoassay performance, i.e., the ultralow concentration of bound label can only be measured precisely if all unbound label is washed away. While active washing steps can be incorporated into microfluidic immunodiagnostic devices, for passive sys-tems it can be very challenging to achieve separation efficiencies >99.99% as routinely employed in automated clinical analyzers (see Separation Systems).
As a subcategory of heterogeneous assays, the ambient analyte assay format offers two distinct advantages. First, it is unique in that sample dosing is not required, as capture antibody only “samples” analyte in close vicinity of the antibody zone. Secondly, this assay format involves small microspots of antibody, typically less than 100 µm in diameter and spaced less than 50 µm apart, which lends itself to manufacture at the microscale and immunoassay arrays (see Ambient Analyte Immunoassay).
In homogeneous immunoassays, both detection antibody and analyte are in the liquid phase. Most homogeneous immunoassay formats tend to have less sensitivity than heterogeneous assays but offer a distinct advantage in not requiring a separation step to remove unbound labeled detection antibody (see Homogeneous Immunoassays).
Separation-based systems include affinity-based electrophoretic and electrochromatographic assays, both generally referred to as electrokinetic assays (Hou and Herr, 2008). Electrokinetic separation assays can be further differentiated into the following categories: (i) affinity preparative: affinity-based binding occurring before or during separation, (ii) pre-equilibrated affinity assays : affinity reagents and sample mixed to equilibrium before chip-based separation, and (iii) on-chip equilibrated affinity assays: affinity reagents and sample mixed dynamically in a separation channel. The affinity preparative approach can be used for immunoenrichment or immunodepletion (Breadmore, 2007). This can help to lower the detection limits and widen the dynamic range of immunodiagnostic assays, in particular when performed in complex clinical samples (Mondal and Gupta, 2006). LOC-based microfluidic systems are well suited for on-chip equilibrated affinity assays, as multiple steps can be integrated onto a single chip, with parallel processing as an added option. The simultaneous determination of four hormones in blood, saliva, and urine after immunoextraction, labeling, electro-elution, and 2min electrophoretic separation has already been demonstrated (Wellner and Kalish, 2008). The immunoaffinity sample preparation has even allowed the analysis of skin biopsy samples for 12 inflammation markers, again with electrophoretic separation of all markers bound to a fluorescently labeled detection antibody (Phillips and Wellner, 2007). Other electrokinetic separation-based microfluidic immunodiagnostic systems include a device for measuring anti-inflammation drugs in plasma (Phillips and Wellner, 2006), a four channel system for monitoring insulin islet secretion (Dishinger and Kennedy, 2007), and a device for simultaneous quantification of four cancer markers in serum after a 50s electrophoretic separation (Yang et al., 2010).
Yager and coworkers have developed diffusion-based immunoassays where bound and unbound detection antibodies are differentiated by diffusivity changes. Micronics Inc., Redmond, WA, USA has developed a competitive homogeneous immunoassay in a T-sensor fabricated on a glass-Mylar-glass hybrid chip that comprises two fluid inlets that lead to two channels that merge into a single 100µm-deep × 1200µm-wide channel that connects to a fluid outlet (Kamholz et al., 1999, Hatch et al., 2001). Under laminar flow conditions, the two fluid streams (the antibody reagent and the sample spiked with fluorescein-labeled antigen) flow side-by-side, and the only mixing is by diffusion. Diffusion of antigen into the parallel stream is governed by the fraction that binds to antibody in the parallel flowing stream. Competition between sample antigen and labeled antigen for binding sites in the antibody stream provides the basis for antigen quantitation. An advantage of this assay is that diluted whole blood can be assayed without the need to remove red cells. An assay for phenytoin in whole blood (10- to 400-fold dilution) required less than 1 min and detected 0.43nM phenytoin (Hatch et al., 2001).
Integrated Disposable versus Cartridge–Reader Configurations
An important consideration for immunoassay design is the targeted immunodiagnostics format. The components of an ideal immunodiagnostic device for POC are illustrated in Fig. 1 .
FIGURE 1.

Components of an ideal POC diagnostic device. The device quantitatively detects several analytes from body fluids within minutes at adequate sensitivity and reports the encrypted results to an electronic health record. The microfluidic chip is disposable with a material cost of less than $1 in volume production.
(The color version of this figure may be viewed at www.immunoassayhandbook.com). Legend adapted, graphic reproduced from Gervais et al. (2011a) with permission. Copyright 2010 IBM Corporation.
Most devices targeted at the POC are in a cartridge–reader configuration (e.g., Alere TRIAGE® system) while fully disposable tests are also emerging (e.g., Bayer A1CNow+®), mainly targeted at home testing and low-resource settings. An overview of key considerations derived from the targeted device format is provided in Table 3 .
TABLE 3.
Key Considerations for Different Immunodiagnostics Configurations
| Integrated Disposable | Cartridge–Reader | |
|---|---|---|
| Assay format |
|
|
| Fluid actuation | Passive | Passive or active |
| Calibration | Fixed at manufacture (stored on chip) | Can be adjusted to prolong shelf life or provide accuracy verification |
| Detection | Simple, low-cost integrated | Can be complex in reader |
A key constraint for fully disposable devices is the difficulty of implementing active fluid actuation, as no peripheral equipment can be used (e.g., pumps). The onus is on the development of passive devices based on capillarity filling of the microfluidic circuit, which, for heterogeneous assay formats, may give rise to problems with washing away unbound detection antibody. For passive systems, excess sample needs to be used for washing. The effect of the immunodiagnostic device format on standardization and calibration, signal generation, and detection will be covered in the following sections.
Antibodies
The requirement for antibodies with appropriate specificity is the same as with normal scale immunoassays. However, there is an increased need in microscale immunoassays for antibodies with high affinity (i.e., a high value of K eq, >1010). Monoclonal antibodies offer the highest potential concentration of active antibodies (advantageous for a micro- or nanoscale device), but most monoclonal antibodies lack the high affinities achievable with polyclonal antibodies. The ideal antibody would be monoclonal and have very high affinity. Such antibodies are possible using phage display to generate high affinity antibodies (typically K eq is 107–109) from a large phage display library, followed by selective modification of the amino acid sequences of the complementarity determining regions using a sequencer to generate new phage DNA sequences. In this way, monoclonal antibodies can be generated with affinities of ≥1011 See antibodies.
Capture Antibody Support
For heterogeneous immunoassays, reagents can be immobilized on beads within microfluidic structures (Tarn and Pamme, 2011). This not only increases the surface-to-volume ratio for capture antibody immobilization but also reduces analyte diffusion distance for enhanced mass transport. Typical bead matrices include polystyrene/latex (Ohashi et al., 2009, Yuan et al., 2009, Ihara et al., 2010) and glass (Tsukagoshi et al., 2005).
Magnetic beads provide an additional advantage by avoiding the need for a physical confinement barrier. The beads are held by magnetic forces and can be released on demand by switching off the magnetic field (Pamme, 2006). Not surprisingly, a whole variety of magnetic bead-based immunoassays has been implemented in a microfluidic format (Hayes et al., 2001, Choi et al., 2002, Petkus et al., 2006, Mulvaney et al., 2007, Do and Ahn, 2008, Peyman et al., 2009, Chen et al., 2011).
More commonly, however, internal surfaces within the microfluidic structure are used for immobilization of antigens or antibodies by coating the surfaces with immunoreagents. Immobilization methods include physical adsorption, self assembled monolayers, sol–gels, and covalent coupling (Shankaran and Miura, 2007). Common chemistries are based on dextran layers, protein A or G, and biotin–streptavidin. An important differentiation is the orientation of the functional groups, which can limit activity of the immobilized antibody. Directional functionalized self-assembled monolayers (SAMs) can be produced in microchannels via microcontact printing of the antibody (Foley et al., 2005).
A further option is to locate the antibody directly on a sensing surface such as for surface plasmon resonance (SPR) or surface enhanced Raman scattering (SERS). Similarly antibodies can be located on electrodes or field effect transistors (FETs) for electrochemical detection, or on a quartz crystal microbalance (QCM), or cantilevers for electromechanical detection, see On-Chip Detection Methods for details.
Standardization and Calibration
The challenges of standardization and calibration in quantitative microscale immunoassays are much the same as at the normal scale (see Standardization and Calibration). Just as for the clinical analyzer counterparts, preparations traceable to international standards are used to confirm the accuracy of microchip-based immunodiagnostics. Microfabrication techniques are capable of producing identical assay channels and wells in a microchip, so that if calibrators and samples are run together the sample concentrations may be estimated by direct reference to a calibration curve. In microscale assays, the kinetics are faster, and this allows assays to progress to equilibrium in a shorter time. Assays that reach equilibrium are more forgiving of small differences in assay conditions between samples and calibrators. Also at very small scale, it is easier to achieve equilibrium temperature quickly across a range of samples.
Immunometric assays with near-linear dose–response curves may require no more than two calibrators, and in theory, an assay with very low nonspecific binding (NSB) and linear dose–response can be calibrated with just one calibrator. While (re-)calibration by the operator is clearly an option for cartridge–reader-based systems, by adjustment of calibration based on the response to a known concentration of analyte, such processes are difficult to achieve for disposable POC immunodiagnostics. Here, factory-generated calibration curves may be used and stored electronically on the test devices, and any deterioration of accuracy on storage over time cannot be compensated for and adjusted but simply provides a limitation of validated shelf life.
Matrix effects such as those between buffer-based calibrators and blood samples, may be exaggerated in microchannels, because of differences in surface tension. These effects can be reduced by diluting samples, but this introduces a manual intervention requirement and lessens the number of molecules in the sample, which may impair assay sensitivity. For disposable immunodiagnostics, storing buffer solutions on microchips is also difficult to implement, with fluid evaporation limiting shelf life of the diagnostic test.
Signal Generation
In immunoassays, the signal is potentially weak because of the very low concentration of analyte. In a microscale assay format, the signal will be weaker still so it is essential that a very high specific activity label is used. A high signal-to-noise ratio must be achieved, so sources of noise must be eliminated. While a detailed discussion of signal generation systems in immunoassays is provided in a separate chapter (see Signal Generation Systems and Detection Systems), here, we discuss the specific signal generation challenges and solutions for microscale immunoassays.
In conventional immunodiagnostic tests, the enzyme-linked immunosorbent assay (ELISA) format is widely employed, as it adds a signal amplification factor by means of enzymatic action. Commonly, horseradish peroxidase (HRP) is used in conjunction with color-forming 3,3′,5,5′-tetramethylbenzidine (TMB). However, at the microscale, the optical path length for absorbance-based readout of color change is limited. Within the field of optical detection, this partially explains a shift toward chemiluminescence-based readout at the microscale, which is also easier to implement, as only a detector is required.
Signal amplification can also be achieved via silver-enhanced nanoparticle labels (Nam et al., 2003). Here, gold nanoparticle labels with high diffusivity are catalytically enlarged via silver deposition after complex formation. The resulting silver-coated label can be detected with high sensitivity using simple cameras or scanners with concomitant benefits for POC diagnostics (Chin et al., 2011).
The vast majority of microscale-based immunodiagnostic methods, however, still rely on the use of fluorescent labels, most commonly conjugated to a secondary detection antibody for sandwich immunoassay type tests. Rather than using single dye molecules, beads carrying a large number of dye molecules are preferred, as they yield a stronger fluorescent emission. Recently, fluorescent beads with a large Stokes shift between excitation and emission light have become available that facilitate spectral filtration in integrated disposable immunodiagnostics devices. As an example, TransFluoSpheres™, which comprise a cascade of dyes in a polystyrene bead matrix and generate Stokes shifts of up to 200 nm, are particularly useful and have been applied to immunodiagnostic chips with integrated head-on fluorescence detection (Ryu et al., 2011).
The current focus on enhancing signal generation for microchip-based immunodiagnostics with optical detection is on the use of nanotechnology-derived probes (Myers and Lee, 2008, Azzazy et al., 2006). Quantum dots (Q-dots) are of particular interest, as they have a narrow and tuneable emission perfectly suited for multiplexed detection (Lee et al., 2007). These semiconductor particles, which are often encapsulated in polymer microbeads, have already been applied to the simultaneous microchip-based detection of HIV, HBV, and HCV (Klostranec et al., 2007). At present, problems remain in Q-dot cost, functionalization, and stability, hence the limited number of POC diagnostic applications.
An interesting alternative to Q-dots for signal generation is rare earth metal containing ceramic nanospheres that act as up-converting phosphors (Yan et al., 2006). Here, light is absorbed in the infrared and emitted in the visible spectrum, resulting in an effective anti-Stokes shift. This avoids background autofluorescence in body fluids and hence enhances signal-to-noise in quantitative diagnostic applications.
For non-optical detection approaches, the increased surface-to-volume ratios encountered in microscale systems can be exploited. This is particularly the case where sensing surfaces are used for signal generation, as is the case in electrochemical and electromechanical detection systems. The next section reviews existing optical and non-optical detection solutions and their implementation at the microscale.
On-Chip Detection Methods
In microchip-based analytical devices (Jiang et al., 2011), constraints are imposed by the small volumes and short optical path lengths (Myers and Lee, 2008). Additionally, there is a need for low-cost and portable detection systems for POC applications, without compromising sensitivity and precision (Weigl et al., 2008). The following section outlines how this challenge has been addressed, with Table 4 providing an overview of optical and non-optical on-chip detection methods.
TABLE 4.
On-Chip Immunoassays—Detection Methods
| Detection Method | Reference |
|---|---|
| Absorbance | (Lee et al., 2009a, Maier et al., 2008) |
| Fluorescence | (Herr et al., 2007, Ryu et al., 2011, Ruckstuhl et al., 2011, Jokerst et al., 2008, Meagher et al., 2008) |
| Fluorescence polarization | (Tachi et al., 2009) |
| Phosphorescence | (Yan et al., 2006) |
| Chemiluminescence | (Yacoub-George et al., 2007, Yang et al., 2009, Bhattacharyya and Klapperich, 2007, Sista et al., 2008b) |
| TLM | (Ihara et al., 2010) |
| SERS | (Mulvaney et al., 2003, Cho et al., 2009) |
| SPR | (Karlsson et al., 1991, Lee et al., 2007b, Feltis et al., 2008, Chinowsky et al., 2007) |
| Potentiometric | (Chumbimuni-Torres et al., 2006) |
| Amperometric | (Yoo et al., 2009, Nie et al., 2010) |
| Conductometric | (Liu et al., 2009) |
| Capacitive | (Ghafar-Zadeh et al., 2009) |
| FET | (Cui et al., 2001, Stern et al., 2010) |
| QCM | (Uludag and Tothill, 2010) |
| Cantilever | (Waggoner et al., 2010, Luchansky et al., 2011) |
Reviews: Jiang et al., 2011, Myers and Lee, 2008, Weigl et al., 2008.
Absorbance detection is adversely affected by the reduced optical path lengths in microchips, as defined by the Lambert–Beer law. A number of elegant solutions have been developed to increase optical path lengths by rerouting the light by means of mirrors or lenses to probe a larger sample volume, as described in a review (Myers and Lee, 2008). In contrast, Lee and coworkers used deep 6mm detection chambers in a compact disk (CD)-based system and 450/630nm LEDs coupled with Si-photodiodes to detect HRP label-induced TMB color change in an on-chip ELISA for hepatitis B (Lee et al., 2009a). Maier and coworkers have used gold nanoparticle labels in a resonance-enhanced absorption for ELISA-based determination of food-based allergens (Maier et al., 2008). Detection limits of 1 ng/mL were achieved with semiquantitative visual readout but could potentially be improved with readout instrumentation.
There has been extensive development of fluorescence detection capabilities in microchip-based immunoassays. Early work focused on laser-induced fluorescence (LIF) where high-energy laser light is focused on a small area, with the narrow spectral emission facilitating discrimination between excitation and emission light (Chiem and Harrison, 1997, Jiang et al., 2000). Multichannel microfluidic immunoassays with simultaneous readout based on a scanning fluorescence detection system have also been developed (Cheng et al., 2001). More recently, an integrated portable LIF detection device for oral immunodiagnostics has been demonstrated, yielding nanomolar to picomolar sensitivity for saliva-based periodontal disease markers (Herr et al., 2007). McDevitt and coworkers have reduced the functionality of a conventional benchtop epi-fluorescence microscope into a handheld diagnostic device for CD4+ T-cell counting in HIV patients by drawing on the unique spectral properties of Q-dots (Jokerst et al., 2008). A compact integrated LIF immunodiagnostic system with picomolar sensitivities for a panel of biological toxins has been developed by Sandia National Laboratories (Meagher et al., 2008). The system is based on integrated electronics and miniaturized optics comprising diode lasers, mirrors, lenses, filters, and a photomultiplier tube (PMT). As a first step toward potentially fully disposable fluorescence detection systems, Ryu and coworkers have developed an integrated immunodiagnostic detection system based on inorganic LEDs and organic photodiodes with nanograms per milliliter sensitivities reported for cardiac markers myoglobin and creatine kinase MB (CK-MB) isoenzyme (Ryu et al., 2011).
Baba and coworkers have recently demonstrated a homogeneous microchip theophylline assay with fluorescence polarization detection (Tachi et al., 2009). Detection is based on measuring polarization changes when the rotational motion of the fluorescent label is altered by binding to the analyte. In the cited work, this change is quantified via the use of a laser, a charge-coupled device (CCD) camera and fixed and rotatable polarizers. Very recently, a novel supercritical angle fluorescence (SAF) immunoassay concept has been implemented in disposable polymer test tubes and validated by detecting interleukin-2 at low picomolar levels (Ruckstuhl et al., 2011). SAF occurs only at the surface of transparent substrates and as such can be used to discriminate between surface binding and bulk effects, hence circumventing the need for laborious ELISA-type washing steps.
To overcome some of the limitations of fluorescence-based detection in terms of spectral overlap between excitation and emission light, longer lived phosphorescence could be exploited in a time-gated detection approach where excitation light is pulsed and emission detected after the pulse ends. However, this approach requires sophisticated lock-in detection electronics, which might explain why it has not yet been applied to POC immunodiagnostic assays. A separate approach based on up-converting phosphors (see Signal Generation) has recently been demonstrated for the determination of Yersinia pestis using a compact and portable readout device with 980nm laser diode-based excitation and PMT-based detection of emitted light at 541 nm (Yan et al., 2006).
Chemiluminescence is a popular detection technology choice for immunodiagnostics, as optical excitation instrumentation is not required, which is particularly attractive for integrated disposable device formats. In early work on a model mouse IgG immunoassay, HRP-labeled conjugate was detected on a capillary electrophoresis microchip using standard luminol/peroxide chemistry (Mangru and Harrison, 1998). An aluminum mirror fabricated onto the back side of the detection zone provided a reflective surface to enhance collection efficiency of the emitted light, yielding a linear range for mouse IgG of 0–60 µg/mL. More recently, chemiluminescence detection has been extended to a 10-channel capillary flow-through sandwich immunoassay for biological agent detection (Yacoub-George et al., 2007). Here, microperistaltic pumps were used to drive fluid in 10 parallel microchip mounted capillaries with HRP-based chemiluminescence detection on a multianode-photomultiplier array. A magnetic bead-based immunoassay for C-reactive protein (CRP) in serum has been demonstrated on a microchip with integrated pneumatically driven micropumps, microvalves, and micromixers (Yang et al., 2009). Chemiluminescence detection was based on an acridium ester label on the detection antibody and off-chip luminometer-based readout, yielding a detection limit of 0.0125 mg/L for CRP. A 0.1mg/L detection limit for an indirect CRP immunoassay has been demonstrated in serum on a multichannel injection molded cyclic olefin chip using HRP/luminol-based chemiluminescence generation and benchtop imaging system readout (Bhattacharyya and Klapperich, 2007). More interestingly, an onboard instant film module has also been tested which, when compared against reference films, could potentially be exploited in a qualitative POC setting. A magnetic bead-based immunoassay for insulin and interleukin-6 on a digital microfluidic platform has been demonstrated by Pamula and coworkers (Sista et al., 2008b). Here, HRP labels were reacted with PS-Atto substrate and read out on a PMT.
Thermal lens microscope (TLM)-based detection uses a dual laser beam system to measure the photothermal effect on nonfluorescent molecules, with colloidal gold labels typically employed. In early work, TLM has been effectively applied to an immunometric immunoassay for determination of human secretory immunoglobulin A and carcinoembryonic antigen (CEA) (Sato et al., 2000, Sato et al., 2001). Using capture antibody-coated polystyrene beads confined in a 100µm-deep × 250µm-wide glass channel, a 0.03ng/mL detection limit for CEA was achieved after 10min incubation. More recently, Kitamori and coworkers have applied high-sensitivity TLM detection to a microchip-based open-sandwich ELISA for human osteocalcin in serum (Ihara et al., 2010). Using a 658nm excitation, 785nm probe beam, and a photodiode detector, a sensitivity of 1.0 µg/L could be demonstrated for osteocalcin, equivalent to plate-based ELISA results.
In SERS spectroscopy, the molecular fingerprint signals of the Raman spectra are enhanced when the molecules come in close proximity of a metal surface where local electromagnetic field enhancements are generated. In early work by Natan and coworkers, glass-coated analyte-tagged nanoparticles (GANs) with a Raman active Au or Ag core were used in surface-bound immunometric (sandwich) formats (Mulvaney et al., 2003). Lasers were used as the excitation light with scattered light being detected using a CCD. In more recent work, Lee and coworkers have demonstrated label-free determination of adenine on a polysilicon-coated glass wafer (Cho et al., 2009). Here, an electric field was applied between a top cylindrical wire electrode and a bottom plate Au-electrode including the SERS-active region, resulting in charged analyte molecules accumulating on the oppositely charged electrode in the detection region. Electrokinetic preconcentration resulted in a sensitivity improvement of eight orders of magnitude when read out on an integrated Raman system, suggesting SERS potential for demanding low-concentration diagnostic applications.
SPR allows direct label-free detection of immune complexes on a surface. For details, see Surface Plasmon Resonance in Binding Site, Kinetic and Concentration Analyses. Notably, the SPR-based Biacore™ system has found widespread use as a commercial immunoassay development platform (see Commercial Microfluidic Immunodiagnostics). Here, we only describe applications of SPR to microfluidics-based immunodiagnostic devices. In early work, SPR has been used in conjunction with a microfluidic unit in contact with a sensor surface to measure the kinetics of monoclonal antibody–antigen reactions in real time. The antibody or antigen was immobilized in a dextran matrix that was attached to the sensor surface and binding events monitored by SPR (Karlsson et al., 1991). Over the last 20 years, this highly sensitive and reliable method for low molecular weight analyte determination in complex analytical matrices has seen considerable improvements, particularly in terms of more robust sensing surfaces and more compact instrumentation (Shankaran et al., 2007, Shankaran and Miura, 2007). Lee and coworkers have demonstrated automatic PDMS microchips with micropumps and valves for immunoassay arrays with two-dimensional SPR phase imaging detection based on the Kretschmann configuration (Lee et al., 2007b). To account for the temperature sensitivity of SPR measurements, a temperature control module comprising micro-heaters and temperature sensors was also incorporated, resulting in a preliminary detection limit for IgG of 0.67nM. As an important step toward POC applications, Davis and coworkers have developed a fully self-contained hand-held SPR device powered by a 9V battery (Feltis et al., 2008). To demonstrate efficacy of the system, 200ng/mL ricin has been detected in a plastic cylindrical sensor cell via an immobilized anti-ricin antibody immunoassay within 10min Similarly Yager and coworkers have built a compact SPR imaging (SPRi) instrument based on a diode light source, image detector, integrated digital signal processor, and passive temperature control (Chinowsky et al., 2007). Proof of concept was demonstrated with a competition immunoassay for phenytoin.
While the above optical detection methods are very versatile and benefit from direct transferability of conventional clinical laboratory assay formats and associated optical label chemistry, the required hardware is often expensive, difficult to miniaturize, and optical readout performance can suffer at the microscale format. While novel approaches to integrated optical on-chip detection have overcome some of those limitations, as outlined above, there is still ample room for simpler miniaturizable detection technologies. Electrochemical detection provides a viable alternative, albeit at the expense of increased multi-analyte interference and remaining problems with electrode fouling and stability. While the following section reviews the current state of the art for electrochemical detection, more details are provided elsewhere (see Immunological Biosensors).
In early work, pH-sensitive light addressable potentiometric sensors were used to monitor the pH change that accompanied enzymatic action of bound urease-labeled conjugate in immunocomplexes captured on a membrane (Briggs and Panfili, 1991, Owicki et al., 1994). More recently, Bakker and coworkers have demonstrated potentiometric detection in nanoparticle-based sandwich immunoassays (Chumbimuni-Torres et al., 2006). Following the catalytic deposition of silver on gold nanoparticle labels on the detection antibody, silver dissolution is potentiometrically detected using an Ag+-selective electrode, yielding a detection limit of 12.5 pmol IgG in 50 µL of sample. On-chip amperometric detection of an alkaline phosphatase label has been accomplished following separation of free antibody and antibody–antigen complex in a post-column reaction of the enzyme label with a 4-aminophenyl phosphate substrate and downstream amperometric detection of the 4-aminophenol product (Wang et al., 2001). A detection limit of 1.7 amol was achieved in a model assay for mouse IgG conducted in 50μm-deep × 20μm-wide channels in a glass microchip. A bead-based microfluidic immunoassay for urinary hippuric acid determination in the range of 0–40 mg/mL has been demonstrated on a PDMS microchip with enzymatically amplified amperometric detection (Yoo et al., 2009). Whitesides and coworkers have demonstrated chronoamperometric analysis of glucose and square wave anodic stripping voltammetry measurements of heavy metal ions on microfluidic paper-based electrochemical devices (mPEDs) (Nie et al., 2010). The simple low-cost device comprising two printed carbon electrodes as the working and counter electrodes, and a printed Ag/AgCl electrode as the pseudo-reference electrode is inherently compatible with immunoassay-based analysis. A conductometric immunometric (sandwich) immunoassay for hepatitis B surface antigen (HBsAg) in serum has recently been demonstrated with nanogold labels on a microcomb-type electrode yielding a limit of detection of 0.01 ng/mL (Liu et al., 2009). As a variant of the above electrochemical methods, capacitive detection of microfluidic immunoassays on complementary metal oxide semiconductor (CMOS)-based sensors has also been reported (Ghafar-Zadeh et al., 2009).
FETs with amine and oxide-functionalized boron-doped silicon nanowires (SiNWs) between source and drain have been used by Lieber and coworkers to create highly sensitive real-time immunosensors (Cui et al., 2001). Proof of concept was demonstrated by monitoring anti-biotin binding to biotin-modified SiNWs, but detecting biomarkers in physiological fluid samples has so far proven difficult, due to NSB and biofouling. Fahmy and coworkers have recently overcome this problem by developing a microfluidic chip that captures multiple markers from blood samples, followed by post-wash release into purified buffer for sensing with a FET-based silicon nanoribbon detector (Stern et al., 2010). Efficacy was demonstrated with label-less sandwich immunoassay-based detection of two model cancer markers from whole blood within less than 20 min.
Electromechanical detection methods are based on binding induced changes to a sensing surface, which can be measured by electrical means. The QCM measurement principle is based on a surface binding-induced oscillation change of a quartz wafer sandwiched between two electrodes. While this method is inherently label-less, addition of, for instance, Au nanoparticles can enhance assay sensitivity. Tothill and coworkers have applied this approach to the determination of cancer markers in 75% human serum, with a detection limit of 0.29 ng/mL, for prostate-specific antigen (PSA) (Uludag and Tothill, 2010). The main drawback for POC immunodiagnostic applications is QCM’s sensitivity to matrix viscosity, which necessitates the use of on-chip controls. In the cantilever approach, the surface stress generated by antigen–antibody molecule recognition is measured (Hwang et al., 2009, Waggoner and Craighead, 2007). In early proof of concept work, the detection of CK and myoglobin has been demonstrated at <20 µg/mL (Arntz et al., 2003). Cho and coworkers have shown the detection of urinary PSA at picomolar concentration levels (Cho et al., 2005). More recently, Craighead’s group has pushed the sensitivity to 1–100fM for PSA in serum using a nanoparticle-based mass labeling immunometric assay (Waggoner et al., 2010). Silicon photonic micro-ring resonators have been applied to the detection of CRP in serum at 200fM level with a dynamic range of six orders of magnitude (Luchansky et al., 2011).
Immunodiagnostic Markers in Microfluidic Devices
Over the last 10 years or so a large variety of immunodiagnostic tests have been implemented on a microchip format, see Table 5 for overview. The spread of targeted analytes has equally increased, now covering almost all disease markers analyzed in clinical laboratories. Of particular interest, however, have been cardiac markers, infectious diseases, and cancer markers. Cardiac marker efforts have focused on tests for myoglobin, CK-MB, troponin I, CRP, and B-type natriuretic peptide (BNP) (Mohammed and Desmulliez, 2011). Infectious disease tests mainly cover CD4+ T-lymphocyte counting for HIV monitoring, dengue fever, influenza A, hepatitis C, malaria, and tuberculosis (Yager et al., 2006, Chin et al., 2011). Work on cancer markers, which are often present at low concentration, has so far included PSA, tumor necrosis factor α (TNF-α), liver cancer marker α-fetoprotein (AFP), and CEA. The rapid expansion of covered markers shows the dynamics of technological advancement and bodes well for the future of microfluidics-based immunodiagnostics. For existing microfluidics-based commercial systems, see Table 6 .
TABLE 5.
Selected Microfluidic Immunodiagnostics Markers
| Analyte | Reference |
|---|---|
| Myoglobin, CK-MB, TnI | (Ryu et al., 2011) |
| CRP | (Bhattacharyya and Klapperich, 2007, Ikami et al., 2010) |
| BNP | (Kurita et al., 2006) |
| CD4+ | (Cheng et al., 2007) |
| Dengue fever | (Lee et al., 2009b) |
| Influenza A | (Lien et al., 2011) |
| Hepatitis C | (Einav et al., 2008) |
| Malaria | (Lafleur et al., 2009, Castilho et al., 2011) |
| Tuberculosis | (Nagel et al., 2008) |
| PSA | (Goluch et al., 2006, Panini et al., 2008, Okada et al., 2011) |
| TNF-α | (Cesaro-Tadic et al., 2004) |
| AFP | (Kawabata et al., 2008) |
| CEA | (Zhang et al., 2009) |
TABLE 6.
Commercial Microfluidic Immunodiagnostics Systems
| Company | System | Analyte | Signal | US and EU Regulatory Clearance | Web |
|---|---|---|---|---|---|
| Abbott | i-Stat®. Cartridge/handheld reader | CK-MB, troponin I, BNP (single analyte cartridges only) | Electrochemical | 510(k) | www.abbott.com |
| Advanced Liquid Logic | Cartridge/handheld reader | Platform for digital microfluidics-based immunoassays | Fluorescence, chemiluminescence | No | www.liquid-logic.com |
| Alere/Biosite | TRIAGE® Cartridge/benchtop reader |
Troponin I, CK-MB, myoglobin, and BNP as various panels | Fluorescence | CLIA waived and CE marked |
www.alere.com www.biosite.com |
| Atlas Genetics | Velox™ Cartridge/reader |
DNA-based tests for bacterial and viral infections. Immunoassays in development. | Electrochemical | No | www.atlasgenetics.com |
| Ortho Clinical Diagnostics | 4castchip® Cartridge/reader |
PDGF, NT-proBNP in development | Fluorescence | No | www.orthoclinical.com |
| Bayer | A1C Now+® Single use disposable integrated analysis and reading system |
HbA1c | Fluorescence | CLIA waived | www.bayerdiabetes.com |
| Biacore (GE Healthcare) | Biacore™ X100 and T200 Cartridge/benchtop analyzer |
Platform for research assays | SPR | No | www.biacore.com |
| Claros Diagnostics | Cartridge/reader | PSA | Optical (Au label treated with Ag) | CE marked | www.clarosdx.com |
| mChip Cartridge/handheld reader | HIV, syphilis | No | |||
| Daktari Diagnostics | Daktari™ CD4 Counter Cartridge/reader |
CD4 cell count | Electrochemical | No | www.daktaridx.com |
| Epocal | epoc™ Smart Card Fluidics-on-Flex™ Card/reader |
Immunoassay panels in development | Electrochemical | No | www.epocal.com |
| Gyros AB | Gyrolab™ Bioaffy™ CD/reader |
Platform for research assays | Fluorescence | No | www.gyros.com |
| Micronics (Sony) | ABORhCard® Fully integrated |
ABO and Rh blood typing | Color change (qualitative, visual) | 510(k) | www.micronics.net |
| Active H™, Active T™, and Access™ cards | For research assays development | No | |||
| Molecular Vision | BioLED™ fully integrated disposable chips | Platform system for custom applications. In development | Fluorescence | No | www.molecularvision.co.uk |
| MycroLab | Various cartridge/reader and fully integrated card systems in development | For custom assay development | Electrochemical or optical | No | www.mycrolab.com |
| NanoEnTek | FREND™ Handheld reader/cartridge |
Myoglobin, CK-MB, troponin I, D-dimer, NT-proBNP,PSA | Fluorescence | No |
www.nanoentek.com www.digital-bio.com |
| Philips | Magnotech Handheld reader/cartridge |
Cardiac and oncology panels in development | Frustrated total internal reflection | No | www.philips.com/magnotech |
| Prolight | Handheld cartridge/reader | Myoglobin, CK-MB, troponin I, FABP, GBPP in development | Chemiluminescence | No | www.pldab.com |
| Vantix | Vantix™ POC handheld reader/cartridge systems in development | Platform systems for custom applications | Electrochemical | No | www.vantix.co.uk |
| MRSA and Clostridium difficile | No | ||||
| Vivacta | Benchtop reader/cartridge | Platform system for custom applications. TSH, demonstrated. Other tests in development |
Optically stimulated piezo film | No | www.vivacta.com |
| Wako Diagnostics | µTASWako® i30 Benchtop reader/cartridge |
AFP-L3, DCP | Fluorescence | 510(k) | www.wakodiagnostics.com |
Enabling Microfluidic Technologies for Immunodiagnostics
Providing immunodiagnostic tests at the POC can facilitate more efficient and effective provision of care (see Point-of-Care Testing). For the health care provider, this can enable decentralized testing and a more efficient use of resources while the patient benefits from a personalized medicine approach, on-the-spot diagnosis and earlier initiation of treatment, with associated benefits in disease management outcome. However, to become a viable and enabling diagnostic tool with widespread application, POC diagnostic tests need to be quantitative, measure a panel of analytes, be portable or handheld and sufficiently low cost to be disposable (Huckle, 2008).
To date, most over-the-counter (OTC) POC tests are still lateral flow based with a porous nitrocellulose matrix serving as the host for reagent deposition and fluid flow (see Lateral Flow Immunoassays). However, these lateral flow systems are limited to qualitative or semiquantitative analysis. On the other hand, there are sophisticated cartridge–reader-based systems that enable quantitative testing of analyte panels, such as Alere’s TRIAGE® cardiac marker panel (see Triage). These systems fully harvest the power of microfluidics in terms of being able to integrate a large number of parallel and serial analytical operations onto a small low-cost and disposable microfluidic cartridge, while sophisticated readout and data processing capabilities reside in the reusable reader.
However, to access more remote POC applications such as home testing, there is still a need to develop compact handheld diagnostic devices similar to lateral flow tests but with equivalent analytical capabilities to cartridge–reader systems or even full clinical laboratory analyzers. This section reviews the key microfluidic developments that are set to realize this ambitious goal. Some of the challenges include the provision of passive flow control, low-cost detection, and the integration of the above functionalities into immunodiagnostic test devices compatible with lay users and employment in low-resource settings such as in developing countries.
Flow Control
Traditionally, most laboratory-based microfluidic systems have relied on actuation for fluid control. Typically, positive pressure to the microchip inlet is used to induce filling of the microfluidic circuit, with high precision syringe pumps most commonly used. Variants include the use of integrated micropumps or the application of vacuum to the microchip outlet. Electroosmotic flow on charged glass or silicon surfaces can also be exploited but requires the use of high-voltage power supplies. The above microchip flow control approaches all require support instrumentation, thereby limiting POC employment capabilities. To overcome current limitations, extensive research has been directed toward alternative flow control means (West et al., 2008, Arora et al., 2010), including CD-based systems (Ducree et al., 2007), digital microfluidics (Jebrail and Wheeler, 2010), and passive capillarity-based systems (Eijkel and van den Berg, 2006), and their application to immunodiagnostic POC testing (Gervais et al., 2011b). In the following sections, these more recent flow control approaches will be introduced, and the current technical status reviewed, with particular emphasis on their suitability for POC immunodiagnostic testing.
As an interim step between laboratory-based microfluidic systems and compact handheld POC devices, centrifugal microfluidic platforms have been developed. Here, CD drives are used to control fluid flow in microfluidic disks through induced centrifugal, Euler and Coriolis forces. On the bio-disk platform, a number of fluidic unit operations have been combined with actuation, liquid interfacing, and detection capabilities, yielding a semi-portable platform that could potentially be reduced to a “$1 disk played on a $10 Discman” (Ducree et al., 2007). To date, this concept has been successfully applied to ELISA-based immunodiagnostics of cardiac markers in serum and whole blood (Riegger et al., 2006b) and been shown to be compatible with absorbance (Steigert et al., 2006), chemiluminescence (Riegger et al., 2006b), and fluorescence-based detection (Riegger et al., 2006a). Other groups have applied CD-based fluid control to multiplexed immunoassays (Honda et al., 2005, Morais et al., 2009) and ELISA-based determination of hepatitis B in whole blood (Lee et al., 2009a): see Fig. 2 .
FIGURE 2.
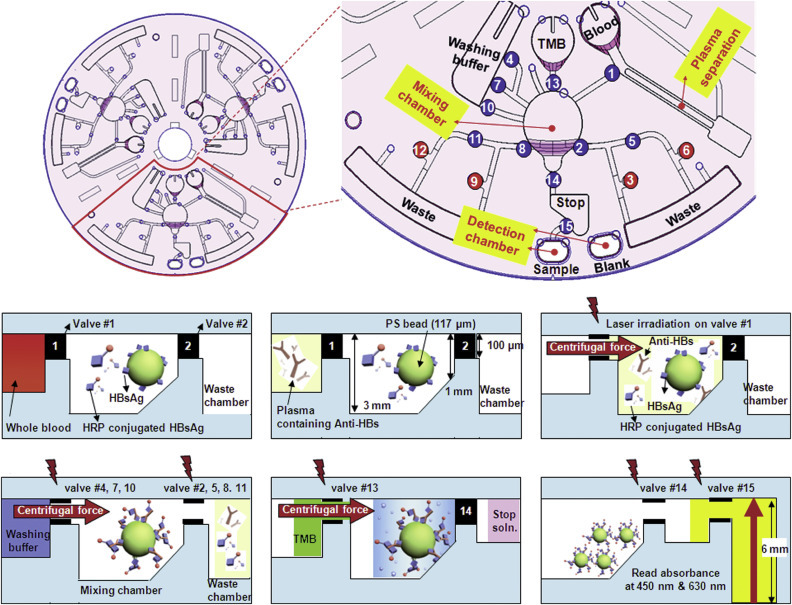
CD-based microfluidics for whole-blood-based ELISA.
(Lee et al., 2009a)—Reproduced by permission of the Royal Society of Chemistry. (The color version of this figure may be viewed at www.immunoassayhandbook.com).
The centrifugal approach results in compact semi-portable devices that offer robust liquid handling that unlike passive capillary fill systems are not constrained by viscosity and surface tension effects. However, current drawbacks include cost, reliability, and difficulties in achieving high-sensitivity readout.
In digital microfluidics, samples are manipulated as discrete droplets on insulator-covered electrode arrays (Abdelgawad and Wheeler, 2009, Jebrail and Wheeler, 2010). A series of electrical potentials are applied to the electrodes, resulting in charge accumulation on the surface and dynamically altered wettability. This can be exploited to dispense, move, merge, mix, and split droplets, which are often suspended in immiscible oil to prevent evaporation and cross-contamination, and to limit NSB to channel surfaces. Open one-plate configurations can be used with droplets manipulated on a single substrate housing both driving and ground electrodes. For POC immunodiagnostic applications, however, enclosed two-plate systems are most commonly employed to facilitate device handling and limit fluid evaporation. While compatibility of digital microfluidics with physiological fluids, including whole blood, was first demonstrated by Srinivasan in 2004 (Srinivasan et al., 2004), immunodiagnostic applications have only recently emerged. Pamula’s group has developed a droplet-based magnetic bead immunoassay for insulin and interleukin (Sista et al., 2008b), see Fig. 3 .
FIGURE 3.

Schematic of digital microfluidics-based magnetic bead immunoassay.
(Sista et al., 2008b)—Reproduced by permission of the Royal Society of Chemistry. (The color version of this figure may be viewed at www.immunoassayhandbook.com).
In this work, sample was digitally mixed with a drop of magnetic beads conjugated with capture antibody, detection antibody, and blocking proteins. The formed complex was then held by a magnet, washed and resuspended, followed by alkaline phosphatase-based chemiluminescence detection. The same digital microfluidics platform has been applied to the determination of troponin I in whole blood within 8min (Sista et al., 2008a). Owing to the advanced liquid handling capabilities of the system, a 40-cycle PCR could be performed on the same system, as has also been demonstrated independently by other groups (Chang et al., 2006).
The main advantages of digital microfluidics include the ability to use modular and scalable printed circuit boards instead of complex channel networks, compatibility with solids (as for instance required for whole-blood testing), and flexibility in terms of sample volume. Overall, this yields sophisticated liquid handling solutions in a portable and economical platform compatible with POC immunodiagnostics. However, digital microfluidics is still in its infancy and problems persist with NSB and fouling on the insulator electrode surfaces.
An autonomous passive microchip flow control system has been developed by Delamarche and coworkers at IBM (Zimmermann et al., 2007). It is based on silicon capillary systems (CSs) that fill predominantly by capillary force. The integrated microfluidic systems comprise a filling port, a microchannel, and a passive “capillary pump” outlet. The “capillary pump” outlet comprises branching channels to increase surface area and promote fluid evaporation, which assists capillarity-based filling. Interactive flow control is afforded by controlling evaporation rates through Peltier element-based cooling. Bio-functionalization for immunoassays is performed on a separate PDMS substrate attached to the CS. The group has already demonstrated the detection of cytokine TNFα with picomolar sensitivity in sub-microliter volumes (Cesaro-Tadic et al., 2004). Early work was based on serial manual pipetting of analyte and detection antibody into the inlet port. The group has subsequently focused on the implementation of an autonomous one-step immunodiagnostic format. With this process, the detection of 1ng/mL CRP in 5µL of serum has been demonstrated within 5min on a passive device comprising a sample collector, delay valves, flow resistors, reaction chambers, and CSs (Gervais and Delamarche, 2009, Zimmermann et al., 2009). A more versatile six-channel one-step immunoassay platform has recently been developed, which allows the adjustment and optimization of sample flow rate, sample volumes, and detection antibody concentration (Gervais et al., 2011c). As has been independently shown by other groups for pumped systems (Parsa et al., 2008), sample flow rate and the concentration and distribution of the detection antibody are critically important for achieving adequate sensitivity in on-chip immunoassays. For the passive CS platform, the reagent release has thus been optimized via controllable reagent integrators that enable programmable reagent pickup in one-step immunodiagnostic chips (Hitzbleck et al., 2011).
While the above passive one-step CS systems combine excellent performance and flexibility with simplicity of use at potentially low cost, they currently require a humidified chamber to ensure stable flow rates, which limit POC applicability.
Microfluidics for Low-Resource Settings
Currently, there is a concerted effort to extend immunodiagnostic capabilities to resource-poor settings in the developing world (Yager et al., 2006, Chin et al., 2011). This follows the ASSURED criteria for an ideal diagnostic test of Affordable, Sensitive, Specific, User-friendly, Robust, Equipment-free, Delivered to those in need, as stipulated by the World Health Organization. Microfluidics, with its enabling technologies described above, is expected to play an important role in fulfilling this promise.
Most of the above requirements for low-resource setting deployment of immunodiagnostic tests have been partially addressed by a recent research shift away from conventional lab-on-a-chip (LOC) approaches to lab-on-a-paper systems (Zhao and van den Berg, 2008). As outlined above, microchip-based microfluidics can offer a variety of sophisticated solutions to POC immunodiagnostics but not necessarily at low cost or without ancillary equipment. On the other hand, lateral flow-based devices are easy to use, low cost, and stand-alone but lack precise quantification capabilities. Lab-on-paper approaches are aimed at overcoming the performance limitations of lateral flow systems by patterning paper to form de facto microfluidic channels on this low-cost disposable medium.
SU-8-based patterning of plasma-treated paper was first shown by the Whitesides group in 2007. Proof of concept was demonstrated through the simultaneous color-change-based detection of glucose and protein in urine (Martinez et al., 2007). This photolithographic patterning approach has since been refined into a rapid prototyping method that is compatible with printed masks (Martinez et al., 2008c). Enhanced functionality was demonstrated through vertically stacked paper layers to enable sample distribution over arrays of reagent spots for multi-analyte assays (Martinez et al., 2008b) and a programmable 3D system to enable application-specific reconfiguration (Martinez et al., 2010a). While the above systems still require serial manual application of reagents, Yager’s group has developed a paper-based system for automated multi-reagent delivery based on dissolvable trehalose barriers (Fu et al., 2010). More importantly, in the context of this discussion, a 96-zone paper plate has recently been demonstrated for ELISA-based HIV detection in serum (Cheng et al., 2010). In this work, human anti-HIV-1 antibodies were captured by immobilized HIV-1 antigen, with a secondary goat anti-human IgG with alkaline phosphatase label introduced for colorimetric detection with a desktop scanner. In addition to this reflectance-based colorimetric detection, other techniques used have included absorbance and fluorescence-based (Carrilho et al., 2009), and electrochemical (Dungchai et al., 2009) detection, which have been implemented with paper-based systems (Martinez et al., 2010b). Interestingly, early efforts have already been made to integrate flexible electronics based arrays of LEDs, light detectors, and transistors with paper-based microfluidics, as driven by a US consortium comprising Diagnostics for All, University of Illinois at Urbana–Champaign and electronics start-up MC10.
Some of the above technological advances have been combined and complemented with additional add-ons to specifically address the use of microfluidic immunodiagnostics in resource-poor settings in the developing world. For instance, Linder and coworkers have developed a method to store a series of liquid reagent plugs in conventional polyethylene tubing, as needed for ELISA-based testing (Linder et al., 2005). To run the assay, the tubes were simply attached to the microchip inlet with a vacuum applied to the outlet, drawing in the reagent plugs one-by-one. Applying this approach to a PDMS microchip attached to a polystyrene substrate, HIV diagnosis in serum has been demonstrated within 13 min at nanomolar sensitivity with fluorescence microscope-based detection. While these reagents are stable during room temperature storage and transportation, efforts are underway to prove efficacy of this approach in field trials in the developing world (Chin et al., 2011). A dry reagent storage format for both the detection and capture antibody in a flow-through immunoassay system has been developed by Yager and coworkers for use in the developing world (Stevens et al., 2008). Dry reagent pads on polyester (detection antibody) and nitrocellulose (capture antibody) were prepared off-chip and inserted during assembly of the assay card comprising multiple layers of Mylar and PMMA. Using external syringe pumps to drive fluids, a robust malaria assay in serum has been demonstrated in 9 min with sub-nanomolar sensitivity on a flatbed scanner.
In clinical laboratories, whole blood is routinely centrifuged to yield plasma for downstream analysis. For microfluidic systems, a variety of different blood filtration approaches have been developed (see review Jiang et al., 2011). To address the specific needs of low-resource settings, the use of a manual eggbeater device for whole-blood separation has been explored (Wong et al., 2008). The whole-blood sample was loaded into polyethylene tubing and spun manually on the eggbeater to yield plasma, yielding approximately 40µL of plasma from 100 µL of whole blood after 5 min. The suitability of this low-tech sample pretreatment method has been demonstrated with a cholesterol assay on paper-based microfluidics and would, in principle, be equally applicable to immunoassays.
A whole-blood compatible self-powered integrated microfluidic blood analysis system (SIMBAS) has been demonstrated very recently (Dimov et al., 2011), see Fig. 4 .
FIGURE 4.

Schematic of stand-alone self-powered integrated microfluidic blood analysis system (SIMBAS).
(Dimov et al., 2011)–Reproduced by permission of the Royal Society of Chemistry. (The color version of this figure may be viewed at www.immunoassayhandbook.com).
Interestingly, this passive one-step system with sedimentation-based blood filtration does not require manual sample preparation or external equipment for fluid control. Instead it relies on degas-driven passive filling in evacuated PDMS chips (i.e., stored in desiccated vacuum pouches). Using only 5 µL of whole blood, a basic assay with labeled biotin binding to immobilized avidin has been demonstrated at low picomolar sensitivity with a fluorescence scanner-based readout. Making the important transition to a readout compatible with low-resource settings, Whitesides and coworkers explored a telemedicine approach based on the use of widely available camera phones (Martinez et al., 2008a). Here, camera phones were used to digitize the output of colorimetric on-chip assays and for transferring digital information for off-site analysis by trained medical professionals. While this approach is very suitable for remote settings, technical difficulties remain with varying image intensities dependent on the camera phone and ambient conditions. It is hoped that further progress on overcoming the above technical challenges will bring the full power of microfluidics-based immunodiagnostics to the POC, including resource-poor settings in the developing world.
Commercial Microfluidic Immunodiagnostics
Key success factors for POC devices and immunoassay-based diagnostic products in general are described elsewhere in this handbook. While lateral flow OTC pregnancy tests have been a commercial success, microfluidics-based immunodiagnostic products have been limited in their commercial application, see Table 6. The scarcity of microfluidics-based products is partially explained by the difficulty of achieving the required immunoassay performance in terms of accuracy and precision in this complex yet low-cost microchip format that would gain market and regulatory acceptance. In terms of regulatory pathway, microfluidics-based immunodiagnostics are governed by the same regulations as traditional immunoassay-based tests with the added consideration in the US, for POC applications, preferably to achieve Clinical Laboratory Improvement Amendment (CLIA) waived status demonstrating that the tests are “simple to perform by non-expert users” and have a low risk of error. The requirement for high levels of precision in robust configurations that have fail-safe user interfaces places great demands on the design and development processes for commercial systems. Several such systems are in development but regulatory clearance and market acceptance have thus far been slower than might have been expected.
One of the most successful commercial microfluidics-based diagnostic devices is Abbott’s handheld i-STAT® system that provides real-time laboratory quality results based on electrochemical detection on silicon chips. The most widely used test cartridge is CHEM8+, which provides eight metabolic tests including ionized calcium and hematocrit from a few drops of whole blood within 2min. 510(k) cleared cartridges for hematology, blood gases, coagulation, and immunoassay-based cardiac marker determination are also available, but only CHEM8+ is CLIA waived.
Bayer’s A1CNow+ ® is a handheld immunodiagnostic device for home-based testing of HbA1C, an important long-term marker in diabetes management. The CLIA-waived device comprises microfluidic and lateral flow components with onboard fluorescence-based detection. An established cartridge–reader system is the Alere TRIAGE® system that provides a cardiac marker panel for myoglobin, CK-MB, and troponin I (TnI) and separate tests for D-dimer and BNP. Again whole blood is loaded onto the passive cartridge and drawn into the channels by capillarity. Using a fluorescence-based readout, quantitative results are obtained within 15 min. This system also has a qualitative drug screen for urine samples (see Triage).
Biacore’s™ cartridge–reader systems X100 and T200 are based on label-free SPR. The 510(k) cleared systems are intended to be used as a development platform for customized assay implementation using disposable multichannel microfluidics with syringe pump-based actuation.
Micronics 510(k) cleared ABORhCard® provides simultaneous qualitative determination of an individual’s ABO blood group and Rh factor status. The single-use disposable credit card-sized device yields a visually read result within a few minutes from a fingerstick of whole blood. Interestingly, this passive microfluidics-driven technology has recently been acquired by Sony in their quest to diversify into the medical and health care domain.
Wako Diagnostics 510(k) cleared i30® Immunoanalyzer for liver cancer risk markers AFP-L3, and DCP is based on sophisticated microfluidics, electrophoretic techniques, and immunochemical detection. The cartridge–reader system can analyze up to six markers in parallel and yields first results in less than 10 min.
Alere has recently launched next generation CE-marked cardiac tests for the TRIAGE® platform. These include cartridges for single-analyte, improved sensitivity TnI, a two-analyte panel for new TnI and BNP (Cardio2), and a three-analyte panel for new TnI, BNP, and CK-MB (Cardio3). Through enhanced TnI sensitivity, these tests enable measurement down to the 99th percentile, allowing for earlier detection of AMI and improved outcomes in an A&E setting. Claros Diagnostics has recently CE marked their cartridge–reader-based PSA test. It is based on disposable credit card-sized passive microfluidics and a small footprint analyzer for high-sensitivity detection of Ag labels, yielding quantitative results within a few minutes from a fingerstick sample of whole blood, see Fig. 5 .
FIGURE 5.

Claros immunoassay cartridge for simultaneous testing of up to 10 disease markers from whole blood within 10 min. Currently used for PSA determination but also being tested for HIV and syphilis determination, see Chin et al. (2011). Separate portable reader is used for vacuum-based fluid actuation and optical readout.
(The color version of this figure may be viewed at www.immunoassayhandbook.com). Reproduced with permission from Claros Diagnostics.
Apart from the above diagnostic tests already in the market place, there exists a promising pipeline of development-stage immunodiagnostic devices. In particular, there is a trend away from conventional cartridge–reader configurations to fully integrated disposable systems that remove the need for a separate instrument and reduce user complexity. MycroLab’s Mycro®Check system is based on a disposable Mycro®Card comprising advanced microfluidics, electronics, and a display screen. Molecular Vision’s BioLED™ platform combines semiconductor-based light sources (OLEDs) and detectors (OPVs) with injection molded passive microfluidics to create potentially low-cost and fully disposable immunodiagnostic POC tests.
Microarrays, Immunoassay, and Proteomics
The use of bioanalytical microarrays was first reported by Feinberg (1961). Microliter samples of thyroglobulin antigen were spotted onto the surface of a thin film of agar that had been impregnated with serum from a patient with thyroid autoimmune disease. Immunoprecipitation was observed, indicative of interaction between the thyroglobulin and antibodies in the patient’s serum. The technique was refined using cellulose acetate strips (Feinberg and Wheeler, 1963), but it was decades later that further development of the concept by Ekins and coworkers (Ekins et al., 1990, Ekins and Chu, 1991, Ekins and Chu, 1993) led to the derivation of ambient analyte theory, and the demonstration of high-sensitivity multi-spot and multi-analyte immunoassays based on the principle that miniaturization leads to an increase in detection sensitivity. These were the first authentic antibody microarrays and showed the potential for miniaturized multiplexed immunoassays to have a major impact on clinical diagnostics. However, it was in the field of genomics where significant advances were first made in the technology of microarrays when high precision liquid handling robotics and optical scanners became available. Completion of the human genome sequencing has led to the development of DNA microarrays with high throughput, reliable processes for mRNA expression profiling, and single-nucleotide polymorphism analysis. In terms of biochemistry and diagnostic utility, it is recognized though that changes at the mRNA level are not necessarily proportional to changes at the protein level because of differences in rates of protein translation and degradation. Additionally, nucleotide tests reveal nothing regarding posttranslational modifications that may be essential to the protein’s function; one gene can encode a number of different proteins. Since it is the proteins not the mRNA that control cellular activity, it becomes important to identify the proteins themselves. With much of the technology derived from the earlier genomic microarrays in place, a major increase in effort has been applied in the field of protein microarrays over the last decade. The size of the task for proteomic researchers is considerable; the number of human proteins is judged to be an order of magnitude greater than the ~24,000 protein-coding genes, possibly as many as 106 proteins (www.ensembl.org). Microarrays, with the ability to detect hundreds or thousands of different proteins in a single experiment, provide the tools to address this problem and are being widely used for a variety of applications including drug development and classification, biomarker discovery, patient profiling, therapy monitoring, and diagnostic testing. Since it is the low-abundance proteins that often confer the most significant information, there is a clear need for highly sensitive, specific and accessible high-throughput test platforms for protein detection, quantitation, and differential profiling in health and disease.
Array Formats
The basic concept of the array is the use of immobilized capture molecules in a definable location (either through spatial position or optical identification) to bind specifically to a single analyte; the presence of different capture molecules allowing the simultaneous assay of multiple analytes in a complex mixture. Over the last decade, a variety of different formats have been devised and have been extensively reviewed in the scientific literature (Hall et al., 2007, Simpson, 2003, Pollard et al., 2007, Hartmann et al., 2009a, Hartmann et al., 2009b, Yu et al., 2010). Arrays are typically classified into two types: forward-phase protein microarrays (FPPMs, subdivided into analytical antibody arrays and functional protein arrays) and reverse-phase protein microarrays (RPPMs). See Fig. 6 .
FIGURE 6.
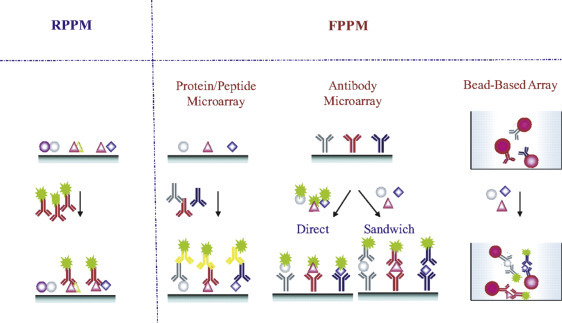
Protein microarray formats. Reverse-phase protein microarrays (RPPMs) can be used to measure distinct sets of parameters in a large collection of tissue or cell lysates or to sample fractions immobilized in an array on a solid support. Forward-phase protein microarray formats (FPPMs) are based on a direct-labeling or a sandwich immunoassay approach and are used for the simultaneous analysis of different parameters from different samples.
(The color version of this figure may be viewed at www.immunoassayhandbook.com). Reproduced with permission from Yu et al. (2010).
In one form, analytical antibody microarrays function as miniature versions of classic 2-site immunometric assays and use a library of antibodies arrayed onto, e.g., a glass microscope slide, which is then probed with a sample solution and the captured proteins subsequently detected using a second, labeled, antibody directed to a different determinant of the protein. Standard detection methods include fluorescence, chemiluminescence, and colorimetry. Such microarrays are typically used for profiling a complex mixture of proteins to measure binding affinities, specificities, and protein expression levels within a single sample. Antibody microarrays are the most common form of analytical microarray (Bertone and Snyder, 2005). While the technique is effective for well-characterized proteins for which good quality antibodies are available, this is often not the case. Avoiding the need for matched pairs of antibodies to each protein of interest, an alternative format simply labels all of the proteins in the sample with, e.g., a fluorescent tag, before incubating with the capture antibodies, an approach that has the advantage of allowing the direct comparison of two samples (e.g., Srivastava et al., 2006). One drawback of this method is that it is often difficult to label the low-abundance proteins with high efficiency, and it also suffers from reduced specificity through using a single antibody where cross-reactivity may be a problem.
Functional protein microarrays differ from analytical microarrays, being prepared from individual, full-length functional proteins or protein domains and used to investigate the wider protein-binding events of an entire proteome. Different forms of protein interaction can be studied including protein–protein, protein–DNA, protein–RNA, protein–phospholipid, and protein–small molecule (Zhu et al., 2001, Hu et al., 2011, Tao et al., 2007).
With reverse-phase (indirect) microarrays, it is the sample, containing its complex mixture of proteins, that is immobilized on the array and is probed with a specific labeled antibody. The technique was developed to overcome the problem of needing two high affinity, specific antibodies for each protein that was to be studied (Paweletz et al., 2001). A complex sample of proteins from tissue, cell lysates, or biological fluid is printed on slides, with each slide probed by a different antibody. Within each slide, there can be many different patient samples or serial dilutions of them. In this manner, the technique is highly suited to the screening of large cohorts of subjects in clinical investigations.
Array Manufacture
For nucleic acid arrays, the materials have a common chemistry so generic methods can be used for their immobilization regardless of the specific sequence. In the case of proteins, the nature of the surface of the slide and method of immobilization can have a profound effect on the protein conformation, functionality, and stability, hence, many different techniques have been tried in order to maximize binding capacity while maintaining conformation and functionality. With equipment developed for DNA arrays being adaptable to protein microarrays, the selection of microscope slides as supports followed from the ready availability of robotic printers and laser scanners. Using a glass microscope slide as a supporting substrate, many different surfaces have been used including polyvinylidene fluoride (Büssow et al., 1998, Luecking et al., 1999), nitrocellulose, polystyrene (Holt et al., 2000), agarose (Afanassiev et al., 2000), PDMS (Zhu et al., 2000), and aldehyde-activated plain glass (MacBeath and Schreiber, 2000). These methods and others such as using a coating of poly-l-lysine or covalent attachment to the glass surface through silanes or epoxy derivatives, all generate a random orientation of the protein on the slide surface, which, in some cases, can adversely affect the proteins. Affinity tags can avoid such problems, providing a stable linkage in a reproducible orientation. Examples include the use of 6xHis tags on a nickel surface (Zhu et al., 2003), N-terminal GST tags and maltose-binding protein.
Other, earlier, ways of forming protein arrays included adsorption onto a sSAM of n-octyldecyltrimethoxysilane on a silicon dioxide surface previously patterned by UV photolithography into an array of micrometer-sized features (Mooney et al., 1996), self-assembly via hybridization of RNA–protein fusions to an array of surface-bound DNA capture probes (Weng et al., 2002), spotting onto glass (Schweitzer et al., 2000), gold-coated silicon (Silzel et al., 1998), or plastic surfaces, e.g., polystyrene (Jones et al., 1998), electrospray deposition onto aluminized plastic (Avseenko et al., 2001), and immobilization within arrays of small (e.g., 100µm × 100µm × 20µm) polyacrylamide gel pads on a glass surface (Arenkov et al., 2000).
For the spotting of proteins or antibodies, two types of robotic microarray printers have been used: contact and noncontact. Contact printers use metal pins to deposit nanoliter quantities of protein or antibody solution by directly contacting the slide, with pin dimensions determining the volume applied. Spotting by solid pins requires replenishment of the fluid for each application; using alternative quill pins with an internal reservoir filled by capillary action allows multiple applications from a single filling and the deposited volume is dependent on the contact time. Noncontact printers release a discrete amount of fluid through conventional ink-jet, piezoelectric pulsing, or electrospray deposition. These latter printers give more precise fluid delivery and hence improve spot-to-spot variation although they normally require a larger sample volume and can sometimes misplace spots (Hartmann et al., 2009a, Hartmann et al., 2009b).
Many commercial organizations now supply prefabricated or custom arrays and automated equipment for printing arrays, performing tests, and optical measurement. Examples include Aushon Biosystems (www.aushon.com), Arrayit Corporation (www.arrayit.com), Affymetrix (www.affymetrix.com), Invitrogen Life Sciences (www.invitrogen.com), GeSim (www.gesim.de), Arrayjet (arrayjet.co.uk), RayBiotech (www.raybiotech.com), R&D Systems (www.rndsystems.com), and Gentel Biosciences (www.gentelbio.com). Additional sources can be found at www.biochipnet.com.
Self-assembling Protein Microarrays
One significant problem associated with protein or antibody microarrays concerns their stability: proteins in general and antibodies in particular have widely differing stabilities. Microarrays with hundreds or thousands of deposited proteins are highly vulnerable to the degradation of each protein on an individual and uncontrolled basis. In contrast, nucleic acid-based arrays are extremely stable. Taking advantage of this, He and Taussig, 2001, He and Taussig, 2003 generated a protein in situ array (PISA)—proteins were expressed directly from DNA and become attached to the array surface as they are made through recognition of a tag sequence or binding of histidine-tagged nascent proteins to the nickel-coated surface of a slide. Further improvements have been made by transcription and translation from an immobilized DNA template (rather than the solution used with PISA). The nucleic acid programmable protein array uses biotinylated cDNA plasmids encoding the proteins as GST fusions, printed onto an avidin-coated slide together with anti-GST antibody for protein capture (Ramachandran et al., 2004). The expressed proteins thus become immobilized in the same layout as the cDNA. In another advance devised by He and coworkers (He et al., 2008), protein expression is performed in a membrane held between two glass slides, one of which is arrayed with DNA and the other carries a reagent to capture the translated proteins. Tagged proteins are expressed in parallel and migrate to the second slide to be immobilized, forming the protein array as a mirror image of the DNA array. This approach has the advantages that the resulting array is free of the DNA itself and can be used repeatedly to generate copies of the array; at least 20 repeats have been reported.
Sources of Antibodies for Microarrays
The availability of a specific antibody for each human protein would in theory allow the profiling of the entire human proteome, and a number of initiatives in recent years have aimed to provide sets of characterized and harmonized binders, but the importance and scope of the work are beyond the capabilities of a single organization or even country. ProteomeBinders (Taussig et al., 2007; www.proteomebinders.org, Stoevesandt and Taussig, 2007), and its follow-up study AffinityProteome, integrate and coordinate the efforts of a number of European initiatives, including the Antibody Factory (Germany, www.antibody-factory.org) and within the Human Proteome Organization (www.hupo.org), the Antibody Resource database (www.antibodypedia.org) aims to produce a comprehensive catalog of validated antibodies to human proteins. Similarly, the US National Cancer Institute has set up the Clinical Proteomics Reagents Resource to develop monoclonal antibodies to cancer markers, particularly low abundance markers (www.proteomics.cancer.gov). While these programs are ambitious, they are technically feasible and offer significant scientific and economic rewards.
Detection Strategies
The detection methods employed with protein microarrays are analogous to those used in conventional immunoassays. In microarray-based enzyme immunoassays, enzyme-labeled conjugates are detected using colorimetric (Avseenko et al., 2001), fluorometric (Hiller et al., 2002), and chemiluminescent signal detection systems (Huang et al., 2001).
Fluorescent labels such as the Cy3 and Cy5 dyes are popular due to the common availability of reagents and microarray laser scanners that first found use with cDNA and oligonucleotide assays. In what has become a conventional technique for directly comparing samples, the use of these dyes is illustrated in a study by Srivastava et al. (2006) comparing the proteomic signatures of pooled normal and cystic fibrosis sera. See Fig. 7 .
FIGURE 7.

Antibody microarray analysis comparing pooled sera samples: pooled sera were reacted with Cy3 or Cy5, respectively, mixed together and applied to the microarray. The inversely labeled samples were applied to the other array. Proteins that are elevated in one source compared to the other either fluoresce green or red, while proteins with similar levels in both samples appear in yellow. The data from the two slides are averaged to calculate individual protein ratios or normalized to the array medians to calculate absolute levels of individual proteins. Note that red spots on one side correspond to green spots on the other as the dyes are interchanged between the samples.
(The color version of this figure may be viewed at www.immunoassayhandbook.com). Reproduced from Srivastava et al. (2006) with permission from Elsevier.
Semiconductor Q-dot labeling, which offers higher quantum yields, resistance to photobleaching and wide Stokes shift, has also been applied to protein microarrays and gave improved signal:noise ratios compared to conventional fluorescent labels (Zajac et al., 2007). Magnetic nanotags have also been proposed as alternatives to fluorescent labels for multiplexed protein arrays with claims of analytical sensitivity extending into the low femtomolar concentration (Osterfeld et al., 2008).
Increased sensitivity can be achieved in microarray immunoassay by using the Rolling Circle Amplification technique to amplify an oligonucleotide primer covalently linked to a detection antibody. When combined with fluorescent detection of the amplified oligonucleotide, it has proved possible to detect signals from individual antigen:antibody complexes on a microarray and achieve highly sensitive assays (e.g., detection of 0.1pg/mL PSA, and 1pg/mL IgE) (Schweitzer et al., 2000). When applied to the simultaneous measurement of 75 cytokines on glass arrays, 45 of the cytokines could be detected at a sensitivity of ≤10 pg/mL (Schweitzer et al., 2002). Another signal amplification technique that has been used in protein microarrays is tyramide signal amplification (also known as catalyzed reporter deposition technique), which uses an HRP label to catalyze the conversion of a fluorescent tyramide derivative to a reactive intermediate that binds to adjacent tyrosine residues on the probe (Varnum et al., 2004).
Regardless of the type of label, one disadvantage of label-dependent detection is the tendency for the label itself to modify the binding properties of the molecule to which it is attached. To overcome this weakness, a number of label-free detection techniques have been developed recently which have the added advantage of allowing the monitoring of the kinetics of protein microarray-binding reactions in real time. Examples of these techniques are summarized in Table 7 . Of these, SPR has received the most attention and is a mature technology. For the remainder, SPRi, carbon nanowires and nanotubes (CNTs), and interferometric and ellipsometric techniques have also attracted significant attention and offer both high sensitivity and a high level of multiplexing capability but are still presently at the research level.
TABLE 7.
Label-free Detection Methods for Protein Microarrays
| Technique and Principle | Example Applications |
|---|---|
| SPR. Measures changes in refractive index of the medium in contact with a metal surface, typically a thin film of gold on a glass slide. | High-throughput affinity ranking of antibodies from a phage display library (Wassaf et al., 2006). |
| SPRi. Allows the simultaneous monitoring of multiple biomolecular interactions. The entire chip surface is illuminated, and the reflected light is captured from each spot by a CCD camera, providing real-time kinetic data from each. | Monitoring of the binding of autoantibodies from sera of rheumatoid arthritis patients (Lokate et al., 2007). |
| Nanohole array. Surface plasmons on both sides of a metal surface resonantly couple through sub-wavelength holes. | Demonstrated the simultaneous monitoring of 25 binding reactions between GST and GST antibodies (Ji et al., 2008). |
| Ellipsometry. Measures changes in the polarization state of incident light, which depends on the dielectric properties and refractive index of the film. | A protein array in conjunction with a microfluidic system to screen for antibody–antigen interactions, measuring five markers of hepatitis B (Wang et al., 2006). |
| Oblique incidence reflectivity difference (OI-RD). A form of ellipsometry in which the harmonics of modulated photocurrents are measured; changes in thickness or dielectric response due to a protein binding yields a detectable signal. Suitable for conventional glass slides. | Application to end point and real-time investigations of DNA–DNA hybridization, antibody–antigen capture, and protein–small molecule-binding reactions (Zhu et al., 2007). |
| Spectral reflectance imaging biosensor. An optical interference technique whereby changes in optical index as a result of capture of biological material on the array surface are detected using optical wave interference. | Demonstrated with an array of 25 spots, each of four proteins binding to antibodies: BSA, HSA, rabbit IgG, and protein G (Özkumur et al., 2008). |
| Dual channel BioCD. Simultaneous detection of mass and fluorescence on a spinning disc format measuring interferometry and fluorescence. | Demonstrated an array of 6800 anti-rabbit IgG/anti-mouse IgG spots (Wang et al., 2008). |
| Arrayed imaging reflectometry. Depend on the destructive interference of polarized light reflected off a silicon substrate. Measures small localized changes in optical thickness of a thin film. | Detection of human proteins in cellular lysate and serum (Mace et al., 2008). |
| Scanning Kelvin nanoprobe. The Kelvin probe force microscope detects regional variations in surface potential across a substrate of interest, typically gold. Has advantage of being a noncontact technique capable of high-speed measurement of high-density arrays. | Demonstrated the formation of antigen–antibody pairs with high sensitivity and reproducibility (Sinensky and Belcher, 2007). |
| Atomic force microscopy (AFM). High-resolution scanning probe microscope detects vertical and horizontal deflections of a cantilever. | The most commonly used technique in the family of scanning probe microscopes. For example, the use of AFM for label-free protein and pathogen detection (Huff et al., 2004). |
| CNTs. Binding of target proteins to the functionalized surface leads to detectable changes in the electrical conductance of the device. | The use of single wall CNTs in a label-free immunosensor for the detection of PSA (Okuno et al., 2007). |
| Microcantilevers. Silicon-based gold-coated surfaces suspended horizontally from a solid support are deflected due to biomolecular interactions with detection either optically through measurement of the change in reflection angle or electrically using a metal oxide semiconductor FET. | Antigen–antibody-binding assays (Yue et al., 2008). |
Adapted from Ray et al. (2010). Copyright Wiley-VCH Verlag GmbH & Co. KGaA. Reproduced with permission.
Mass spectrometry (MS) techniques have also been applied to microarray immunoassays and, as part of biomarker discovery programs, technology platforms have been developed based on matrix-assisted laser-desorption/ionization time-of-flight (MALDI-TOF) MS (Gavin et al., 2005, Hortin, 2006, Evans-Nguyen et al., 2008) and surface-enhanced laser-desorption/ionization time-of-flight (SELDI-TOF) MS (Isaaq et al., 2002, Vorderwülbecke et al., 2005). In both methods, proteins to be analyzed are co-crystallized on an array with UV absorbing compounds and vaporized by a pulsed-UV laser beam. The ionized protein fragments are then accelerated in an electric field and identified from the velocities, which are characterized by different mass/charge ratios. The two techniques differ in construction of the sample targets and analyzer design. These methods provide protein patterns for each sample and have been used extensively in the search for new biomarkers. Qualification and verification of candidate biomarkers have proved more of a challenge though and a further MS technique has emerged that offers significant potential for accelerating this process. In multiple reaction monitoring-MS (MRM-MS) on a triple quadrupole mass spectrometer, parent peptide ions of target proteins selected by their mass/charge ratio are subjected to further collision-induced dissociation for monitoring of selected fragments. By using standards of synthetic, stable isotope-labeled versions of the signature proteotypic peptides in the sample (stable isotope dilution, SID-MRM-MS), it is possible to quantify the test and provide near-absolute structural specificity (Keshishian et al., 2007). A limitation of sensitivity of the method arising from sample complexity (serum) and the presence of high-abundance proteins can be overcome by incorporating immunocapture into the process: the SISCAPA ® (stable isotope standards with capture by anti-peptide antibodies) method (Anderson et al., 2004) is effectively a conventional immunometric (sandwich) immunoassay, replacing the labeled antibody with an MS technique achieving a low nanograms per milliliter limit of quantitation and CVs <20%.
Bead-Based Microarrays
In planar arrays, it is the spatial position within the array that provides the identification of the analyte. In bead-based microarrays, reagent coupled bead sets are used where each set can be identified through the color, size, shape, or other coding on each type of bead within the set. The reagent-specific micron-sized beads are pooled to provide multiplexing capability and incubated with samples using protocols analogous to those of conventional immunometric assays. Detection is through the use of fluorescent-labeled antibodies to each analyte or with fluorescent-labeled streptavidin and biotin-tagged antibodies. After washing, the bead suspension is processed through a form of flow cytometer that identifies the beads and measures fluorescence from the bound immunocomplex. These bead-based assays are robust and flexible and can easily be automated with the use of standard laboratory fluid-handling systems to give performance that is comparable with conventional ELISAs (Kellar and Iannone, 2002).
The most popular bead-based platform has been Luminex’s xMAP ® technology, which uses 100 different color-coded 5.6 micron diameter bead sets, and an instrument that measures fluorescence at two wavelengths to firstly identify from which bead set each individual bead is from and secondly to quantify the bound immunocomplex. The open architecture system allows researchers to set up their own multiplex assays or select from a wide range of commercially available kits from Luminex® or one of their partner organizations (www.luminexcorp.com). In additional updated systems, Luminex offers an expanded 500 different bead sets in their FLEXMAP 3D® system and a more compact MAGPIX® system based on color-coded magnetic microspheres with fluorescent image detection using LEDs and a CCD camera replacing the lasers and photomultipliers of the flow cytometry system. See Microsphere-Based Multiplex Immunoassays: Development and Applications Using Luminex xMAP Technology.
Other bead-based systems include the Cytometric Bead Array (CBA) from BD Biosciences (www.bdbiosciences.com) that uses 30 different spectrally identifiable bead sets, the FlowCytomix™ multiplexed immunoassay kits from eBioscience that have 20 bead sets distinguished by a combination of size and dye intensities (www.ebioscience.com), and Enzo Life Sciences similar MultiBead™ immunoassay kits (www.enzolifesciences.com).
In an alternative configuration, the BioArray Solutions BeadChip™ system from Immucor uses spectrally distinguishable bead types, but before running the test, the bead mixture is immobilized as a monolayer on a silicon chip and after removing unbound detection conjugate at the end of the assay, the array is read in a dedicated imaging system (www.immucor.com/bioarray/). Illumina’s BeadXpress™ and VeraCode™ technology uses cylindrical glass microbeads (240 µm length, 28 µm diameter), holograph coded, as the solid phase for their multiplexed system, with the beads being collected on a grooved plate for reading of the code to identify the bead type and the fluorescent intensity from bound immunocomplex (www.illumina.com). Although originally developed for DNA analysis, Illumina provides carboxyl-derivatized glass bead sets for users to develop their own immunoassays.
The relative merits of bead and planar microarrays have been debated within the research community with advocates of the planar variety claiming a greater level of multiplexing (up to tens of thousands of tests on a single array), ease of handling, low NSB, use of commonly available laboratory equipment, and the possibility of using different labels or label-free detection. While bead microarrays are more limited in their multiplexing possibilities, with practical limits in the region of 50 analytes within a test mix before test specificity becomes a problem, they have an advantage of the capability for independent quality control of each bead set and thus are more suited to the verification and validation requirements of tests used in clinical diagnosis following FDA clearance.
Applications
Since the operational versions of high-density protein or antibody microarrays were first brought to use (Macbeath and Schrieber, 2000, Zhu et al., 2001), they have become robust and stable platforms for protein expression profiling, biomarker identification, disease profiling, antibody characterization, and clinical diagnosis and have become essential tools in proteomics research.
Protein microarrays enable the parallel quantification of hundreds of proteins from small sample volumes, providing researchers with the ability to compare concentration patterns between patients with a particular disease and control patients. The majority of disease specific proteomic studies have been performed on samples from patients with cancer. Some examples of this very active area include studies on lung cancer (Gao et al., 2005) using an 84-antibody array to demonstrate discrimination between lung cancer patients and controls; breast cancer (Sebastiani et al., 2006) using 8 proteins on 149 carcinoma samples to evaluate survival correlations; breast cancer again (Sauer et al., 2008) using 54 proteins to identify a group of five that could be used to distinguish specific subgroups of patients; thyroid cancer (Linkov et al., 2008) where the plasma patterns of 19 cytokines, chemokines, and growth factors were used to identify five of these that could be used to discriminate between malignant and benign thyroid conditions; and bladder cancer (Sanchez-Carbayo et al., 2006) using an antibody array with 254 different antibodies to discriminate cancer patients from controls with a 94% classification rate. Many studies have been performed on patients with ovarian cancer, including studies on phospho-specific antibodies (Wulfkuhle et al., 2003); a 6-plex assay to screen patients with ovarian cancer that showed 95.3% sensitivity and 99.4% specificity within a population of 156 newly diagnosed ovarian cancer patients and 362 healthy subjects (Visintin et al., 2008), and a study by Hudson et al. (2007) using a 5005 protein microarray to identify autoantibody sets capable of recognizing 94 antigens in the sera of patients with ovarian cancer and selecting two antigens that in combination performed better than CA125 alone in identifying ovarian cancer. Prostate cancer has also received considerable attention with many microarray studies performed including the use of reverse-phase protein arrays for following disease progression (Paweletz et al., 2001); a microarray of 184 antibodies used to examine 33 prostate cancer sera and 20 controls, identifying five proteins with significantly different levels in the two cohorts (Miller et al., 2003) and a study by Shafer et al. (2006) that indicated that thrombospondin-1 could differentiate between benign and malignant disease—despite not correlating with PSA.
Other examples of clinical applications include a study on 400 serum samples from a severe acute respiratory syndrome outbreak using a coronavirus protein microarray with 82 proteins to demonstrate that protein microarrays can be used for large-scale identification of virus-specific antibodies in sera (Zhu et al., 2006), and work by Bozza et al. (2007), evaluating 17 cytokines as sepsis-specific biomarkers to identify those that correlated with organ dysfunction.
Many commercial microarray products are now available for research use including protein and antibody arrays for, e.g., cytokines, chemokines, tumor markers, and growth factors. Table 8 lists examples of commercial planar microarray systems that are available for research use.
TABLE 8.
Examples of Commercially Available Planar Microarray Systems for Research Use
| Company | Products |
|---|---|
| Arrayit | PlasmaScan antibody arrays, custom protein arrays, and reverse-phase arrays. OvaDx® ovarian cancer test for presymptomatic screening (PMA submission pending) |
| Aushon Biosystems | SearchLight multiplexed immunoassays for cytokines, chemokines, angiogenesis |
| Clontech Laboratories | Antibody 380 array for disease profiling and Microarray 500 for general profiling |
| Full Moon Biosytems | Antibody arrays for angiogenesis, apoptosis, oncology, cytokines, and related proteins and phosphorylation profiling |
| Gentel Biosciences | SilverQuant® Profiling antibody arrays for angiogenesis, apoptosis, inflammation, oncology markers, cytokines, and related proteins |
| Hypromatrix | Signal transduction and apoptosis antibody arrays, custom arrays |
| Invitrogen | ProtoArray® 9000 proteins for protein–protein interactions and autoantibody profiling |
| Meso Scale Discovery | MULTI-ARRAY® multiplexed immunoassay panels for cardiac markers, growth factors, oncology, diabetes, Alzheimer’s disease |
| Panomics (Affymetrix) | Cytokine and angiogenesis antibody arrays |
| Protein Biotechnologies | SomaPlex™ tissue lysate protein microarrays for oncology, cardiovascular, and diabetes |
| Quansys Biosciences | Q-Plex™ multiplexed immunoassays for cytokines, angiogenesis, chemokines |
| R&D Systems | Proteome Profiler antibody arrays for cytokines, phosphokinases, angiogenesis, kidney biomarkers |
| Randox | Evidence® Biochip multiplexed immunoassays for cytokines, fertility, oncology, thyroid |
| RayBiotech | RayBio® protein arrays, 234 proteins for protein–protein angiogenesis, and growth factor interactions and autoantibody profiling |
| Sigma Aldrich | Panorama® antibody microarray—Xpress Profiler 725. 725 antibodies for protein expression profiling. |
| Spring Biosciences | Antibody arrays for angiogenesis, apoptosis, oncology, cell cycle, signal transduction |
| Whatman | FAST Macro® cytokine antibody arrays |
Bead-based systems are dominated by the Luminex xMAP and MAGPIX systems. For research use, there is an extensive menu of tests available from Luminex or their partners (including Millipore, R&D Systems, Bio-Rad, Invitrogen, Innogenetics, Inverness Medical, Rules-based Medicine, Affymetrix, and Zeus Scientific) covering panels for autoimmune diseases, cardiac markers, inflammatory disease, apoptosis, cellular signaling, cytokines, chemokines and growth factors, endocrine, metabolic markers, and neurobiology. From other suppliers of bead-based systems there are commercially available research use products for adhesion molecules, cytokines, chemokines on BD Bioscience’s CBA system, cytokines, chemokines, adhesion molecules, cardiovascular markers and obesity markers on eBioSciences FlowCytomix system, and cytokines and custom designed panels on Enzo Life Sciences MultiBead™ system.
FDA-cleared or European CE-marked multiplexed arrayed products are more limited and thus far are restricted to panels of tests for analytes that already have clearance as individual tests. The Luminex multiplex systems lend themselves to applications for which clinical diagnosis requires the results from a relatively small number of tests and the list of currently available tests for clinical use reflects this, being dominated by tests for autoimmune and infectious diseases (Table 9 ).
TABLE 9.
FDA-Cleared Microarray Systems
| Company | Products |
|---|---|
| Alere/Zeus Scientific | AtheNA Multi-Lyte® multiplexed immunoassays based on Luminex xMAP technology: ANA, thyroid autoimmune, and infectious diseases |
| Bio-Rad Laboratories | Bio-Plex multiplexed immunoassays based on Luminex xMAP technology: ANA autoimmune panel, infectious diseases (EBV), syphilis |
| Biomedical Diagnostics (BMD) | Immunoassays based on Luminex xMAP system: celiac autoimmune panel, thyroid, vasculitis |
| Focus Diagnostics | Plexus™ Multiplexed serology tests for HSV 1 and 2, and EBV based on Luminex xMAP technology |
| Immucor (BioArray Solutions) | BeadChip™ ENA autoimmune panel |
| INOVA Diagnostics | QUANTAPlex® immunoassays based on Luminex xMAP system: autoimmune panels, ENA, SLE, ANCA, celiac |
| Randox | Evidence Biochip Array for drugs of abuse |
Outlook for Microarrays in Clinical Diagnostics
The capability for simultaneous analysis of hundreds or thousands of protein interactions offers major advances in biomarker discovery programs but despite the potential, the yield has been disappointing. The rate of introduction of new protein analytes into routine clinical use has averaged only 1.5 per year over the last 15 years (Anderson, 2010) with researchers offering explanations including a lack of effective technology platforms for verification in large sample sets, limited access to clinical samples, and an absence of a defined, coherent biomarker development pipeline (Rifai et al., 2006). An alternative view (Whiteley, 2008) suggests that the lack of new products available to the clinical laboratory is a reflection of industry risk avoidance, an academic focus on discovery and a lack of understanding by researchers of the high standards of robustness and reproducibility required to satisfy the regulatory agencies. This latter point has been accepted by the proteomics research community and in an effort to close the gap between candidate biomarker discovery and clinical utility, there have been several initiatives to try to remove the uncertainty among translational researchers as to the specific analytical measurement criteria needed to validate protein-based multiplexed assays. In this context, the US National Cancer Institute’s Clinical Proteomic Technologies for Cancer initiative (NCI-CPTC) (proteomics.cancer.gov) has proposed a preclinical verification stage in the biomarker pipeline, partnering with clinical laboratory organizations to develop common standards, and working closely with the FDA to educate the proteomics community with regard to evaluation requirements (Rodriguez et al., 2010, Boja and Rodriguez, 2011, Boja et al., 2011). As part of this process, members of the NCI-CPTC prepared two mock presubmissions of protein multiplexed assay descriptions to the Office of in vitro Diagnostic Device Evaluation and Safety, US FDA, for feedback (Regnier et al., 2010). The guidance given included the need to give adequate attention to an understanding of potential failure modes that affect robustness and reliability and to take care in the selection of appropriate intended use populations relative to the collection and testing of specimens during validation.
The availability of multiple test results from a single sample presents new challenges in terms of quality control, whether the results are reported individually or fed into an algorithm to produce a single result as a multivariate index assay (IVDMIA). An array may provide for the results from hundreds or thousands of analytes, but the conventional laboratory protocols for daily monitoring of high, mid, and low analyte level control performance becomes impractical, particularly for planar arrays (Master et al., 2006); the greater the degree of multiplexing the greater the problem. In the event of one (or more) analytes giving a response outside of the expected range, consideration has to be given as to how all the results of the other analytes should be handled. There are also issues to contend with regarding the release (or not) or unrequested results that have commercial, ethical, and legal implications—all of which need to be addressed before tests can be commercialized. The scale of these problems is much more limited with bead-based microarrays, particularly if multiplexing is limited to a relatively small number of analytes—hence, the current menus for FDA-cleared bead-based tests being dominated by panels of tests for autoimmune and infectious diseases. Larger scale multiplexing, such as utilized by the VeriPsych test from Rules Base Medicine measuring a panel of 51 protein markers to aid schizophrenia diagnosis, is presently limited to tests classified as Laboratory Developed Tests rather than the wider usage permitted with FDA clearance.
For new biomarker discovery, in which each of the proteomics technologies is likely to play a role, there is no single technology that can provide high levels of multiplexing, high sensitivity, and specificity with a level of robustness and reliability comparable with today’s clinical laboratory analyzers. In likelihood, a combination of immunoaffinity/mass spectrometric and antibody microarray techniques will provide the relevant tools within a structured biomarker development program.
In terms of clinical usage, there now exists the opportunity for multiplexed protein panels, with interpretation algorithms, to provide patient specific baselines such that the monitoring of a medical condition can be truly personalized rather than by comparison to a population-based reference interval. Such an approach may allow the detection of smaller changes in the pattern of proteins in a sample and thus an earlier indication of disease-related change. In considering the possibility of microarrays competing with existing laboratory analyzers, it should be noted that the existing systems can easily increase throughput by requesting further tests from a sample to be run in sequence. Diagnostic companies are unlikely to invest heavily in the development of new multiplexed systems until there are further benefits to be gained from multiplexing, such as that expected from IVDMIAs or where sample volume is very limited.
Conclusions
This chapter has illustrated the considerable research effort that has gone into addressing the objectives of miniaturization of immunoassay, and the success that has been achieved, particularly from the innovative analytical science that has been applied to the solution of a wide range of challenges. However, ultimately success and the true measure of innovation are judged by the level of adoption into the application sectors for which the technology was intended. Ultimate success depends on clear definition of the problem being addressed, as well as the capability of the end-user organization to adopt the solution. At the present time, adoption of the LOC concept has been greater in the research setting than in any other setting. While clinical diagnostics have been highlighted in the foregoing discussion, there may be other arenas where application of both LOC and POC testing offers potential benefits, e.g., in environmental, food, and material authenticity testing. Speed, simplicity, and mobility are all desirable attributes, while financial and environmental issues are equally applicable to all modalities of testing. There is no doubt that it is in these markets that the greatest volume of applications are to be found. However, we know from the experience of POC testing (see Point-of-Care Testing) that adoption has been slow, and furthermore, barriers to the adoption of new technologies in health care have been acknowledged. One of the key barriers is a poor understanding of the unmet need that might be addressed by the new technology. While it might be self-evident that an analytical device should address an unmet need, it is recognized in clinical diagnostics that there is significant over-requesting of tests, which is probably encouraged by the predominance of the fee-for-service business model.
Furthermore, there is a lesson to be learned from the evolution of central laboratory analytical technology, where the early approach to “scope” was through the development of the “multichannel analyzer.” It became evident after wide adoption of this technology that patients were being tested for analytes (or biomarkers) that were not necessarily relevant to their condition. This raised two issues. First, whether the patient (or the insurer) should have to pay for tests not required and second, a proportion of abnormal results were reported that were not relevant to the clinical condition being investigated. The consequence of this experience was the development of the discretionary analyzer, with a greater emphasis on “relevant” biomarkers or “groups of biomarkers.” Consequently, while scope is a major attribute of the LOC concept, it presents a greater challenge to formulating the right “group of biomarkers” and demonstrating clinical utility. The ethical issues surrounding the generation of results not requested, referred to in the earlier discussion also has to be considered, as well as the growing demand for evidence of clinical utility as part of the patient demand for an improved quality of health care service.
Thus, while the proof of principle for LOC diagnostics has been achieved, the routine application lags behind. There may be something else that can be learned from POC testing; while adoption is slow because of the failure to make a good business case and an inability of the customer organization to make the change in clinical practice associated with the introduction of a disruptive technology, several of the scenarios in which tests might be used involve more than one test. As a consequence, single analyte POC testing can begin to appear time consuming at the POC, when a small number of tests have to be performed sequentially on one patient. However, while the LOC solution might be the right answer, the challenge will lie in the choice of tests to be run in parallel, as many tests can appear in a number of clinically relevant menus; furthermore, these disease-related menus are not always limited to analytes measured using immunoassay principles.
This therefore raises two further issues. First, can LOC devices embrace more than one analytical technology? Second, will the real strength of the LOC device of choice lie in the flexibility of the manufacturing, and the ability to produce a portfolio of multi-analyte disposable devices, in which the portfolio is customer dependent?
There is no doubt that microscale analytical devices have huge potential for application in a wider range of settings. Furthermore, many of the customer needs, particularly in the range of analytes of interest, have been proven in a developmental setting. The translation, however, into the setting for which a miniaturized device is best suited—a mobile setting with immediacy of response, and requiring no technical expertise—remains a challenge in relation to demonstration of a robust device, and a test/analyte configuration that meets individual customer’s needs.
Footnotes
This edition.
Previous editions.
Contributor Information
Simon Rattle, Email: s.rattle@btinternet.com.
Oliver Hofmann, Email: oliver.hofmann@molecularvision.co.uk.
Christopher P. Price, Email: cpprice1@gmail.com.
References
- Abdelgawad M., Wheeler A.R. The digital revolution: a new paradigm for microfluidics. Adv. Mater. 2009;21:920–925. [Google Scholar]
- Afanassiev V., Hanemann V., Wölfl S. Preparation of DNA and protein microarrays on glass slides coated with an agarose film. Nucleic Acids Res. 2000;28:E66. doi: 10.1093/nar/28.12.e66. [DOI] [PMC free article] [PubMed] [Google Scholar]
- Anderson N.L. The clinical plasma proteome: a survey of clinical assays for proteins in plasma and serum. Clin. Chem. 2010;56:177–185. doi: 10.1373/clinchem.2009.126706. [DOI] [PubMed] [Google Scholar]
- Anderson N.L., Anderson N.G., Haines L.R., Hardie D.B., Olafson R.W., Pearson T.W. Mass spectrometric quantitation of peptides and proteins using stable isotope standards and capture by anti-peptide antibodies (SISCAPA) J. Proteome Res. 2004;3:235–244. doi: 10.1021/pr034086h. [DOI] [PubMed] [Google Scholar]
- Arenkov P., Kukhtin A., Gemmell A., Voloshchuk S., Chupeeva V., Mirzabekov A. Protein microchips: use for immunoassay and enzymatic reactions. Anal. Biochem. 2000;278:123–131. doi: 10.1006/abio.1999.4363. [DOI] [PubMed] [Google Scholar]
- Arntz Y., Seelig J.D., Lang H.P., Zhang J., Hunziker P., Ramseyer J.P., Meyer E., Hegner M., Gerber C. Label-free protein assay based on a nanomechanical cantilever array. Nanotechnology. 2003;14:86–90. [Google Scholar]
- Arora A., Simone G., Salieb-Beugelaar G.B., Kim J.T., Manz A. Latest developments in micro total analysis systems. Anal. Chem. 2010;82:4830–4847. doi: 10.1021/ac100969k. [DOI] [PubMed] [Google Scholar]
- Attia U.M., Marson S., Alcock J.R. Micro-injection moulding of polymer microfluidic devices. Microfluid. Nanofluidics. 2009;7:1–28. [Google Scholar]
- Avseenko N.V., Morozova T.Y., Ataullakhanov F.I., Morozov V.N. Immobilization of proteins in immunochemical microarrays fabricated by electrospray deposition. Anal. Chem. 2001;73:6047–6052. doi: 10.1021/ac010460q. [DOI] [PubMed] [Google Scholar]
- Azzazy H.M.E., Mansour M.M.H., Kazmierczak S.C. Nanodiagnostics: a new frontier for clinical laboratory medicine. Clin. Chem. 2006;52:1238–1246. doi: 10.1373/clinchem.2006.066654. [DOI] [PubMed] [Google Scholar]
- Becker H., Gaertner C. Polymer microfabrication technologies for microfluidic systems. Anal. Bioanal. Chem. 2008;390:89–111. doi: 10.1007/s00216-007-1692-2. [DOI] [PubMed] [Google Scholar]
- Becker H., Locascio L.E. Polymer microfluidic devices. Talanta. 2002;56:267–287. doi: 10.1016/s0039-9140(01)00594-x. [DOI] [PubMed] [Google Scholar]
- Bertone P., Snyder M. Advances in functional protein microarray technology. FEBS J. 2005;272:5400–5411. doi: 10.1111/j.1742-4658.2005.04970.x. [DOI] [PubMed] [Google Scholar]
- Bhattacharyya A., Klapperich C.M. Design and testing of a disposable microfluidic chemiluminescent immunoassay for disease biomarkers in human serum samples. Biomed. Microdevices. 2007;9:245–251. doi: 10.1007/s10544-006-9026-2. [DOI] [PubMed] [Google Scholar]
- Boja E.S., Rodriguez H. The path to clinical proteomics research: integration of proteomics, genomics, clinical laboratory and regulatory science. Korean J. Lab Med. 2011;31:61–71. doi: 10.3343/kjlm.2011.31.2.61. [DOI] [PMC free article] [PubMed] [Google Scholar]
- Boja E.S., Jortani S.A., Ritchie J., Hoofnagle A.N., Tezak Z., Mansfield E., Keller P., Rivers R.C., Rahbar A., Anderson N.L., Srinivas P., Rodriguez H. The journey to regulation of protein-based multiplex quantitative assays. Clin. Chem. 2011;57:560–567. doi: 10.1373/clinchem.2010.156034. [DOI] [PubMed] [Google Scholar]
- Bozza F.A., Salluh J.I., Japiassu A.M., Soares M., Assis E.F., Gomes R.N. Cytokine profiles as markers of disease severity in sepsis: a multiplex analysis. Crit. Care. 2007;11:R49. doi: 10.1186/cc5783. [DOI] [PMC free article] [PubMed] [Google Scholar]
- Breadmore M.C. Recent advances in enhancing the sensitivity of electrophoresis and electrochromatography in capillaries and microchips. Electrophoresis. 2007;28:254–281. doi: 10.1002/elps.200600463. [DOI] [PubMed] [Google Scholar]
- Briggs J., Panfili P.R. Quantitation of DNA and protein impurities in biopharmaceuticals. Anal. Chem. 1991;63:850–859. doi: 10.1021/ac00009a003. [DOI] [PubMed] [Google Scholar]
- Büssow K., Cahill D., Nietfeld W., Bancroft D., Scherzinger E., Lehrach H., Walter G. A method for global protein expression and antibody screening on high density filters of an arrayed cDNA library. Nucleic Acids Res. 1998;26:5007–5008. doi: 10.1093/nar/26.21.5007. [DOI] [PMC free article] [PubMed] [Google Scholar]
- Carrilho E., Phillips S.T., Vella S.J., Martinez A.W., Whitesides G.M. Paper microzone plates. Anal. Chem. 2009;81:5990–5998. doi: 10.1021/ac900847g. [DOI] [PubMed] [Google Scholar]
- Castilho M.D.S., Laube T., Yamanaka H., Alegret S., Pividori M.I. Magneto immunoassays for Plasmodium falciparum histidine-rich protein 2 related to malaria based on magnetic nanoparticles. Anal. Chem. 2011;83:5570–5577. doi: 10.1021/ac200573s. [DOI] [PubMed] [Google Scholar]
- Cesaro-Tadic S., Dernick G., Juncker D., Buurman G., Kropshofer H., Michel B., Fattinger C., Delamarche E. High-sensitivity miniaturized immunoassays for tumor necrosis factor a using microfluidic systems. Lab Chip. 2004;4:563–569. doi: 10.1039/b408964b. [DOI] [PubMed] [Google Scholar]
- Chang Y.-H., Lee G.-B., Huang F.-C., Chen Y.-Y., Lin J.-L. Integrated polymerase chain reaction chips utilizing digital microfluidics. Biomed. Microdev. 2006;8:215–225. doi: 10.1007/s10544-006-8171-y. [DOI] [PubMed] [Google Scholar]
- Chen H., Abolmatty A., Faghri M. Microfluidic inverse phase ELISA via manipulation of magnetic beads. Microfluid. Nanofluidics. 2011;10:593–605. [Google Scholar]
- Cheng C.-M., Martinez A.W., Gong J., Mace C.R., Phillips S.T., Carrilho E., Mirica K.A., Whitesides G.M. Paper-based ELISA. Angew. Chem. Int. Ed. 2010;49:4771–4774. doi: 10.1002/anie.201001005. [DOI] [PubMed] [Google Scholar]
- Cheng S.B., Skinner C.D., Taylor J., Attiya S., Lee W.E., Picelli G., Harrison D.J. Development of a multichannel microfluidic analysis system employing affinity capillary electrophoresis for immunoassay. Anal. Chem. 2001;73:1472–1479. doi: 10.1021/ac0007938. [DOI] [PubMed] [Google Scholar]
- Cheng X., Irimia D., Dixon M., Sekine K., Demirci U., Zamir L., Tompkins R.G., Rodriguez W., Toner M. A microfluidic device for practical label-free CD4+T cell counting of HIV-infected subjects. Lab Chip. 2007;7:170–178. doi: 10.1039/b612966h. [DOI] [PMC free article] [PubMed] [Google Scholar]
- Chiem N.H., Harrison D.J. Microchip-based capillary electrophoresis for immunoassays: analysis of monoclonal antibodies and theophylline. Anal. Chem. 1997;69:373–378. doi: 10.1021/ac9606620. [DOI] [PubMed] [Google Scholar]
- Chin C.D., Laksanasopin T. Microfluidics-based diagnostics of infectious diseases in the developing world. Nat. Med. 2011;17:1015–1019. doi: 10.1038/nm.2408. [DOI] [PubMed] [Google Scholar]
- Chinowsky T.M., Grow M.S., Johnston K.S., Nelson K., Edwards T., Fu E., Yager P. Compact, high performance surface plasmon resonance imaging system. Biosens. Bioelectron. 2007;22:2208–2215. doi: 10.1016/j.bios.2006.10.030. [DOI] [PMC free article] [PubMed] [Google Scholar]
- Cho H., Kang J., Kwak S., Hwang K., Min J., Lee J., Yoon D., Kim T. MEMS 2005 Miami. Technical Digest; 2005. Integration of PDMS microfluidic channel with silicon-based electromechanical cantilever sensor on a CD chip; pp. 698–701. [Google Scholar]
- Cho H., Lee B., Liu G.L., Agarwal A., Lee L.P. Label-free and highly sensitive biomolecular detection using SERS and electrokinetic preconcentration. Lab Chip. 2009;9:3360–3363. doi: 10.1039/b912076a. [DOI] [PubMed] [Google Scholar]
- Choi J.W., Oh K.W., Thomas J.H., Heineman W.R., Halsall H.B., Nevin J.H., Helmicki A.J., Henderson H.T., Ahn C.H. An integrated microfluidic biochemical detection system for protein analysis with magnetic bead-based sampling capabilities. Lab Chip. 2002;2:27–30. doi: 10.1039/b107540n. [DOI] [PubMed] [Google Scholar]
- Chumbimuni-Torres K.Y., Dai Z., Rubinova N., Xiang Y., Pretsch E., Wang J., Bakker E. Potentiometric biosensing of proteins with ultrasensitive ion-selective microelectrodes and nanoparticle labels. J. Am. Chem. Soc. 2006;128:13676–13677. doi: 10.1021/ja065899k. [DOI] [PMC free article] [PubMed] [Google Scholar]
- Cui Y., Wei Q.Q., Park H.K., Lieber C.M. Nanowire nanosensors for highly sensitive and selective detection of biological and chemical species. Science. 2001;293:1289–1292. doi: 10.1126/science.1062711. [DOI] [PubMed] [Google Scholar]
- Delamarche E., Juncker D., Schmid H. Microfluidics for processing surfaces and miniaturizing biological assays. Adv. Mater. 2005;17:2911–2933. [Google Scholar]
- Dimov I.K., Basabe-Desmonts L., Garcia-Cordero J.L., Ross B.M., Ricco A.J., Lee L.P. Stand-alone self-powered integrated microfluidic blood analysis system (SIMBAS) Lab Chip. 2011;11:845–850. doi: 10.1039/c0lc00403k. [DOI] [PubMed] [Google Scholar]
- Dishinger J.F., Kennedy R.T. Serial immunoassays in parallel on a microfluidic chip for monitoring hormone secretion from living cells. Anal. Chem. 2007;79:947–954. doi: 10.1021/ac061425s. [DOI] [PubMed] [Google Scholar]
- Do J., Ahn C.H. A polymer lab-on-a-chip for magnetic immunoassay with on-chip sampling and detection capabilities. Lab Chip. 2008;8:542–549. doi: 10.1039/b715569g. [DOI] [PubMed] [Google Scholar]
- Ducree J., Haeberle S., Lutz S., Pausch S., Von Stetten F., Zengerle R. The centrifugal microfluidic bio-disk platform. J. Micromech. Microeng. 2007;17:S103–S115. [Google Scholar]
- Dungchai W., Chailapakul O., Henry C.S. Electrochemical detection for paper-based microfluidics. Anal. Chem. 2009;81:5821–5826. doi: 10.1021/ac9007573. [DOI] [PubMed] [Google Scholar]
- Eijkel J.C.T. Scaling revisited. Lab Chip. 2007;7:1630–1632. doi: 10.1039/b716545p. [DOI] [PubMed] [Google Scholar]
- Eijkel J.C.T., Van den Berg A. Nanofluidics: what is it and what can we expect from it? Microfluid. Nanofluidics. 2005;1:249–267. [Google Scholar]
- Eijkel J.C.T., Van den Berg A. Young 4ever – the use of capillarity for passive flow handling in lab on a chip devices. Lab Chip. 2006;6:1405–1408. doi: 10.1039/b613839j. [DOI] [PubMed] [Google Scholar]
- Einav S., Gerber D., Bryson P.D., Sklan E.H., Elazar M., Maerkl S.J., Glenn J.S., Quake S.R. Discovery of a hepatitis C target and its pharmacological inhibitors by microfluidic affinity analysis. Nat. Biotechnol. 2008;26:1019–1027. doi: 10.1038/nbt.1490. [DOI] [PMC free article] [PubMed] [Google Scholar]
- Ekins R.P., Chu F.W. Multianalyte microspot immunoassay microanalytical ‘compact disk’ of the future. Clin. Chem. 1991;37:1955–1967. [PubMed] [Google Scholar]
- Ekins R.P., Chu F.W. Multianalyte testing. Clin. Chem. 1993;39:369–370. [PubMed] [Google Scholar]
- Ekins R.P., Chu F., Biggart E. Multispot, multianalyte, immunoassay. Ann. Biol. Clin. 1990;48:655–666. [PubMed] [Google Scholar]
- Evans-Nguyen K.M., Tao S.-C., Zhu H., Cotter R.J. Protein arrays on patterned porous gold substrates interrogated with mass spectrometry: detection of peptides in plasma. Anal. Chem. 2008;80:1448–1458. doi: 10.1021/ac701800h. [DOI] [PubMed] [Google Scholar]
- Feinberg J.G. A ‘microspot’ test for antigens and antibodies. Nature. 1961;192:985–986. doi: 10.1038/192985a0. [DOI] [PubMed] [Google Scholar]
- Feinberg J.G., Wheeler A.W. Detection of auto-immune antibody and tissue antigens by the ‘microspot’ technique. J. Clin. Pathol. 1963;16:282–284. doi: 10.1136/jcp.16.3.282. [DOI] [PMC free article] [PubMed] [Google Scholar]
- Feldman H.C., Sigurdson M., Meinhart C.D. AC electrothermal enhancement of heterogeneous assays in microfluidics. Lab Chip. 2007;7:1553–1559. doi: 10.1039/b706745c. [DOI] [PubMed] [Google Scholar]
- Feltis B.N., Sexton B.A., Glenn F.L., Best M.J., Wilkins M., Davis T.J. A hand-held surface plasmon resonance biosensor for the detection of ricin and other biological agents. Biosens. Bioelectron. 2008;23:1131–1136. doi: 10.1016/j.bios.2007.11.005. [DOI] [PubMed] [Google Scholar]
- Foley J., Schmid H., Stutz R., Delamarche E. Microcontact printing of proteins inside microstructures. Langmuir. 2005;21:11296–11303. doi: 10.1021/la0518142. [DOI] [PubMed] [Google Scholar]
- Fu E., Lutz B., Kauffman P., Yager P. Controlled reagent transport in disposable 2D paper networks. Lab Chip. 2010;10:918–920. doi: 10.1039/b919614e. [DOI] [PMC free article] [PubMed] [Google Scholar]
- Gad-El-Hak M. CRC Press; 2006. MEMS Introduction and Fundamentals. [Google Scholar]
- Gao W.M., Kuick R., Orchekowski R.P., Misek D.E. Distinctive serum protein profiles involving abundant proteins in lung cancer patients based upon antibody microarray analysis. BMC Cancer. 2005;5:110. doi: 10.1186/1471-2407-5-110. [DOI] [PMC free article] [PubMed] [Google Scholar]
- Gavin I.M., Kukhtin A., Glesne D., Schabacker D., Chandler D.P. Analysis of protein interaction and function with a 3-dimensional MALDI-MS protein array. Biotechniques. 2005;39:99–107. doi: 10.2144/05391RR02. [DOI] [PubMed] [Google Scholar]
- Gervais L., Delamarche E. Toward one-step point-of-care immunodiagnostics using capillary-driven microfluidics and PDMS substrates. Lab Chip. 2009;9:3330–3337. doi: 10.1039/b906523g. [DOI] [PubMed] [Google Scholar]
- Gervais L., de Rooij N., Delamarche E. Microfluidic chips for point-of-care immunodiagnostics. Adv. Mater. 2011;23:H151–H176. doi: 10.1002/adma.201100464. [DOI] [PubMed] [Google Scholar]
- Gervais L., de Rooij N., Delamarche E. Microfluidic diagnostic devices: microfluidic chips for point-of-care immunodiagnostics. Adv. Mater. 2011;23:H208. doi: 10.1002/adma.201100464. [DOI] [PubMed] [Google Scholar]
- Gervais L., Hitzbleck M., Delamarche E. Capillary-driven multiparametric microfluidic chips for one-step immunoassays. Biosens. Bioelectron. 2011;27:64–70. doi: 10.1016/j.bios.2011.06.016. [DOI] [PubMed] [Google Scholar]
- Ghafar-Zadeh E., Sawan M., Therriault D. CMOS based capacitive sensor laboratory-on-chip: a multidisciplinary approach. Analog Integr. Circ. S. 2009;59:1–12. [Google Scholar]
- Goluch E.D., Nam J.-M., Georganopoulou D.G., Chiesl T.N., Shaikh K.A., Ryu K.S., Barron A.E., Mirkin C.A., Liu C. A bio-barcode assay for on-chip attomolar-sensitivity protein detection. Lab Chip. 2006;6:1293–1299. doi: 10.1039/b606294f. [DOI] [PubMed] [Google Scholar]
- Hall D.A., Ptacek J., Snyder M. Protein microassay technology. Mech. Ageing Dev. 2007;128:161–167. doi: 10.1016/j.mad.2006.11.021. [DOI] [PMC free article] [PubMed] [Google Scholar]
- Harrison D.J., Fluri K., Seiler K., Fan Z.H., Effenhauser C.S., Manz A. Micromachining a miniaturized capillary electrophoresis-based chemical analysis system on a chip. Science. 1993;261:895–897. doi: 10.1126/science.261.5123.895. [DOI] [PubMed] [Google Scholar]
- Harrison D.J., Manz A., Fan Z.H., Ludi H., Widmer H.M. Capillary electrophoresis and sample injection systems integrated on a planar glass chip. Anal. Chem. 1992;64:1926–1932. [Google Scholar]
- Hart R., Lec R., Noh H.M. Enhancement of heterogeneous immunoassays using AC electroosmosis. Sensor. Actuat. B Chem. 2010;147:366–375. [Google Scholar]
- Hartmann M., Roeraade J., Stoll D., Templin M.F., Joos T.O. Protein microarrays for diagnostic assays. Anal. Bioanal. Chem. 2009;393:1407–1416. doi: 10.1007/s00216-008-2379-z. [DOI] [PubMed] [Google Scholar]
- Hartmann M., Sjödahl J., Stjernström M., Redeby J., Joos T.O., Roeraade J. Non-contact protein microarray fabrication using a procedure based on liquid bridge formation. Anal. Bioanal. Chem. 2009;393:591–598. doi: 10.1007/s00216-008-2509-7. [DOI] [PubMed] [Google Scholar]
- Hatch A., Kamholz A.E., Hawkins K.R. A rapid diffusion immunoassay in a T-sensor. Nat. Biotechnol. 2001;19:461–465. doi: 10.1038/88135. [DOI] [PubMed] [Google Scholar]
- Hayes M.A., Polson N.A., Phaye A.N., Garcia A.A. Flow-based microimmunoassay. Anal. Chem. 2001;73:5896–5902. doi: 10.1021/ac0104680. [DOI] [PubMed] [Google Scholar]
- He M., Taussig M.J. DiscernArray technology: a cell-free method for generation of protein arrays from PCR DNA. J. Immunol. Methods. 2003;274:265–270. doi: 10.1016/s0022-1759(02)00521-5. [DOI] [PubMed] [Google Scholar]
- He M., Taussig M.J. Single step generation of protein arrays from DNA by cell-free expression and in situ immobilisation (PISA method) Nucleic Acids Res. 2001;29:E73. doi: 10.1093/nar/29.15.e73. [DOI] [PMC free article] [PubMed] [Google Scholar]
- He M., Stoevesandt O., Palmer E.A., Khan F., Ericsson O., Taussig M.J. Printing protein arrays from DNA arrays. Nat. Methods. 2008;5:175–177. doi: 10.1038/nmeth.1178. [DOI] [PubMed] [Google Scholar]
- Herr A.E., Hatch A.V., Giannobile W.V., Throckmorton D.J., Tran H.M., Brennan J.S., Singh A.K. Integrated microfluidic platform for oral diagnostics. In: Malamud D.N.R.S., editor. Oral-based Diagnostics. 2007. [DOI] [PMC free article] [PubMed] [Google Scholar]
- Hiller R., Laffer S., Harwanegg C. Microarrayed allergen molecules: diagnostic gatekeepers for allergy treatment. FASEB J. 2002;16:414–416. doi: 10.1096/fj.01-0711fje. [DOI] [PubMed] [Google Scholar]
- Hitzbleck M., Gervais L., Delamarche E. Controlled release of reagents in capillary-driven microfluidics using reagent integrators. Lab Chip. 2011;11:2680–2685. doi: 10.1039/c1lc20282k. [DOI] [PubMed] [Google Scholar]
- Hofmann O., Vorin G., Niedermann P., Manz A. Three-dimensional microfluidic confinement for efficient sample delivery to biosensor surfaces. Application to immunoassays on planar optical waveguides. Anal. Chem. 2002;74:5243–5250. doi: 10.1021/ac025777k. [DOI] [PubMed] [Google Scholar]
- Holt I.J., Bussow K., Walter G., Tomlinson I.M. Bypassing selection: direct screening for antibody-antigen interactions using protein arrays. Nucleic Acids Res. 2000;28:E72. doi: 10.1093/nar/28.15.e72. [DOI] [PMC free article] [PubMed] [Google Scholar]
- Honda N., Lindberg U., Andersson P., Hoffman S., Takei H. Simultaneous multiple immunoassays in a compact disc-shaped microfluidic device based on centrifugal force. Clin. Chem. 2005;51:1955–1961. doi: 10.1373/clinchem.2005.053348. [DOI] [PubMed] [Google Scholar]
- Hortin G.L. The MALDI-TOF mass spectrometric view of the plasma proteome and peptidome. Clin. Chem. 2006;52:1223–1237. doi: 10.1373/clinchem.2006.069252. [DOI] [PubMed] [Google Scholar]
- Hou C., Herr A.E. Clinically relevant advances in on-chip affinity-based electrophoresis and electrochromatography. Electrophoresis. 2008;29:3306–3319. doi: 10.1002/elps.200800244. [DOI] [PubMed] [Google Scholar]
- Hu S., Zhi X., Qian J., Blackshaw S., Zhu H. Functional protein microarray technology. Syst. Biol. Med. 2011;3:255–268. doi: 10.1002/wsbm.118. [DOI] [PMC free article] [PubMed] [Google Scholar]
- Huang R.P., Huang R., Fan Y., Lin Y. Simultaneous detection of multiple cytokines from conditioned media and patient’s sera by an antibody-based protein array system. Anal. Biochem. 2001;294:55–62. doi: 10.1006/abio.2001.5156. [DOI] [PubMed] [Google Scholar]
- Huckle D. Point-of-care diagnostics: an advancing sector with nontechnical issues. Expert Rev. Mol. Diagn. 2008;8:679–688. doi: 10.1586/14737159.8.6.679. [DOI] [PubMed] [Google Scholar]
- Hudson M.E., Pozdnyakova I., Haines K., Mor G., Snyder M. Identification of differentially expressed proteins in ovarian cancer using high-density protein microarrays. Proc. Natl. Acad. Sci. USA. 2007;104:17494–17499. doi: 10.1073/pnas.0708572104. [DOI] [PMC free article] [PubMed] [Google Scholar]
- Huff J.L., Lynch M.P., Nettikadan S., Johnston J.C. Label-free protein and pathogen detection using the atomic force microscope. J. Biomol. Screen. 2004;9:491–497. doi: 10.1177/1087057104268803. [DOI] [PubMed] [Google Scholar]
- Hwang K.S., Lee S.-M., Kim S.K., Lee J.H., Kim T.S. Micro- and nanocantilever devices and systems for biomolecule detection. Annu. Rev. Anal. Chem. 2009 doi: 10.1146/annurev-anchem-060908-155232. [DOI] [PubMed] [Google Scholar]
- Ihara M., Yoshikawa A., Wu Y., Takahashi H., Mawatari K., Shimura K., Sato K., Kitamori T., Ueda H. Micro OS-ELISA: rapid noncompetitive detection of a small biomarker peptide by open-sandwich enzyme-linked immunosorbent assay (OS-ELISA) integrated into microfluidic device. Lab Chip. 2010;10:92–100. doi: 10.1039/b915516c. [DOI] [PubMed] [Google Scholar]
- Ikami M., Kawakami A., Kakuta M., Okamoto Y., Kaji N., Tokeshi M., Baba Y. Immuno-pillar chip: a new platform for rapid and easy-to-use immunoassay. Lab Chip. 2010;10:3335–3340. doi: 10.1039/c0lc00241k. [DOI] [PubMed] [Google Scholar]
- Isaaq H.J., Veenstra T.D., Conrads T.P., Felschow D. The SELDI-TOF MS approach to proteomics: protein profiling and biomarker identification. Biochem. Biophys. Res. Commun. 2002;292:587–592. doi: 10.1006/bbrc.2002.6678. [DOI] [PubMed] [Google Scholar]
- Janasek D., Franzke J., Manz A. Scaling and the design of miniaturized chemical-analysis systems. Nature. 2006;442:374–380. doi: 10.1038/nature05059. [DOI] [PubMed] [Google Scholar]
- Jebrail M.J., Wheeler A.R. Let’s get digital: digitizing chemical biology with microfluidics. Curr. Opin. Chem. Biol. 2010;14:574–581. doi: 10.1016/j.cbpa.2010.06.187. [DOI] [PubMed] [Google Scholar]
- Ji J., O’Connell J.G., Carter D.J., Larson D.N. High-throughput nanohole array based system to monitor multiple binding events in real time. Anal. Chem. 2008;80:2491–2499. doi: 10.1021/ac7023206. [DOI] [PubMed] [Google Scholar]
- Jiang G.F., Attiya S., Ocvirk G., Lee W.E., Harrison D.J. Red diode laser induced fluorescence detection with a confocal microscope on a microchip for capillary electrophoresis. Biosens. Bioelectron. 2000;14:861–869. doi: 10.1016/s0956-5663(99)00056-1. [DOI] [PubMed] [Google Scholar]
- Jiang H., Weng X., Li D. Microfluidic whole-blood immunoassays. Microfluid. Nanofluidics. 2011;10:941–964. [Google Scholar]
- Jokerst J.V., Floriano P.N., Christodoulides N., Simmons G.W., McDevitt J.T. Integration of semiconductor quantum dots into nano-bio-chip systems for enumeration of CD4+T cell counts at the point-of-need. Lab Chip. 2008;8:2079–2090. doi: 10.1039/b817116e. [DOI] [PMC free article] [PubMed] [Google Scholar]
- Jones V.W., Kenseth J.R., Porter M.D. Microminiaturized immunoassays using atomic force microscopy and compositionally patterned antigen arrays. Anal. Chem. 1998;70:1233–1241. doi: 10.1021/ac971125y. [DOI] [PubMed] [Google Scholar]
- Kamholz A.E., Weigl B.H., Finlayson B.A., Yager P. Quantitative analysis of molecular interaction in a microfluidic channel: the T-sensor. Anal. Chem. 1999;71:5340–5347. doi: 10.1021/ac990504j. [DOI] [PubMed] [Google Scholar]
- Karlsson R., Michaelsson A., Mattsson L. Kinetic analysis of monoclonal antibody–antigen interactions with a new biosensor based analytical system. J. Immunol. Methods. 1991;145:229–240. doi: 10.1016/0022-1759(91)90331-9. [DOI] [PubMed] [Google Scholar]
- Kasahara Y., Ashihara Y. Simple devices and their possible application in clinical laboratory devices downsizing. Clin. Chim. Acta. 1997;267:87–102. doi: 10.1016/s0009-8981(97)00179-4. [DOI] [PubMed] [Google Scholar]
- Kawabata T., Wada H.G., Watanabe M., Satomura S. “Electrokinetic analyte transport assay” for alpha-fetoprotein immunoassay integrates mixing, reaction and separation on-chip. Electrophoresis. 2008;29:1399–1406. doi: 10.1002/elps.200700898. [DOI] [PubMed] [Google Scholar]
- Keller K.L., Iannone M.A. Multiplexed microsphere-based flow cytometric assays. Exp. Hematol. 2002;30:1227–1237. doi: 10.1016/s0301-472x(02)00922-0. [DOI] [PubMed] [Google Scholar]
- Keshishian H., Addona T., Burgess M., Kuhn E., Carr S.A. Quantitative, multiplexed assays for low abundance proteins in plasma by targeted mass spectrometry and stable isotope dilution. Mol. Cell. Proteomics. 2007;6:2212–2229. doi: 10.1074/mcp.M700354-MCP200. [DOI] [PMC free article] [PubMed] [Google Scholar]
- Kirby B. Cambridge University Press; 2010. Micro-and Nanoscale Fluid Mechanics: Transport in Microfluidic Devices. [Google Scholar]
- Klostranec J.M., Xiang Q., Farcas G.A., Lee J.A., Rhee A., Lafferty E.I., Perrault S.D., Kain K.C., Chan W.C.W. Convergence of quantum dot barcodes with microfluidics and signal processing for multiplexed high-throughput infectious disease diagnostics. Nano Lett. 2007;7:2812–2818. doi: 10.1021/nl071415m. [DOI] [PubMed] [Google Scholar]
- Kurita R., Yokota Y., Sato Y., Mizutani F., Niwa O. On-chip enzyme immunoassay of a cardiac marker using a microfluidic device combined with a portable surface plasmon resonance system. Anal. Chem. 2006;78:5525–5531. doi: 10.1021/ac060480y. [DOI] [PubMed] [Google Scholar]
- Lafleur, L., Lutz, B., Stevens, D., Spicar-Mihalic, P., Osborn, J., McKenzie, K. and Yager, P. Micro Total Analysis Systems, Conference Proceedings, Jeju, Korea. 1698–1700 (2009)
- Lee B.S., Lee J.-N., Park J.-M., Lee J.-G., Kim S., Cho Y.-K., Ko C. A fully automated immunoassay from whole blood on a disc. Lab Chip. 2009;9:1548–1555. doi: 10.1039/b820321k. [DOI] [PubMed] [Google Scholar]
- Lee J.A., Mardyani S., Hung A., Rhee A., Klostranec J., Mu Y., Li D., Chan W.C.W. Toward the accurate read-out of quantum dot barcodes: design of deconvolution algorithms and assessment of fluorescence signals in buffer. Adv. Mater. 2007;19:3113–3118. [Google Scholar]
- Lee K.-H., Su Y.-D., Chen S.-J., Tseng F.-G., Lee G.-B. Microfluidic systems integrated with two-dimensional surface plasmon resonance phase imaging systems for microarray immunoassay. Biosens. Bioelectron. 2007;23:466–472. doi: 10.1016/j.bios.2007.05.007. [DOI] [PubMed] [Google Scholar]
- Lee Y.-F., Lien K.-Y., Lei H.-Y., Lee G.-B. An integrated microfluidic system for rapid diagnosis of dengue virus infection. Biosens. Bioelectron. 2009;25:745–752. doi: 10.1016/j.bios.2009.08.020. [DOI] [PMC free article] [PubMed] [Google Scholar]
- Lien K.-Y., Hung L.-Y., Huang T.-B., Tsai Y.-C., Lei H.-Y., Lee G.-B. Rapid detection of influenza A virus infection utilizing an immunomagnetic bead-based microfluidic system. Biosens. Bioelectron. 2011;26:3900–3907. doi: 10.1016/j.bios.2011.03.006. [DOI] [PMC free article] [PubMed] [Google Scholar]
- Linder V., Sia S.K., Whitesides G.M. Reagent-loaded cartridges for valveless and automated fluid delivery in microfluidic devices. Anal. Chem. 2005;77:64–71. doi: 10.1021/ac049071x. [DOI] [PubMed] [Google Scholar]
- Linkov F., Ferris R.L., Yurkovetsky Z., Marrangoni M., Velikokhatnaya L.,, Gooding W. Multiplex analysis of cytokines as biomarkers that differentiate benign and malignant thyroid diseases. Proteomics Clin. Appl. 2008;2:1575–1585. doi: 10.1002/prca.200780095. [DOI] [PMC free article] [PubMed] [Google Scholar]
- Liu C. Recent developments in polymer MEMS. Adv. Mater. 2007;19:3783–3790. [Google Scholar]
- Liu H., Yang Y., Chen P., Zhong Z. Enhanced conductometric immunoassay for hepatitis B surface antigen using double-codified nanogold particles as labels. Biochem. Eng. J. 2009;45:107–112. [Google Scholar]
- Lokate A.M., Beusink J.B., Besselink G.A., Pruijn G.J., Schasfoort R.B. Biomolecular interaction monitoring of autoantibodies by scanning surface plasmon resonance microarray imaging. J. Am. Chem. Soc. 2007;129:14013–14018. doi: 10.1021/ja075103x. [DOI] [PubMed] [Google Scholar]
- Luchansky M.S., Washburn A.L., McClellan M.S., Bailey R.C. Sensitive on-chip detection of a protein biomarker in human serum and plasma over an extended dynamic range using silicon photonic microring resonators and sub-micron beads. Lab Chip. 2011;11:2042–2044. doi: 10.1039/c1lc20231f. [DOI] [PMC free article] [PubMed] [Google Scholar]
- Luecking A., Horn M., Eickhoff H., Bussow K., Lehrach H., Walter G. Protein microarrays for gene expression and antibody screening. Anal. Biochem. 1999;270:103–111. doi: 10.1006/abio.1999.4063. [DOI] [PubMed] [Google Scholar]
- Macbeath G., Schrieber S.L. Printing proteins as microarrays for high-throughput function determination. Science. 2000;289:1760–1763. doi: 10.1126/science.289.5485.1760. [DOI] [PubMed] [Google Scholar]
- Mace C.R., Streimar C.C., Miller B.L. Detection of human proteins using arrayed imaging reflectometry. Biosens. Bioelectron. 2008;24:334–337. doi: 10.1016/j.bios.2008.05.003. [DOI] [PMC free article] [PubMed] [Google Scholar]
- Madou M. (Boca Raton; CRC Press: 2011. Fundamentals of microfabrication and nanotechnology. [Google Scholar]
- Maier I., Morgan M.R.A., Lindner W., Pittner F. Optical resonance-enhanced absorption-based near-field immunochip biosensor for allergen detection. Anal. Chem. 2008;80:2694–2703. doi: 10.1021/ac702107k. [DOI] [PubMed] [Google Scholar]
- Mangru S.D., Harrison D.J. Chemiluminescence detection in integrated post-separation reactors for microchip-based capillary electrophoresis and affinity electrophoresis. Electrophoresis. 1998;19:2301–2307. doi: 10.1002/elps.1150191309. [DOI] [PubMed] [Google Scholar]
- Manz A., Graber N., Widmer H.M. Miniaturized total analysis systems: a novel concept for chemical sensors. Sensor. Actuat. 1990;B1:244–248. [Google Scholar]
- Manz A., Harrison D.J., Verpoorte E., Widmer H.M. Planar chips technology for miniaturization of separation systems – a developing perspective in chemical monitoring. Adv. Chromatogr. 1993;33:1–66. [Google Scholar]
- Martinez A.W., Phillips S.T., Whitesides G.M. Three-dimensional microfluidic devices fabricated in layered paper and tape. Proc. Natl. Acad. Sci. USA. 2008;105:19606–19611. doi: 10.1073/pnas.0810903105. [DOI] [PMC free article] [PubMed] [Google Scholar]
- Martinez A.W., Phillips S.T., Butte M.J., Whitesides G.M. Patterned paper as a platform for inexpensive, low-volume, portable bioassays. Angew. Chem. Int. Ed. 2007;46:1318–1320. doi: 10.1002/anie.200603817. [DOI] [PMC free article] [PubMed] [Google Scholar]
- Martinez A.W., Phillips S.T., Carrilho E., Thomas S.W., III, Sindi H., Whitesides G.M. Simple telemedicine for developing regions: camera phones and paper-based microfluidic devices for real-time, off-site diagnosis. Anal. Chem. 2008;80:3699–3707. doi: 10.1021/ac800112r. [DOI] [PMC free article] [PubMed] [Google Scholar]
- Martinez A.W., Phillips S.T., Nie Z., Cheng C.-M., Carrilho E., Wiley B.J., Whitesides G.M. Programmable diagnostic devices made from paper and tape. Lab Chip. 2010;10:2499–2504. doi: 10.1039/c0lc00021c. [DOI] [PubMed] [Google Scholar]
- Martinez A.W., Phillips S.T., Whitesides G.M., Carrilho E. Diagnostics for the developing world: microfluidic paper-based analytical devices. Anal. Chem. 2010;82:3–10. doi: 10.1021/ac9013989. [DOI] [PubMed] [Google Scholar]
- Martinez A.W., Phillips S.T., Wiley B.J., Gupta M., Whitesides G.M. FLASH: a rapid method for prototyping paper-based microfluidic devices. Lab Chip. 2008;8:2146–2150. doi: 10.1039/b811135a. [DOI] [PMC free article] [PubMed] [Google Scholar]
- Master S.R., Bieri C., Kricka L.J. Diagnostic challenges for multiplexed protein microarrays. Drug Discov. Today. 2006;11:1007–1011. doi: 10.1016/j.drudis.2006.09.010. [DOI] [PubMed] [Google Scholar]
- McDonald J.C., Duffy D.C., Anderson J.R., Chiu D.T., Wu H.K., Schueller O.J.A., Whitesides G.M. Fabrication of microfluidic systems in poly(dimethylsiloxane) Electrophoresis. 2000;21:27–40. doi: 10.1002/(SICI)1522-2683(20000101)21:1<27::AID-ELPS27>3.0.CO;2-C. [DOI] [PubMed] [Google Scholar]
- Meagher R.J., Hatch A.V., Renzi R.F., Singh A.K. An integrated microfluidic platform for sensitive and rapid detection of biological toxins. Lab Chip. 2008;8:2046–2053. doi: 10.1039/b815152k. [DOI] [PubMed] [Google Scholar]
- Miller J.C., Zhou H., Kwekel J., Cavallo R. Antibody microarray profiling of human prostate cancer sera: antibody screening and identification of potential biomarkers. Proteomics. 2003;3:56–63. doi: 10.1002/pmic.200390009. [DOI] [PubMed] [Google Scholar]
- Mohammed M.-I., Desmulliez M.P.Y. Lab-on-a-chip based immunosensor principles and technologies for the detection of cardiac biomarkers: a review. Lab Chip. 2011;11:569–595. doi: 10.1039/c0lc00204f. [DOI] [PubMed] [Google Scholar]
- Mondal K., Gupta M.N. The affinity concept in bioseparation: evolving paradigms and expanding range of applications. Biomol. Eng. 2006;23:59–76. doi: 10.1016/j.bioeng.2006.01.004. [DOI] [PubMed] [Google Scholar]
- Mooney J.F., Hunt A.J., McIntosh J.R. Patterning of functional antibodies and other proteins by photolithography of silane monolayers. Proc. Natl. Acad. Sci. USA. 1996;93:12287–12291. doi: 10.1073/pnas.93.22.12287. [DOI] [PMC free article] [PubMed] [Google Scholar]
- Morais S., Tortajada-Genaro L.A., Arnandis-Chover T., Puchades R., Maquieira A. Multiplexed microimmunoassays on a digital versatile disk. Anal. Chem. 2009;81:5646–5654. doi: 10.1021/ac900359d. [DOI] [PubMed] [Google Scholar]
- Mulvaney S.P., Cole C.L., Kniller M.D., Malito M., Tamanaha C.R., Rife J.C., Stanton M.W., Whitman L.J. Rapid, femtomolar bioassays in complex matrices combining microfluidics and magnetoelectronics. Biosens. Bioelectron. 2007;23:191–200. doi: 10.1016/j.bios.2007.03.029. [DOI] [PubMed] [Google Scholar]
- Mulvaney S.P., Musick M.D., Keating C.D., Natan M.J. Glass-coated, analyte-tagged nanoparticles: a new tagging system based on detection with surface-enhanced Raman scattering. Langmuir. 2003;19:4784–4790. [Google Scholar]
- Myers F.B., Lee L.P. Innovations in optical microfluidic technologies for point-of-care diagnostics. Lab Chip. 2008;8:2015–2031. doi: 10.1039/b812343h. [DOI] [PubMed] [Google Scholar]
- Nagel T., Ehrentreich-Foerster E., Singh M., Schmitt K., Brandenburg A., Berka A., Bier F.F. Direct detection of tuberculosis infection in blood serum using three optical label-free approaches. Sensor. Actuat. B Chem. 2008;129:934–940. [Google Scholar]
- Nam J.M., Thaxton C.S., Mirkin C.A. Nanoparticle-based bio-bar codes for the ultrasensitive detection of proteins. Science. 2003;301:1884–1886. doi: 10.1126/science.1088755. [DOI] [PubMed] [Google Scholar]
- Napoli M., Eijkel J.C.T., Pennathur S. Nanofluidic technology for biomolecule applications: a critical review. Lab Chip. 2010;10:957–985. doi: 10.1039/b917759k. [DOI] [PubMed] [Google Scholar]
- Nie Z., Nijhuis C.A., Gong J., Chen X., Kumachev A., Martinez A.W., Narovlyansky M., Whitesides G.M. Electrochemical sensing in paper-based microfluidic devices. Lab Chip. 2010;10:477–483. doi: 10.1039/b917150a. [DOI] [PMC free article] [PubMed] [Google Scholar]
- Nunes P.S., Ohlsson P.D., Ordeig O., Kutter J.P. Cyclic olefin polymers: emerging materials for lab-on-a-chip applications. Microfluid. Nanofluidics. 2010;9:145–161. [Google Scholar]
- Ohashi T., Mawatari K., Sato K., Tokeshi M., Kitamori T. A micro-ELISA system for the rapid and sensitive measurement of total and specific immunoglobulin E and clinical application to allergy diagnosis. Lab Chip. 2009;9:991–995. doi: 10.1039/b815475a. [DOI] [PubMed] [Google Scholar]
- Okada H., Hosokawa K., Maeda M. Power-free microchip immunoassay of PSA in human serum for point-of-care testing. Anal. Sci. 2011;27:237–241. doi: 10.2116/analsci.27.237. [DOI] [PubMed] [Google Scholar]
- Okuno J., Maehashi K., Kerman K., Takamura Y., Matsumoto K., Tamiya E. Biosens. Bioelectron. 2007;22:2377–2381. doi: 10.1016/j.bios.2006.09.038. [DOI] [PubMed] [Google Scholar]
- Osterfeld S.J., Yu H., Gaster R.S., Caramuta S., Xu L., Han S.-J. Multiplex protein assays based on real-time magnetic nanotag sensing. Proc. Natl. Acad. Sci. USA. 2008;105:20637–20640. doi: 10.1073/pnas.0810822105. [DOI] [PMC free article] [PubMed] [Google Scholar]
- Owicki J.C., Bousse L.J., Hafeman D.G. The light-addressable poteniometric sensor. Ann. Rev. Biophys. Biomol. Struct. 1994;23:87–113. doi: 10.1146/annurev.bb.23.060194.000511. [DOI] [PubMed] [Google Scholar]
- Özkumur E., Needham J., Bergstein D., Gonzalez R., Cabodi M., Gershoni J., Goldberg B., Ünlü M. Label-free and dynamic detection of biomolecular interactions for high-throughput microarray applications. Proc. Natl. Acad. Sci. USA. 2008;105:7988–7992. doi: 10.1073/pnas.0711421105. [DOI] [PMC free article] [PubMed] [Google Scholar]
- Pamme N. Magnetism and microfluidics. Lab Chip. 2006;6:24–38. doi: 10.1039/b513005k. [DOI] [PubMed] [Google Scholar]
- Panini N.V., Messina G.A., Salinas E., Fernandez H., Raba J. Integrated microfluidic systems with an immunosensor modified with carbon nanotubes for detection of prostate specific antigen (PSA) in human serum samples. Biosens. Bioelectron. 2008;23:1145–1151. doi: 10.1016/j.bios.2007.11.003. [DOI] [PubMed] [Google Scholar]
- Parsa H., Chin C.D., Mongkolwisetwara P., Lee B.W., Wang J.J., Sia S.K. Effect of volume- and time-based constraints on capture of analytes in microfluidic heterogeneous immunoassays. Lab Chip. 2008;8:2062–2070. doi: 10.1039/b813350f. [DOI] [PubMed] [Google Scholar]
- Paweletz C.P., Charboneau L., Bichsel V.E., Simone N.L. Reverse phase protein microarrays which capture disease progression show activation of prosurvival pathways at the cancer invasion front. Oncogene. 2001;20:1981–1989. doi: 10.1038/sj.onc.1204265. [DOI] [PubMed] [Google Scholar]
- Petkus M.M., McLauchlin M., Vuppu A.K., Rios L., Garcia A.A., Hayes M.A. Detection of FITC-cortisol via modulated supraparticle lighthouses. Anal. Chem. 2006;78:1405–1411. doi: 10.1021/ac0512204. [DOI] [PubMed] [Google Scholar]
- Peyman S.A., Iles A., Pamme N. Mobile magnetic particles as solid-supports for rapid surface-based bioanalysis in continuous flow. Lab Chip. 2009;9:3110–3117. doi: 10.1039/b904724g. [DOI] [PubMed] [Google Scholar]
- Phillips T.M., Wellner E.F. Analysis of inflammatory biomarkers from tissue biopsies by chip-based immunoaffinity CE. Electrophoresis. 2007;28:3041–3048. doi: 10.1002/elps.200700193. [DOI] [PubMed] [Google Scholar]
- Phillips T.M., Wellner E.F. Measurement of naproxen in human plasma by chip-based immunoaffinity capillary electrophoresis. Biomed. Chromatogr. 2006;20:662–667. doi: 10.1002/bmc.673. [DOI] [PubMed] [Google Scholar]
- Pollard H.B., Srivastava M., Eidelman O. Protein microarray platforms for clinical proteomics. Proteomics Clin. Appl. 2007;1:934–952. doi: 10.1002/prca.200700154. [DOI] [PubMed] [Google Scholar]
- Price C.P. The evolution of immunoassay as seen through the journal clinical chemistry. Clin. Chem. 1998;44:2071–2074. [PubMed] [Google Scholar]
- Ramachandran N., Hainsworth E., Bhullar B., Eisenstein S., Rosen B., Lau A.Y., Walter J.C., LaBaer J. Self-assembling protein microarrays. Science. 2004;305:86–90. doi: 10.1126/science.1097639. [DOI] [PubMed] [Google Scholar]
- Rasooly A. Moving biosensors to point-of-care cancer diagnostics. Biosens. Bioelectron. 2006;21:1847–1850. doi: 10.1016/j.bios.2006.02.001. [DOI] [PubMed] [Google Scholar]
- Regnier F.E., Skates S.J., Mesri M., Rodriguez H., Tezak Z., Kondratovich M.V. Protein-based multiplex assays: mock pre-submissions to the US food and drug administration. Clin. Chem. 2010;56:165–171. doi: 10.1373/clinchem.2009.140087. [DOI] [PubMed] [Google Scholar]
- Riegger L., Grumann M., Nann T., Riegler J., Ehlert O., Bessler W., Mittenbuehler K., Urban G., Pastewka L., Brenner T., Zengerle R., Ducree J. Read-out concepts for multiplexed bead-based fluorescence immunoassays on centrifugal microfluidic platforms. Sensor. Actuat. A Phys. 2006;126:455–462. [Google Scholar]
- Riegger L., Steigert J., Grumann M., Lutz S., Olofsson G., Khayyami M., Bessler W., Mittenbuehler K., Zengerle R., Ducreee J. Tenth Int. Conf. on Miniaturized Systems for Chemistry and Life Sciences (uTAS 2006) Tokyo, Japan. Society for Chemistry and Micro-Nano Systems; 2006. Disk-based parallel chemiluminescent detection of diagnostic markers for acute myocardial infarction. Fujita, H., Kitamori, T. and Hasebe, S.), 819–821. [Google Scholar]
- Rifai N., Gillette M.A., Carr S.A. Protein biomarker discovery and validation: the long and uncertain path to clinical utility. Nat. Biotechnol. 2006;24:971–983. doi: 10.1038/nbt1235. [DOI] [PubMed] [Google Scholar]
- Rodriguez H., Tezak Z., Mesri M., Carr S.A., Liebler D.C. Analytical validation of protein-based multiplex assays: a workshop report by the NCI-FDA interagency oncology task force on molecular diagnostics. Clin. Chem. 2010;56:237–242. doi: 10.1373/clinchem.2009.136416. [DOI] [PubMed] [Google Scholar]
- Ronkainen N.J., Halsall H.B., Heineman W.R. Electrochemical biosensors. Chem. Soc. Rev. 2010;39:1747–1763. doi: 10.1039/b714449k. [DOI] [PubMed] [Google Scholar]
- Ruckstuhl T., Winterflood C.M., Seeger S. Supercritical angle fluorescence immunoassay platform. Anal. Chem. 2011;83:2345–2350. doi: 10.1021/ac1032758. [DOI] [PubMed] [Google Scholar]
- Ryu G., Huang J., Hofmann O., Walshe C.A., Sze J.Y.Y., McClean G.D., Mosley A., Rattle S.J., deMello J.C., deMello A.J., Bradley D.D.C. Highly sensitive fluorescence detection system for microfluidic lab-on-a-chip. Lab Chip. 2011;11:1664–1670. doi: 10.1039/c0lc00586j. [DOI] [PubMed] [Google Scholar]
- Sanchez-Carbayo M., Socci N.D., Lozano J.J., Haab B.B., Cordon-Cardo C. Profiling bladder cancer using targeted antibody arrays. Am. J. Pathol. 2006;168:93–103. doi: 10.2353/ajpath.2006.050601. [DOI] [PMC free article] [PubMed] [Google Scholar]
- Santomauro A.G., Sciarra J.J. Comparative evaluation of a hemagglutination inhibition test and a latex agglutination inhibition test for HCG. Obstet. Gynecol. 1967;29:520–525. [PubMed] [Google Scholar]
- Sato K., Tokeshi M., Kimura H., Kitamori T. Determination of carcinoembryonic antigen in human sera by integrated bead immunoassay in a microchip for cancer diagnosis. Anal. Chem. 2001;73:1213–1218. doi: 10.1021/ac000991z. [DOI] [PubMed] [Google Scholar]
- Sato K., Tokeshi M., Odake T., Kimura H., Ooi T., Nakao M., Kitamori T. Integration of an immunosorbent assay system: analysis of secretory human immunoglobulin A on polystyrene beads in a microchip. Anal. Chem. 2000;72:1144–1147. doi: 10.1021/ac991151r. [DOI] [PubMed] [Google Scholar]
- Sauer G., Schneiderhan-Marra N., Kazmaier C., Hutzel K., Koretz K., Muche R. Prediction of nodal involvement in breast cancer based on multiparametric protein analysis from preoperative core needle biopsies of the primary lesion. Clin. Cancer Res. 2008;14:3345–3353. doi: 10.1158/1078-0432.CCR-07-4802. [DOI] [PubMed] [Google Scholar]
- Schena M. Oxford University Press; Oxford: 1999. DNA Microarrays. A Practical Approach. [Google Scholar]
- Schena M. Eaton Publishing; Natick, MA: 2000. Microarray Biochip Technology. [Google Scholar]
- Schweitzer B., Roberts S., Grimwade B., Shao W. Multiplexed protein profiling on microarrays by rolling-circle amplification. Nat. Biotechnol. 2002;20:359–365. doi: 10.1038/nbt0402-359. [DOI] [PMC free article] [PubMed] [Google Scholar]
- Schweitzer B., Wiltshire S., Lambert J. Inaugural article: immunoassays with rolling circle DNA amplification: a versatile platform for ultrasensitive antigen detection. Proc. Natl. Acad. Sci. USA. 2000;97:10113–10119. doi: 10.1073/pnas.170237197. [DOI] [PMC free article] [PubMed] [Google Scholar]
- Sebastiani V., Botti C., Di Tondo U., Visca P. Tissue microarray analysis of FAS, Bcl-2, Bcl-x, ER, PgR, HSP60, p53 and Her2-neu in breast carcinoma. Anticancer Res. 2006;26:2983–2987. [PubMed] [Google Scholar]
- Shafer M.W., Mangold L., Partin A.W., Haab B.B. Antibody array profiling reveals serum TSP-1 as a marker to distinguish benign from malignant prostatic disease. Prostate. 2006;67:255–267. doi: 10.1002/pros.20514. [DOI] [PubMed] [Google Scholar]
- Shankaran D.R., Miura N. Trends in interfacial design for surface plasmon resonance based immunoassays. J. Phys. D Appl. Phys. 2007;40:7187–7200. [Google Scholar]
- Shankaran D.R., Gobi K.V.A., Miura N. Recent advancements in surface plasmon resonance immunosensors for detection of small molecules of biomedical, food and environmental interest. Sensor. Actuat. B Chem. 2007;121:158–177. [Google Scholar]
- Sia S.K., Kricka L.J. Microfluidics and point-of-care testing. Lab Chip. 2008;8:1982–1983. doi: 10.1039/b817915h. [DOI] [PubMed] [Google Scholar]
- Sia S.K., Whitesides G.M. Microfluidic devices fabricated in poly(dimethylsiloxane) for biological studies. Electrophoresis. 2003;24:3563–3576. doi: 10.1002/elps.200305584. [DOI] [PubMed] [Google Scholar]
- Sigurdson M., Wang D.Z., Meinhart C.D. Electrothermal stirring for heterogeneous immunoassays. Lab Chip. 2005;5:1366–1373. doi: 10.1039/b508224b. [DOI] [PubMed] [Google Scholar]
- Silzel J.W., Cercek B., Dodson C., Tsay T., Obremski R.J. Mass-sensing, multianalyte microarray immunoassay with imaging detection. Clin. Chem. 1998;44:2036–2043. [PubMed] [Google Scholar]
- Simpson R.J. Chapter 10 in Proteins and Proteomics. Cold Spring Harbor Laboratory Press; Cold Spring Harbor, NY, USA: 2003. Characterization of protein complexes. [Google Scholar]
- Sinensky A., Belcher A. Label-free and high resolution protein/DNA nanoarray analysis using Kelvin probe force microscopy. Nat. Nanotechnol. 2007;2:653–659. doi: 10.1038/nnano.2007.293. [DOI] [PubMed] [Google Scholar]
- Sista R.S., Eckhardt A.E., Srinivasan V., Pollack M.G., Palanki S., Pamula V.K. Heterogeneous immunoassays using magnetic beads on a digital microfluidic platform. Lab Chip. 2008;8:2188–2196. doi: 10.1039/b807855f. [DOI] [PMC free article] [PubMed] [Google Scholar]
- Sista R.S., Hua Z., Thwar P., Sudarsan A., Srinivasan V., Eckhardt A., Pollack M., Pamula V. Development of a digital microfluidic platform for point of care testing. Lab Chip. 2008;8:2091–2104. doi: 10.1039/b814922d. [DOI] [PMC free article] [PubMed] [Google Scholar]
- Sparreboom W., van den Berg A., Eijkel J.C.T. Principles and applications of nanofluidic transport. Nat. Nanotechnol. 2009;4:713–720. doi: 10.1038/nnano.2009.332. [DOI] [PubMed] [Google Scholar]
- Sparreboom W., van den Berg A., Eijkel J.C.T. Transport in nanofluidic systems: a review of theory and applications. New J. Phys. 2010;12:015004. [Google Scholar]
- Srinivasan V., Pamula V.K., Fair R.B. An integrated digital microfluidic lab-on-a-chip for clinical diagnostics on human physiological fluids. Lab Chip. 2004;4:310–315. doi: 10.1039/b403341h. [DOI] [PubMed] [Google Scholar]
- Srivastava M., Eidelmann O., Jozwik C., Paweletz C. Serum proteomic signature for cystic fibrosis using an antibody microarray platform. Mol. Genet. Metab. 2006;87:303–310. doi: 10.1016/j.ymgme.2005.10.021. [DOI] [PubMed] [Google Scholar]
- Steigert J., Grumann M., Brenner T., Riegger L., Harter J., Zengerle R., Ducree J. Fully integrated whole blood testing by real-time absorption measurement on a centrifugal platform. Lab Chip. 2006;6:1040–1044. doi: 10.1039/b607051p. [DOI] [PubMed] [Google Scholar]
- Stern E., Vacic A., Rajan N.K., Criscione J.M., Park J., Ilic B.R., Mooney D.J., Reed M.A., Fahmy T.M. Label-free biomarker detection from whole blood. Nat. Nanotechnol. 2010;5:138–142. doi: 10.1038/nnano.2009.353. [DOI] [PMC free article] [PubMed] [Google Scholar]
- Stevens D.Y., Petri C.R., Osborn J.L., Spicar-Mihalic P., McKenzie K.G., Yager P. Enabling a microfluidic immunoassay for the developing world by integration of on-card dry reagent storage. Lab Chip. 2008;8:2038–2045. doi: 10.1039/b811158h. [DOI] [PubMed] [Google Scholar]
- Stoevesandt O., Taussig M.J. Affinity reagent resources for human proteome detection: initiatives and perspectives. Proteomics. 2007;7:2738. doi: 10.1002/pmic.200700155. [DOI] [PubMed] [Google Scholar]
- Tachi T., Kaji N., Tokeshi M., Baba Y. Microchip-based homogeneous immunoassay using fluorescence polarization spectroscopy. Lab Chip. 2009;9:966–971. doi: 10.1039/b813640h. [DOI] [PubMed] [Google Scholar]
- Tao S.C., Chen C.S., Zhu H. Applications of protein microarray technology. Comb. Chem. High Throughput Screen. 2007;10:706–718. doi: 10.2174/138620707782507386. [DOI] [PubMed] [Google Scholar]
- Tarn M.D., Pamme N. Microfluidic platforms for performing surface-based clinical assays. Expert Rev. Mol. Diagn. 2011;11:711–720. doi: 10.1586/erm.11.59. [DOI] [PubMed] [Google Scholar]
- Taussig M.J., Stoevesandt O., Borrebaeck C.A.K., Bradbury A.R. ProteomeBinders: planning a European resource of affinity reagents for analysis of the human proteome. Nat. Methods. 2007;4:13. doi: 10.1038/nmeth0107-13. [DOI] [PubMed] [Google Scholar]
- Tsukagoshi K., Jinno N., Nakajima R. Development of a micro total analysis system incorporating chemiluminescence detection and application to detection of cancer markers. Anal. Chem. 2005;77:1684–1688. doi: 10.1021/ac040133t. [DOI] [PubMed] [Google Scholar]
- Uludag Y., Tothill I.E. Development of a sensitive detection method of cancer biomarkers in human serum (75%) using a quartz crystal microbalance sensor and nanoparticles amplification system. Talanta. 2010;82:277–282. doi: 10.1016/j.talanta.2010.04.034. [DOI] [PubMed] [Google Scholar]
- Varnum S.M., Woodbury R.I., Zanger R.C. A protein microarray ELISA for screening biological fluids. Methods Mol. Biol. 2004;264:161–172. doi: 10.1385/1-59259-759-9:161. [DOI] [PubMed] [Google Scholar]
- Visintin I., Feng Z., Longton G., Ward D.C., Alvero A.B., Lai Y. Diagnostic markers for early detection of ovarian cancer. Clin. Cancer Res. 2008;14:1065–1072. doi: 10.1158/1078-0432.CCR-07-1569. [DOI] [PubMed] [Google Scholar]
- Vorderwülbecke S., Cleverey S., Weiberger S.R., Wiesner A. Protein quantification by the SELDI-TOF-MS based proteinchip® system. Nat. Methods. 2005;2:393–395. [Google Scholar]
- Waggoner P.S., Craighead H.G. Micro- and nanomechanical sensors for environmental, chemical, and biological detection. Lab Chip. 2007;7:1238–1255. doi: 10.1039/b707401h. [DOI] [PubMed] [Google Scholar]
- Waggoner P.S., Tan C.P., Craighead H.G. Microfluidic integration of nanomechanical resonators for protein analysis in serum. Sensor. Actuat. B Chem. 2010;150:550–555. [Google Scholar]
- Wang J. Electrochemical biosensors: towards point-of-care cancer diagnostics. Biosens. Bioelectron. 2006;21:1887–1892. doi: 10.1016/j.bios.2005.10.027. [DOI] [PubMed] [Google Scholar]
- Wang J., Ibanez A., Chatrathi M.P., Escarpa A. Electrochemical enzyme immunoassays on microchip platforms. Anal. Chem. 2001;73:5323–5327. doi: 10.1021/ac010808h. [DOI] [PubMed] [Google Scholar]
- Wang X., Zhao M., Nolte D. Area-scaling of interferometric and fluorescent detection of protein on antibody microarrays. Biosens. Bioelectron. 2008;24:987–993. doi: 10.1016/j.bios.2008.07.078. [DOI] [PubMed] [Google Scholar]
- Wang Z., Meng Y., Ying P., Qi C., Jin G. A label-free protein microfluidic array for parallel immunoassays. Electrophoresis. 2006;27:4078–4085. doi: 10.1002/elps.200500956. [DOI] [PubMed] [Google Scholar]
- Wassaf D., Kuang G., Kopacz K., Wu Q.L. High-throughput affinity ranking of antibodies using surface plasmon resonance microarrays. Anal. Biochem. 2006;351:241–253. doi: 10.1016/j.ab.2006.01.043. [DOI] [PubMed] [Google Scholar]
- Weigl B., Domingo G., Labarre P., Gerlach J. Towards non- and minimally instrumented, microfluidics-based diagnostic devices. Lab Chip. 2008;8:1999–2014. doi: 10.1039/b811314a. [DOI] [PMC free article] [PubMed] [Google Scholar]
- Wellner E.F., Kalish H. A chip-based immunoaffinity capillary electrophoresis assay for assessing hormones in human biological fluids. Electrophoresis. 2008;29:3477–3483. doi: 10.1002/elps.200700785. [DOI] [PMC free article] [PubMed] [Google Scholar]
- Weng S., Gu K., Hammond P.W., Lohse P., Rise C., Wagner R.W., Wright M.C., Kuimelis R.G. Generating addressable protein microarrays with PROfusion covalent mRNA-protein fusion technology. Proteomics. 2002;2:48–57. [PubMed] [Google Scholar]
- West J., Becker M., Tombrink S., Manz A. Micro total analysis systems: latest achievements. Anal. Chem. 2008;80:4403–4419. doi: 10.1021/ac800680j. [DOI] [PubMed] [Google Scholar]
- Whiteley G. Bringing diagnostic technologies to the clinical laboratory: rigor, regulation and reality. Proteomics Clin. Appl. 2008;2:1378–1385. doi: 10.1002/prca.200780170. [DOI] [PMC free article] [PubMed] [Google Scholar]
- Wong A.P., Gupta M., Shevkoplyas S.S., Whitesides G.M. Egg beater as centrifuge: isolating human blood plasma from whole blood in resource-poor settings. Lab Chip. 2008;8:2032–2037. doi: 10.1039/b809830c. [DOI] [PubMed] [Google Scholar]
- Wulfkuhle J.D., Aquino J.A., Calvert V.S., Fishman D.A. Signal pathway profiling of ovarian cancer from human tissue specimens using reverse-phase protein microarrays. Proteomics. 2003;3:2085–2090. doi: 10.1002/pmic.200300591. [DOI] [PubMed] [Google Scholar]
- Yacoub-George E., Hell W., Meixner L., Wenninger F., Bock K., Lindner P., Wolf H., Kloth T., Feller K.A. Automated 10-channel capillary chip immunodetector for biological agents detection. Biosens. Bioelectron. 2007;22:1368–1375. doi: 10.1016/j.bios.2006.06.003. [DOI] [PubMed] [Google Scholar]
- Yager P., Edwards T., Fu E., Helton K., Nelson K., Tam M.R., Weigl B.H. Microfluidic diagnostic technologies for global public health. Nature. 2006;442:412–418. doi: 10.1038/nature05064. [DOI] [PubMed] [Google Scholar]
- Yan Z., Zhou L., Zhao Y., Wang J., Huang L., Hu K., Liu H., Wang H., Guo Z., Song Y., Huang H., Yang R. Rapid quantitative detection of Yersinia pestis by lateral-flow immunoassay and up-converting phosphor technology-based biosensor. Sensor. Actuat. B Chem. 2006;119:656–663. doi: 10.1016/j.snb.2006.01.029. [DOI] [PMC free article] [PubMed] [Google Scholar]
- Yang W., Yu M., Sun X., Woolley A.T. Microdevices integrating affinity columns and capillary electrophoresis for multibiomarker analysis in human serum. Lab Chip. 2010;10:2527–2533. doi: 10.1039/c005288d. [DOI] [PMC free article] [PubMed] [Google Scholar]
- Yang Y.-N., Lin H.-I., Wang J.-H., Shiesh S.-C., Lee G.-B. An integrated microfluidic system for C-reactive protein measurement. Biosens. Bioelectron. 2009;24:3091–3096. doi: 10.1016/j.bios.2009.03.034. [DOI] [PubMed] [Google Scholar]
- Yasukawa T., Suzuki M., Sekiya T., Shiku H., Matsue T. Flow sandwich-type immunoassay in microfluidic devices based on negative dielectrophoresis. Biosens. Bioelectron. 2007;22:2730–2736. doi: 10.1016/j.bios.2006.11.010. [DOI] [PubMed] [Google Scholar]
- Yoo S.J., Choi Y.B., Il Ju J., Tae G.-S., Kim H.H., Lee S.-H. Microfluidic chip-based electrochemical immunoassay for hippuric acid. Analyst. 2009;134:2462–2467. doi: 10.1039/b915356j. [DOI] [PubMed] [Google Scholar]
- Yu X., Schneiderhan-Marra N., Joos T.O. Protein microarrays for personalized medicine. Clin. Chem. 2010;56:376–387. doi: 10.1373/clinchem.2009.137158. [DOI] [PMC free article] [PubMed] [Google Scholar]
- Yuan X., Yoshimoto K., Nagasaki Y. High-performance immunolatex possessing a mixed-PEG/antibody co-immobilized surface: highly sensitive ferritin immunodiagnostics. Anal. Chem. 2009;81:1549–1556. doi: 10.1021/ac802282c. [DOI] [PubMed] [Google Scholar]
- Yue M., Stachowiak J.C., Lin H., Datar R. Label-free protein recognition two-dimensional array using nanomechanical sensors. Nano Lett. 2008;8:520–524. doi: 10.1021/nl072740c. [DOI] [PubMed] [Google Scholar]
- Zajac A., Song D., Qian W., Zhukov T. Protein microarrays and quantum dot probes for early cancer detection. Colloids Surf. B. Biointerfaces. 2007;58:309–314. doi: 10.1016/j.colsurfb.2007.02.019. [DOI] [PubMed] [Google Scholar]
- Zhang S., Cao W., Li J., Su M. MCE enzyme immunoassay for carcinoembryonic antigen and alpha-fetoprotein using electrochemical detection. Electrophoresis. 2009;30:3427–3435. doi: 10.1002/elps.200800805. [DOI] [PubMed] [Google Scholar]
- Zhao W., van den Berg A. Lab on paper. Lab Chip. 2008;8:1988–1991. doi: 10.1039/b814043j. [DOI] [PubMed] [Google Scholar]
- Zhou J., Ellis A.V., Voelcker N.H. Recent developments in PDMS surface modification for microfluidic devices. Electrophoresis. 2010;31:2–16. doi: 10.1002/elps.200900475. [DOI] [PubMed] [Google Scholar]
- Zhu H., Hu S., Jona G., Zhu X., Kreiswirth N., Willey B.M., Mazzulli T., Liu G., Song Q., Chen P. Severe acute respiratory syndrome diagnostics using a coronavirus protein microarray. Proc. Natl. Acad. Sci. USA. 2006;103:4011–4016. doi: 10.1073/pnas.0510921103. [DOI] [PMC free article] [PubMed] [Google Scholar]
- Zhu H., Bilgin M., Snyder M. Proteomics. Ann. Rev. Biochem. 2003;72:783–812. doi: 10.1146/annurev.biochem.72.121801.161511. [DOI] [PubMed] [Google Scholar]
- Zhu H., Bilgin M., Bangham R., Hall D. Global analysis of protein activities using proteome chips. Science. 2001;293:2101–2105. doi: 10.1126/science.1062191. [DOI] [PubMed] [Google Scholar]
- Zhu H., Klemic J.F., Chang S., Bertone P., Casamayor A., Klemic J.G., Smith D., Gerstein M., Reed M.A., Snyder M. Analysis of yeast protein kinases using protein chips. Nat. Genet. 2000;26:283–289. doi: 10.1038/81576. [DOI] [PubMed] [Google Scholar]
- Zhu X., Landry J.P., Sun Y.-S., Gregg J.P., Lam K.S., Guo X. Oblique-incidence reflectivity difference microscope for label-free high-throughput detection of biochemical reactions in a microarray format. Appl. Opt. 2007;46:1890–1895. doi: 10.1364/ao.46.001890. [DOI] [PMC free article] [PubMed] [Google Scholar]
- Zimmermann M., Hunziker P., Delamarche E. Autonomous capillary system for one-step immunoassays. Biomed. Microdevices. 2009;11:1–8. doi: 10.1007/s10544-008-9187-2. [DOI] [PubMed] [Google Scholar]
- Zimmermann M., Schmid H., Hunziker P., Delamarche E. Capillary pumps for autonomous capillary systems. Lab Chip. 2007;7:119–125. doi: 10.1039/b609813d. [DOI] [PubMed] [Google Scholar]
Further Reading
- Chandra H., Srivastava S. Cell-free synthesis-based protein microarrays and their applications. Proteomics. 2010;10:717–730. doi: 10.1002/pmic.200900462. [DOI] [PubMed] [Google Scholar]
- Kricka L.J., Master S.R. Validation and quality control of protein microarray-based analytical methods. Mol. Biotechnol. 2008;38:19–31. doi: 10.1007/s12033-007-0066-5. [DOI] [PubMed] [Google Scholar]
- Makawita S., Diamandis E.P. The bottleneck in the cancer biomarker pipeline and protein quantification through mass spectrometry-based approaches: current strategies for candidate verification. Clin. Chem. 2010;56:212–222. doi: 10.1373/clinchem.2009.127019. [DOI] [PubMed] [Google Scholar]
- Ramachandran N., Larson D.N., Stark P.R., Hainsworth E., LaBaer J. Emerging tools for real-time label-free detection of interactions on functional protein microarrays. FEBS J. 2005;272:5412–5425. doi: 10.1111/j.1742-4658.2005.04971.x. [DOI] [PubMed] [Google Scholar]
- Ramachandran N., Raphael J.V., Hainsworth E., Demirkan G., Fuentes M.G., Rolfs A., Hu Y., LaBaer J. Next generation high-density self-assembling functional protein arrays. Nat. Methods. 2008;5:535–538. doi: 10.1038/nmeth.1210. [DOI] [PMC free article] [PubMed] [Google Scholar]
- Ramachandran N., Srivastrava S., LaBaer J. Applications of protein microarrays for biomarker discovery. Proteomics Clin. Appl. 2008:1444–1459. doi: 10.1002/prca.200800032. [DOI] [PMC free article] [PubMed] [Google Scholar]
- Ray S., Mehta G., Srivastava S. Label-free detection techniques for protein microarrays: prospects, merits and challenges. Proteomics. 2010;10:731–748. doi: 10.1002/pmic.200900458. [DOI] [PMC free article] [PubMed] [Google Scholar]
- Rifai N., Gillette M.A., Carr S.A. Protein biomarker discovery and validation: the long and uncertain path to clinical utility. Nat. Biotechnol. 2006;24:971–983. doi: 10.1038/nbt1235. [DOI] [PubMed] [Google Scholar]
- Schena M., editor. Protein Microarrays. Jones and Bartlett, Sudbury Mass; 2005. [Google Scholar]
- Wu C.J., editor. Protein Microarray for Disease Analysis. vol. 723. Humana Press; 2011. (Methods in Molecular Biology). [Google Scholar]
- Zhu H., Snyder M. Protein arrays and microarrays. Curr. Opin. Chem. Biol. 2001;5:40–45. doi: 10.1016/s1367-5931(00)00170-8. [DOI] [PubMed] [Google Scholar]