

Laboratory tests are done for a variety of reasons. Screening tests, such as a complete blood count (CBC), may be done on clinically normal animals when they are acquired to avoid a financial and/or emotional commitment to a diseased animal, to examine geriatric patients for subclinical disease, or to identify a condition that might make an animal an anesthetic or surgical risk. Screening tests are often done when an ill animal is first examined, especially if systemic signs of illness are present and a specific diagnosis is not apparent from the history and physical examination. Tests are also done to confirm a presumptive diagnosis. A test may be repeated or a different test may be done to confirm a test result that was previously reported to be abnormal. Tests may be done to assist in the determination of the severity of a disease, to help formulate a prognosis, and to monitor the response to therapy or progression of disease.
Decisions to request hematology tests in animals are largely based on the cost of the test versus the potential benefit of the result to the animal. A CBC is routinely done to establish a database for patient evaluation, while other hematology tests may be done in an attempt to evaluate a specific problem. Examples of more specific hematologic tests that focus on a problem identified during the diagnostic evaluation of an animal include coagulation tests, such as prothrombin time; bone marrow biopsy and interpretation; and immunologic tests, such as the direct Coombs’ test. Although single tests may be done to address a specific problem (e.g., an erythrocyte phosphofructokinase assay), multiple tests are often utilized to provide a more comprehensive answer to a broader problem (e.g., a hemostasis panel is generally requested to evaluate a bleeding animal).
Stat is an abbreviation for statim (Latin meaning “immediately”). Stat tests are tests that are given high priority and begun immediately in situations where rapid results are needed for the medical management of critically ill patients. Additional fees may be charged for stat tests because they disrupt the flow of work in the laboratory and result in inefficiency.
Internal Versus External Laboratories
A variety of factors should influence the decision of whether a test will be done in an in-house laboratory or be sent to an external laboratory. A major concern is whether the necessary personnel, equipment, and supplies are available to perform the test accurately. Considerations include personnel knowledge of species differences and a willingness to conduct quality-control tests to verify that the procedure is working properly. The costs per test (technician time, reagent costs, equipment costs) must be compared to determine which option is more economical. The stability of the test may determine whether it will be done internally. The time it takes to obtain results may be important, especially with critically ill patients. The hours of operation of the laboratories are important for test results that are needed at night or on the weekend. Commercial laboratories generally have better quality control than laboratories within private practices.
Commercial veterinary laboratories are preferred to commercial human laboratories because errors can occur if tests designed to evaluate human samples are used without modification to test samples from animals. Hematology analyzers must be calibrated for species differences to obtain accurate results. Technologists must be aware that blood cell morphology and blood parasites are different in various animal species. Antibody-dependent immunology tests designed for humans are generally not valid in animals. Veterinary laboratories are more likely to have established their own reference intervals for various animal species (as opposed to extracting them from the literature) than are human laboratories. A knowledge of specific animal diseases and training in veterinary laboratory medicine is essential for the evaluation of hematologic specimens and interpretation of laboratory data; consequently a veterinary clinical pathologist should be available to perform certain subjective tests and provide consultation concerning all test results.
Reference Intervals
In order to be able to interpret laboratory data from ill animals, it is essential that appropriate reference intervals be established from apparently healthy animals drawn from the same general population as the ill animals to be examined. The term reference interval is preferred to the commonly used normal range. The latter term implies that it is the range of test results from all “normal” animals. In reality, a low percentage of apparently healthy “normal” animals will have test values outside the normal range, and, depending on the test, many abnormal (diseased) animals may have values within the normal range. Healthy animals may have transient increases or decreases in laboratory test results based on changes in environment, emotional status, diet, and so on, and a low percentage of healthy animals simply have values above or below the general population of healthy animals. Apparently healthy animals may also have occult disease that causes one or more abnormal laboratory test results, and sample collection, handling, and laboratory errors can result in artifactually high or low values from healthy animals. Consequently it is not appropriate simply to use the actual range of values from all apparently healthy animals assayed. To develop useful reference intervals, one must decide which animals will be assayed, how many animals need to be analyzed, and what method or methods will be used to remove high or low outliers that would otherwise render the interval of limited value as a reference.
Selection of Reference Animals
Specific reference intervals are needed for each species of animal being tested. Less often, a different reference interval is needed for an analyte from a specific breed of animal (e.g., hematocrit values in greyhound dogs are higher than those in most other dog breeds). Values may vary with the age of the animal, with major changes occurring prior to puberty (e.g., 3-week-old pups have lower hematocrits than adults). Consequently some analytes need different reference intervals for different age groups. Some analytes also vary with sex, pregnancy, emotional state, and activity level. The types of animals sampled and environmental conditions present during the establishment of a reference interval should be defined, along with the methods and equipment used, so that the user can make appropriate evaluations. Ideally, a reference interval should be established using a population of healthy animals with a composition (age, breed, sex, diet, etc.) like the population of ill animals being evaluated. Homogeneous populations generally have more narrow reference intervals than heterogenous populations. Establishing a reference interval for a blood analyte using a group of male foxhound dogs housed in a research colony, fed the same diet, and conditioned to phlebotomies would likely result in reference intervals too narrow for the population of dogs examined in a typical small-animal practice. Reference intervals are generally established for a species by utilizing samples from apparently healthy adult animals of both sexes and various breeds. Monogastric animals should have been fasted overnight prior to blood sample collection.
Determination of Reference Intervals
Specific reference intervals should be established for each instrument and each test evaluated. Ideally, each animal would have its own reference intervals established by multiple assays done over time when the animal was healthy. In some instances, limited numbers of baseline values are available for an animal that can be helpful, but rarely are analytes measured often enough to establish an accurate reference interval for an individual animal. Consequently population-based reference intervals are used.
When the frequency diagram of test results from a healthy population is examined, many analytes exhibit a Gaussian or bell-shaped distribution (Fig. 1-1 ). When a Gaussian distribution is present, a minimum of 40 individuals (100 or more is preferred) should be assayed for statistical validity.2 In this case, the reference interval is calculated using the mean ±2 standard deviations (SD). This interval approximates the 95% confidence interval. In other words, about 95% of healthy animals have test values within this reference interval, with about 2.5% of healthy animals having values above and about 2.5% of healthy animals values below the reference interval. A common mistake made by novices is to calculate the reference interval from the mean ±1 SD. When this is done, about 32% of healthy animals will have values outside the calculated interval. If less than 40 healthy animals are available, the upper and lower values measured should be used to create an estimated reference interval.5
FIGURE 1-1.

Frequency diagram of a hypothetical plasma analyte with Gaussian distribution. The central (tallest) vertical line denotes the mean. Each additional vertical line represents one standard deviation (SD) from the adjacent vertical line. The reference interval calculated using mean ±2 SD (21 ± 4 mmol/L) is 17 to 25 mmol/L.
Some analytes do not exhibit a Gaussian distribution. Most commonly there is a skew toward the higher values. The use of mean ±2 SD to calculate reference intervals results in inappropriate reference intervals for skewed populations, as shown in Figure 1-2 . Data may be manipulated (e.g., log or square root transformation) so that the frequency distribution of the transformed data approximates a Gaussian distribution. The boundaries are determined as before and results are retransformed to determine the reference interval. Alternatively, one can use percentiles to determine upper and lower limits, especially if large numbers of healthy animals are evaluated. Values are listed in ascending order. The lower limit is determined by the formula (n + 1) × 0.025, and the upper limit is determined by the formula (n + 1) × 0.975, where n = the number of normal animals assayed.2 If 119 animals were used, the value for the 3rd lowest animal would be used as the lower limit and the value from the 117th animal (3rd from the top) would be used as the upper limit.
FIGURE 1-2.
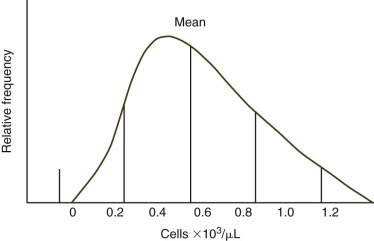
Frequency diagram of hypothetical absolute blood cell counts with a skewed population. The central (tallest) vertical line denotes the mean. Each additional vertical line represents one standard deviation (SD) from the adjacent vertical line. The use of mean ±2 SD to calculate the reference interval is inappropriate, as demonstrated by the lower limit being an impossible negative value.
Interpretation of Test Results Relative to Reference Intervals
The common usage of the 95% confidence interval to establish reference intervals means that 5% of healthy animals will be reported as abnormal for a given test. When multiple tests are done in laboratory medicine profiles, the probability of at least one test being abnormal increases with the number of tests done. For example, there is a 64% chance that at least one abnormal test result will be obtained when 20 analytes are measured from a healthy animal.6 The degree to which a test result is above or below the reference interval is generally important in deciding whether a high or low value should be taken seriously.
Use of Published Reference Intervals
Routine hematology test results are usually similar between laboratories; consequently published reference intervals for values such as total leukocyte counts and hematocrits are often used to interpret results from a species (e.g., wallaby) when reference values have not been established in the laboratory conducting the test. Hematology indices such as the red cell distribution width (RDW) vary more between laboratories, making the use of published reference intervals less acceptable.
The units used in reporting values can vary by laboratory and a conversion factor may be needed to compare a measured value to a published reference interval. For example, blood iron might be reported as 100 µg/dL or 18 µmol/L. Most U.S. laboratories continue to use conventional units, such as mg/dL; Canadian and European laboratories use the International System of Units (SI units), such as mmol/L. Where possible, moles are used rather than weight (e.g., mg) for SI units. This cannot be done for analytes, such as serum protein concentration, where the molecular weight is variable and/or unknown. For enzymes, an SI enzyme unit is defined as 1 µmol/min of substrate utilized or product formed. SI units are reported per liter.
For many wild animal species, reference intervals may not be published for some or all tests. The simultaneous measurement of a healthy “control” animal from the same species, preferably a cohort, can be used as a rough guideline reference value and therefore can aid interpretation of the patient's results.
Sensitivity and Specificity of Tests
Ideally analyte values obtained from a healthy animal population would not overlap with values obtained form a diseased animal population. Unfortunately there is almost always some overlap in the distribution of individual analyte test results between the two groups (Fig. 1-3 ). When the disease being considered has a major impact on an analyte, little overlap in values will occur; however, extensive overlap occurs if the analyte concentration is minimally altered by the disease being considered. True positives (TPs) are positive test results from animals with the disease for which they are being tested, false positives (FPs) are positive test results for animals without the disease for which they are being tested (Fig. 1-4 ), true negatives (TNs) are negative test results from animals without the disease for which they are being tested, and false negatives (FNs) are negative test results from animals with the disease for which they are being tested. As can be seen in Figure 1-4, if one increases the reference interval of the healthy population in order to minimize the FPs, the number of FNs increases.
FIGURE 1-3.

Overlapping Gaussian distributions of a healthy dog population compared with a population of dogs with type 2 diabetes mellitus.
The figure is redrawn from Farver TB. Concepts of normality in clinical biochemistry. In: Kaneko JJ, Harvey JW, Bruss ML, eds. Clinical Biochemistry of Domestic Animals. 6th ed. San Diego: Academic Press; 2008:1-25.
FIGURE 1-4.
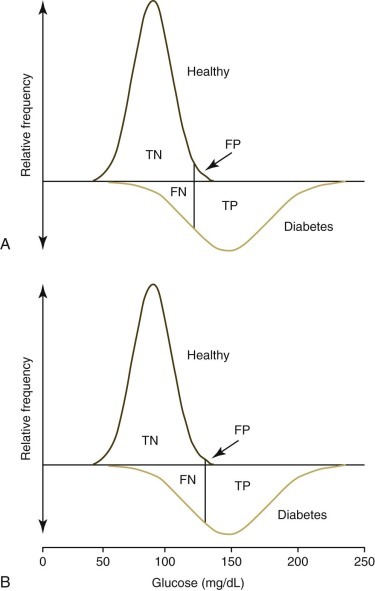
Frequency diagrams of a healthy dog population compared with a population of dogs with type 2 diabetes mellitus. Graphs are redrawn from Figure 1-3 to demonstrate true-negative (TN), false-negative (FN), true-positive (TP), and false-positive (FP) values used to calculate sensitivity, specificity, and predictive values. The top graph (A) demonstrates the effect of using the mean +2 standard deviations (SD) to set the upper limit of the reference interval. The lower graph (B) demonstrates the effect of using the mean +3 SD to set the upper limit. The number of FP tests are reduced but the number of FN tests are increased by using the higher reference limit.
The figure is redrawn from Farver TB. Concepts of normality in clinical biochemistry. In: Kaneko JJ, Harvey JW, Bruss ML, eds. Clinical Biochemistry of Domestic Animals. 6th ed. San Diego: Academic Press; 2008:1-25.
A clinical test should be safe and practical, and should accurately indicate the presence or absence of a specific disease or pathology. Sensitivity, specificity, and predictive value constitute measures of a test's utility for ruling in or ruling out a given disease.
Sensitivity is the likelihood of a positive or abnormal test result occurring in animals with the disease being considered (Box 1-1 ). For example, if 23 of 28 cats with feline infectious peritonitis (FIP) are recognized to have a low absolute lymphocyte count in blood, the sensitivity of lymphopenia as a diagnostic test for cats with FIP is calculated to be 82% (Table 1-1, Table 1-2 ).7
Box 1-1. Formulas for the Calculation of Sensitivity, Specificity, Predictive Value of a Positive Test, Predictive Value of a Negative Test, and Prevalence.
TP, true positive (the number of animals with the disease being tested for that have a positive test result); FP, false positive (the number of animals without the disease being tested for that have a positive test result); TN, true negative (the number of animals without the disease being tested for that have a negative test result); and FN, false negative (the number of animals with the disease being tested for that have a negative test result).
Table 1-1.
Test Results from the Evaluation of 224 Cats with a History and Clinical Signs Consistent with Feline Infectious Peritonitis (FIP) Resulting in the Inclusion of FIP in the List of Differential Diagnosesa
| Test | NUMBER OF CATS AFFECTED |
||
|---|---|---|---|
| Have FIP (N = 28) | Do Not Have FIP (N = 196) | Total Cats (N = 224) | |
| Lymphopenia (<1.5 x 10³ cells/µL) | 23 | 43 | 66 |
| Monocytosis (>0.9 x 10³ cells/µL) | 2 | 43 | 45 |
| Hyperglobulinemia (>5.1 g/dL) | 11 | 7 | 18 |
| Coronavirus titer positive | 22 | 84 | 106 |
N, Number of cats.
Data from Sparkes AH, Gruffydd-Jones TJ, Harbour DA. An appraisal of the value of laboratory tests in the diagnosis of feline infectious peritonitis. J Am Anim Hosp Assoc. 1994;30:345-350.
Table 1-2.
| Test | NUMBER OF CATS AFFECTED |
||
|---|---|---|---|
| Have FIP (N = 28) | Do Not Have FIP (N = 196) | Total Cats (N = 224) | |
| Lymphopenia | 23 | 43 | 66 |
| True positive | False positive | Total positive | |
| No lymphopenia | 5 | 153 | 158 |
| False negative | True negative | Total negative | |
N, Number of cats.
Cats with a history and clinical signs consistent with FIP were evaluated, resulting in FIP being included in the list of differential diagnoses. Lymphopenia was defined as <1.5 x 10³ lymphocytes per microliter of blood.
Data from Sparkes AH, Gruffydd-Jones TJ, Harbour DA. An appraisal of the value of laboratory tests in the diagnosis of feline infectious peritonitis. J Am Anim Hosp Assoc. 1994;30:345-350.
Specificity is the likelihood of obtaining a negative or normal test result in nondiseased animals—that is, animals without the particular disease under consideration. In other words, specificity represents the proportion of animals without the disease in question that have normal tests. Specificity may be calculated in two distinctly different ways, either by assuming that all of the nondiseased animals are healthy or by assuming that although nondiseased animals do not have the particular disease for which the analysis is being performed, they may have other diseases.
Determining the specificity of a test in a group of healthy animals is of little value because reference intervals are generally established to include 95% of the total population of healthy animals, with 2.5% of healthy animals having values above and 2.5% of healthy animals having values below the reference interval. The specificity of a test is much more useful when the population of animals typically evaluated in a veterinary hospital setting is being used.1 In this approach, the “nondiseased” group includes not only healthy animals presented for elective procedures but also animals with diseases other than the disease being considered.
Predictive Values and Disease Prevalence
Predictive values demonstrate how well a test performs in a given population. In contrast to sensitivity determinations (which are made using only a population of animals with the disease in question) and specificity determinations (which are made using only a population of animals without the disease under consideration), predictive value determinations are made from populations that contain animal both with and without the disease in question.
The predictive value of a positive test (PVPT) considers only animals in the population being studied that have a positive test result and determines what percentage of animals actually have the disease being considered (see Box 1-1). It answers the question “How likely is it that an animal with a positive test will actually have the disease being considered?” Based on the selected population of cats presented in Table 1-1, Table 1-2, there is a 23/66 or 35% chance that a cat with lymphopenia in this population will have FIP.7
The predictive value of a negative test (PVNT) considers only animals in the population being studied that have a negative or normal test result and determines what percentage of animals with negative test results do not have the disease being considered (see Box 1-1). It answers the question “How likely is that an animal with a negative or normal test result will be free of the disease being considered?” Based on the selected population of cats presented in Table 1-2, there is a 153/158 or 97% chance that a cat with a normal or increased blood lymphocyte count will not have FIP.
The prevalence of a disease in a population is simply the percentage of animals in a given population that have a certain disease (see Box 1-1). The prevalence of FIP in the selected population presented in Table 1-1 is 28/224 or 12.5%. The prevalence of a disease affects the predictive values of a test used to diagnose the disease but not its sensitivity or specificity. For most tests, the PVPT will be low and the PVNT will be high if the disease has a low prevalence in the population being studied. The PVPT will be low because low prevalence magnifies the number of false-positive results—that is, most positive test results are false positives because few animals actually have the disease (see Box 1-1). The exception would be a test where false-positive results occur infrequently (e.g., polymerase chain reaction tests for specific infectious agents or inherited blood cell defects). The PVNT will be high because few false-negative results are present in a population when the disease prevalence is low.
To improve diagnostic accuracy, the prevalence (likelihood) of the disease being considered can be increased by using the history, physical examination, and adjunctive diagnostic tests to restrict the population, as described for cats in Table 1-1. The prevalence of FIP in the general cat population is much lower than 12.5%. By ruling out one or more diseases that can give the same positive test result as the disease being considered, a clinician decreases the size of the population being studied, thereby increasing the prevalence of the disease in the population and increasing the positive predictive value of the test for the disease being considered.
Laboratory tests are used to help rule in or rule out a specific disease. When significant hazards are associated with treatment (e.g., amputation or high-risk chemotherapy) or euthanasia is being considered, it is necessary to be as certain as possible that the disease is actually present. Consequently tests with high positive predictive values are needed for a rule-in strategy. When the penalty for missing a diagnosis is high, as with a disease for which therapy is effective if begun quickly, tests with high negative predictive values are theoretically important as a rule-out strategy. A normal test result by virtue of its high negative predictive value would suggest that the disease is not present. Unfortunately many diseases have low prevalence, which by itself can result in a high negative predictive value. The best evidence for ruling out a disease is finding a negative test result for an assay that has a high sensitivity for recognizing the disease. Based on the selected population of cats presented in Table 1-1, Table 1-2, finding a normal or increased blood lymphocyte count is more reliable for ruling out FIP than is finding a low lymphocyte count for making a diagnosis of FIP.
Information is generally available concerning the sensitivity of routine tests for common diseases, but information is often lacking concerning all diseases that may have a positive test result and the frequency of these diseases in the population being evaluated. Consequently, the specificity of a test can vary when populations containing animals with other diseases are analyzed. PVPTs and PVNTs also vary considerably depending on the population analyzed. Although accurate values are not usually available for PVPTs and PVNTs, clinicians use their knowledge and experience, combined with the principles outlined above, to make informed judgments concerning the likelihood that a disease can be ruled in or ruled out of the differential diagnosis. These decisions are seldom based on a single test result; instead, information in the history is considered along with the clinical signs and results of the physical examination, diagnostic imaging, and other laboratory tests. The likelihood that a disease will be present increases if several findings are supportive of the diagnosis. For example, in the FIP study discussed above, the PVPT was 35% for cats with lymphopenia, 77% for cats with lymphopenia and hyperglobulinemia, and 89% for cats with lymphopenia, hyperglobulinemia, and a positive coronavirus titer. The PVNT increased from 97% when lymphopenia alone was absent to 99% when all three findings were absent. Minimal change occurs in the PVNT because the relatively low disease prevalence in the population is a major contributing factor to the high negative PVNT. This contribution is most clearly demonstrated by looking at blood monocyte data in the FIP study presented in Table 1-1. Only 7% of FIP cats have a monocytosis (sensitivity), and the PVPT for monocytosis is only 4%, yet the PVNT for a cat lacking a monocytosis is 88%.
Cutoff Values
The PVPT may be increased by using a cutoff value above or below the standard reference interval, depending on whether the disease under consideration results in an increase or a decrease in the analyte being measured. For example, low mean cell volume (MCV) is a diagnostic test suggestive of chronic iron deficiency in dogs. If we use 64 fL as the lower limit of the reference interval to calculate its positive predictive value, the value would not be remarkably high because there are various other relatively common disorders that can result in low MCVs in dogs, most notably inflammatory conditions and portosystemic shunts. However, it is recognized that the other causes of microcytosis rarely result in MCV values below 52 fL. Consequently, if a dog has a MCV below 52 fL, chronic iron deficiency anemia is highly likely and the PVPT using this cutoff value would approach 100%. However, 52 fL is not routinely used as a cutoff value for a positive test because many cases of chronic iron deficiency would be missed. Nonetheless, it is important to realize that dogs with especially low MCV values almost certainly have chronic iron deficiency anemia.
The effects of varying the cutoff value of a test on sensitivity, specificity, and predictive values are demonstrated in Table 1-3 , where plasma fibrinogen concentration was evaluated as a diagnostic test for Rhodococcus equi pneumonia in 165 foals from a single farm.3 It is important to recognize that fibrinogen is an acute-phase protein that often increases in association with various causes of inflammation in horses and that the heat precipitation assay used to measure fibrinogen (while easily performed and clinically useful) is relatively imprecise. As the cutoff value for plasma fibrinogen concentration is increased, the specificity and PVPT increase, but the sensitivity and PVNT decrease (see Table 1-3). Results from this study also demonstrate that the PVPT increases and the PVNT decreases as the prevalence of disease in a population increases. In choosing the most appropriate cutoff value for a test, one must consider a number of factors including sensitivity and specificity of the test, prevalence of disease in the population being tested, and consequences of false-positive and false-negative tests. In the example above, failure to identify an infected foal (false-negative test) might result in the debilitation or death of the foal. Conversely, the treatment of healthy foals based on false-positive test findings could result in unnecessary financial losses and potential injury to healthy foals as a result of the adverse side effects of antimicrobial therapy.
Table 1-3.
Sensitivity, Specificity, and Predictive Values of Plasma Fibrinogen Concentrations at Selected Cutoff Values for the Early Identification of Foals with Rhodococcus equi Pneumonia, Assuming Two Different Prevalences of Diseasea
| PREDICTIVE VALUES |
||||||
|---|---|---|---|---|---|---|
| PREVALENCE 10% |
PREVALENCE 40% |
|||||
| Cutoff value (mg/dL) | Sensitivity (%) | Specificity (%) | PVPT (%) | PVNT (%) | PVPT (%) | PVNT (%) |
| 300 | 100 | 6 | 11 | 100 | 42 | 100 |
| 400 | 91 | 51 | 17 | 98 | 55 | 89 |
| 500 | 71 | 68 | 20 | 96 | 60 | 78 |
| 600 | 38 | 96 | 51 | 93 | 86 | 70 |
| 700 | 29 | 97 | 51 | 92 | 86 | 67 |
| 800 | 12 | 100 | 100 | 91 | 100 | 63 |
PVPT, Predictive value of a positive test; PVNT, predictive value of a negative test.
Data from Giguère S, Hernandez J, Gaskin J, Miller C, Bowan JL. Evaluation of white blood cell concentration, plasma fibrinogen concentration, and an agar gel immunodiffusion test for the early identification of foals with Rhodococcus equi pneumonia. J Am Vet Med Assoc. 2003;222:775-781.
Accuracy Versus Precision
The accuracy of an analytical procedure is determined by how closely the result approaches the true value of the analyte being measured. An accurate test is one where the average of several assay results is close to the true value (Fig. 1-5 ). Analytic procedures with low accuracy are said to have a negative bias if results are below the true value or a positive bias if results are above the true value.
FIGURE 1-5.

Plots comparing test results of triplicate assays of three standards (y-axis) to the known values of the standards (x-axis). The top plot is accurate with good precision. The bottom plot has good precision but is inaccurate.
The precision of a test reflects how reproducible the test results are when the assay is replicated. Precision is independent of accuracy (Fig. 1-6 ); consequently test results can be highly reproducible but erroneous (see Fig. 1-5, lower plot). Precision or, more accurately, the amount of imprecision present in an assay, is determined by calculating the coefficient of variation (CV) for repeated measurements made on a single sample. The CV is the standard deviation (SD) of the repeated measurements expressed as a percent of the mean of the repeated measurements (SD/mean × 100). The CV indicates the amount of random error (imprecision) that is present in an assay. A high CV value (e.g., more than 10%) indicates that an assay lacks precision. A low CV value (e.g., less than 5%) indicates that assay results are reproducible, varying little with repeated measurement. The degree of imprecision of an assay can also be measured over time intervals to assess within-run, between-run, or between-day variation.
FIGURE 1-6.

Plots comparing test results of four replicate assays of three standards (y-axis) to the known values of the standards (x-axis). The top plot is accurate but imprecise. The bottom plot is inaccurate and imprecise.
Automated versus Manual Methods
As can be seen in FIGURE 1-7, FIGURE 1-8 , manual leukocyte and platelet counts are less precise (CV 15% and 13%, respectively) than automated leukocyte and platelet counts (CV 2% and 4%, respectively). These values do not indicate whether manual or automated methods are more accurate. In fact, the mean manual platelet count is probably more accurate (more near the true platelet count) than the mean automated platelet count because platelets in small platelet clumps can be visualized and counted separately in a hemacytometer chamber but would be counted as one platelet or not counted at all in an automated cell counter.
FIGURE 1-7.

Individual plots of total leukocyte counts performed 20 times each using a manual method and an automated method on the same canine blood sample. The manual method utilized 20 separate dilutions (Unopette 365855, Becton Dickinson Co., Franklin Lakes, NJ), followed by the counting of all leukocytes in 1 µL of 1/100 diluted blood in a hemacytometer chamber. A Cell-Dyn 3500 (Abbott Laboratories, North Chicago, IL) calibrated for canine blood was used to perform the automated cell counts. The mean and coefficient of variation (CV) for the manual counts were 7.1 × 10³/µL and 15% respectively. The mean and CV for the automated counts were 6.7 × 10³/µL and 2% respectively.
FIGURE 1-8.

Individual plots of platelet counts performed 20 times each using a manual method and an automated method on the same canine blood sample. The manual method utilized 20 separate dilutions (Unopette 365855, Becton Dickinson Co., Franklin Lakes, NJ), followed by the counting of all platelets in 1/25 µL of 1/100 diluted blood in a hemacytometer chamber. A Cell-Dyn 3500 (Abbott Laboratories, North Chicago, IL) calibrated for canine blood was used to perform the automated cell counts. The mean and coefficient of variation (CV) for the manual counts were 240 × 103/µL and 13% respectively. The mean and CV for the automated counts were 219 × 103/µL and 4% respectively.
For manual differential leukocyte counts, the CV varies with the percentage of a given leukocyte type present in the blood film and the total number of leukocytes included in the differential leukocyte count. For example, 100 cell differential counts were performed by a single technologist on each of 80 stained coverslip blood films from a dog with a mild basophilia. CVs were calculated from results of 20 randomly selected blood films (100 cells per differential). CVs were also calculated from results from 20 pairs of randomly selected slides (200 cells per differential). Last, CVs were calculated from results from 20 quads of randomly selected slides (400 cells per differential). As expected, the CVs for leukocyte types that were numerous (e.g., neutrophils) were much lower than CVs for leukocyte types that were present in low numbers (e.g., basophils), and CVs decreased as the total number of cells counted in the differential increased (FIGURE 1-9, FIGURE 1-10 ). The CVs for each of the five leukocyte types from this dog were plotted versus the mean percentage of each leukocyte type for 100-, 200-, and 400-cell manual differential counts and compared with a like plot with data determined by performing 20 automated differential counts on blood from a single dog using an Advia 120 (Siemens Healthcare Diagnostics, Inc., Tarrytown, NY) hematology analyzer (Fig. 1-11 ). Automated hematology analyzers have lower CVs for each percentage of leukocyte type present because they examine thousands of leukocytes (assuming a normal leukocyte count) in performing the differential leukocyte count. However, they are not always more accurate. The inability to correctly identify certain cell types (especially basophils), abnormal cell morphology, or abnormal cell types can lead to the misclassifications of cell types. For example, the Advia 120 failed to identify any basophils in blood from a cat with 39% basophils or a dog with 14% basophils identified on manual differential leukocyte counts.
FIGURE 1-9.

Box plots of neutrophil percentages and coefficients of variation (CVs) from manual differential counts from a single dog with 55.4% neutrophils. Values represent the results of 20 differential leukocyte counts each of 100, 200, and 400 nucleated cells. A median line is shown. Boxes include 25th to 75th percentiles and error bars include 10th to 90th percentiles.
FIGURE 1-10.

Box plots of neutrophil percentages and coefficients of variation (CVs) from manual differential counts from a single dog with 1.4% basophils. Values represent the results of 20 differential leukocyte counts each of 100, 200, and 400 nucleated cells. A median line is shown. Boxes include 25th to 75th percentiles and error bars include 10th to 90th percentiles.
FIGURE 1-11.

Mean coefficient of variation (CV) values for each of the five leukocyte types from a single dog are plotted versus the mean differential counts of each leukocyte type. Mean values were determined from 20 differential leukocyte counts each of 100, 200, and 400 nucleated cells. A like plot with data determined by performing 20 automated differential counts on blood from a single dog using an Advia 120 hematology analyzer is included for comparison.
Critical Difference
The CV of an assay affects how the results are interpreted, especially if an assay is being repeated to determine whether a treatment is effective. For example, if the total leukocyte count for a dog is 4600/µL before treatment and 5800/µL after treatment, does this represent a real improvement or might it reflect imprecision in the measurement of the total leukocyte count? An additional confounding variable in this example is the biological variability of the animal itself. Jensen et al.4 calculated the analytical CV for an automated total leukocyte count in healthy laboratory beagles to be 3.7%, while the CV for repeated total leukocyte counts from individual beagles (within dog CV) was 12.1%.4 From these numbers, a critical difference of 35% was calculated. This means that the total leukocyte count would have to increase by more than 35% before the therapy could be assumed to have an influence on this analyte. In the example above, the automated total leukocyte count would have to exceed 4600/µL × 1.35, or 6200/µL, before a therapeutic effect might be assumed. A considerably greater difference would be required if total leukocyte counts were done using a manual method because of its higher analytical CV. A greater critical difference might also have been calculated in the above example had client-owned animals been used for this study rather than laboratory animals, because it is likely that the biological variation would be higher in client-owned animals that were not accustomed to the phlebotomy procedure, the individuals handling them, or the environment in which the phlebotomy was done.
Unfortunately, critical difference measurements have been done for few analytes in veterinary medicine, and values will vary depending on methods and instruments used and animal populations evaluated. Nonetheless, clinicians develop knowledge and intuition through study and experience that can help them to make informed judgments concerning the importance of changes in laboratory data.
References
- 1.Braun JP, Concordet D, Lyazrhi M. Overestimation of the predictive value of positives by the usual calculations of the specificity of diagnostic tests. Vet Res Commun. 2000;24:17–24. doi: 10.1023/a:1006369120260. [DOI] [PubMed] [Google Scholar]
- 2.Farver TB. Concepts of normality in clinical biochemistry. In: Kaneko JJ, Harvey JW, Bruss ML, editors. Clinical Biochemistry of Domestic Animals. 6th ed. Academic Press; San Diego: 2008. pp. 1–25. [Google Scholar]
- 3.Giguère S, Hernandez J, Gaskin J. Evaluation of white blood cell concentration, plasma fibrinogen concentration, and an agar gel immunodiffusion test for the early identification of foal with Rhodococcus equi pneumonia. J Am Vet Med Assoc. 2003;222:775–781. doi: 10.2460/javma.2003.222.775. [DOI] [PubMed] [Google Scholar]
- 4.Jensen AL, Iversen L, Petersen TK. Study on biologic variability of haematological components in dogs. Comp Haematol Int. 1998;8:202–204. [Google Scholar]
- 5.Lumsden JH. Reference values. In: Feldman BF, Zinkl JG, Jain NC, editors. Schalm's Veterinary Hematology. 5th ed. Lippincott Williams & Wilkins; Philadelphia: 2000. pp. 12–15. [Google Scholar]
- 6.Marshall WJ. The interpretation of biochemical data. In: Marshall WJ, Bangert SK, editors. Clinical Biochemistry. Metabolic and Clinical Aspects. 2nd ed. Churchill Livingstone Elsevier; New York: 2008. pp. 17–27. [Google Scholar]
- 7.Sparkes AH, Gruffydd-Jones TJ, Harbour DA. An appraisal of the value of laboratory tests in the diagnosis of feline infectious peritonitis. J Am Anim Hosp Assoc. 1994;30:345–350. [Google Scholar]