
Figure 7. 3D chromatin misfolding at diabetes-associated loci in NOD mice is mediated in cis and is linked to human T1D.
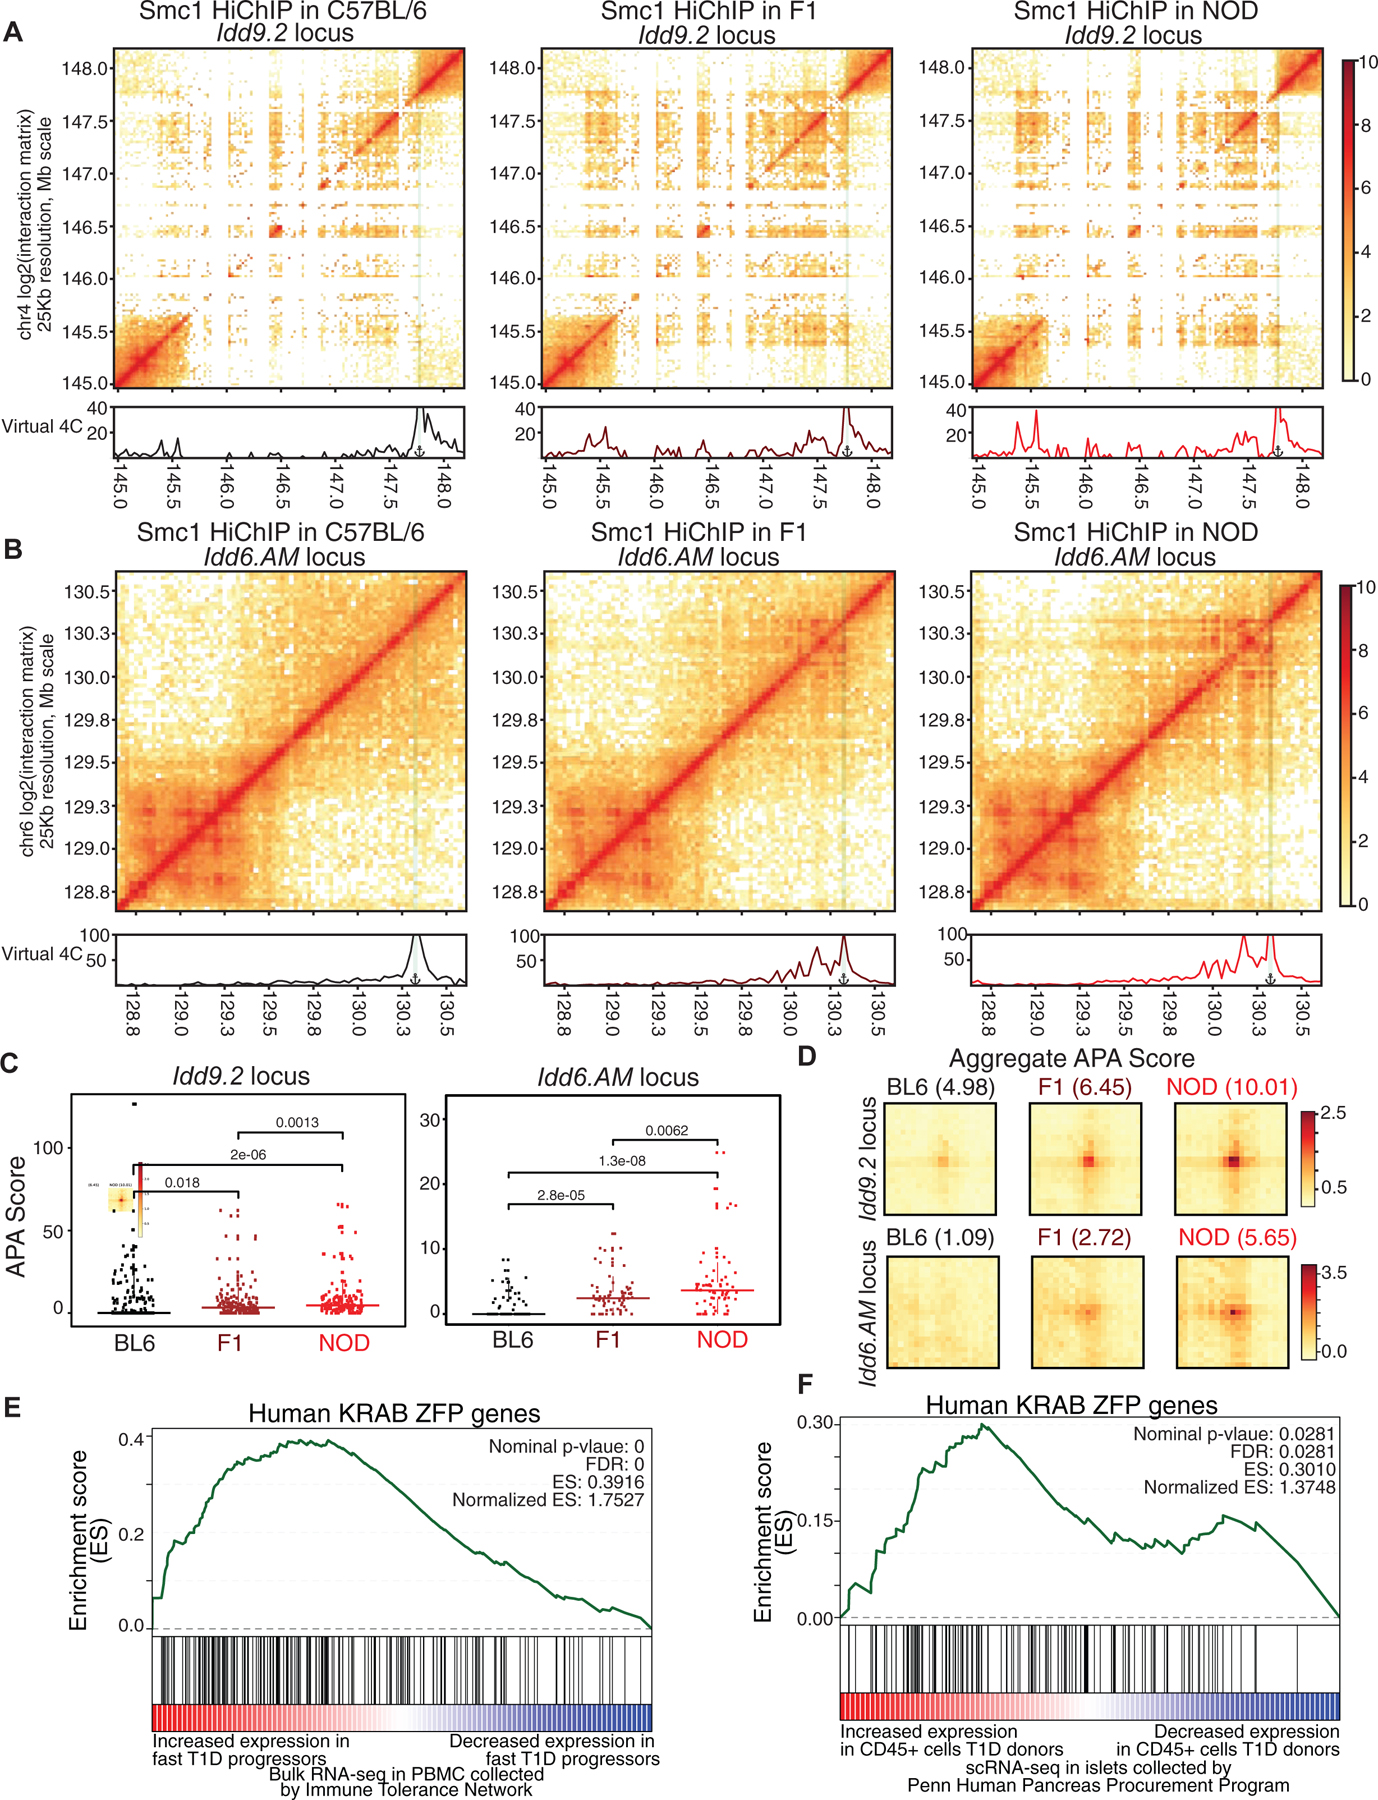
(A, B) Contact matrices based on Smc1 HiChIP for the region harboring Idd9.2 (A) and Idd6.AM (B) in C57BL/6 (left), NOD (right) and F1 offspring (middle). Virtual 4C plot quantifies the connections of the highlighted anchor to other regions.
(C) APA score for each individual Smc1 HiChIP loop was used to quantify the strength in the two NOD-specific hyperconnected regions. Pairwise comparisons were done with Wilcoxon rank sum test.
(D) APA scores for all of the Smc1 HiChIP loops were used to quantify the strength of all loops in C57BL/6, NOD and F1 at the two hyperconnected regions.
The GSEA analysis for KRAB-ZFP gene set in genes with increased expression in fast progressors (E) or in CD45+ cells in islets of T1D deceased donors collected by HPAP (F).