Abstract
Opioid addiction in the United States has come to national attention as opioid overdose (OD) related deaths have risen at alarming rates. Combating opioid epidemic becomes a high priority for not only governments but also healthcare providers. This depends on critical knowledge to understand the risk of opioid overdose of patients. In this paper, we present our work on building machine learning based prediction models to predict opioid overdose of patients based on the history of patients’ electronic health records (EHR). We performed two studies using New York State claims data (SPARCS) with 440,000 patients and Cerner’s Health Facts database with 110,000 patients. Our experiments demonstrated that EHR based prediction can achieve best recall with random forest method (precision: 95.3%, recall: 85.7%, F1 score: 90.3%), best precision with deep learning (precision: 99.2%, recall: 77.8%, F1 score: 87.2%). We also discovered that clinical events are among critical features for the predictions.
Introduction
The United States is experiencing an epidemic of opioid related deaths due to the misuse and abuse of opioids, including both prescribed pain relievers and illegal drugs such as heroin and synthetic fentanyl. According to Han1, 91.8 million (37.8%) civilian non-institutionalized adults in the US used prescription opioids in 2015. Among them, 11.5 million (4.7%) misused them and 1.9 million (0.8%) had a use disorder. Between 2005 and 2014 OD-related hospitalizations and emergency room visits increased 64% and 99% respectively2. According to Scholl L3, drug overdoses resulted in 70,237 deaths during 2017, and 47,600 (67.8%) of them involved opioids.
Improving current clinical practices can potentially reduce the risks of opioid misuse or overdose. For example, CDC4 has provided recommendations for prescribing opioids for chronic pain care on opioid prescription for primary care clinicians. The joint commission also provided new and revised pain assessment and management standards for accredited hospitals. Clinical decision support systems (CDSS) can provide medical advice through integrating a patient’s EHR data for inference, which holds high potential for improving clinical decisions and clinical practices. For instance, using EHR data to help physicians provide better care in opioid use disorder is proposed5, which depends on understanding the past history of patients and using pre-defined rules for the decision support. It is particularly important to predict and identify patients at risk for opioid toxicity in time for optimal clinical interventions, such as reducing opioid dosage or suggesting alternative options for chronic pain management.
CDSS is made possible with the adoption of EHR, which has increased dramatically with the introduction of the Health Information Technology for Economic and Clinical Health (HITECH) Act of 20096. Besides EHR data managed by healthcare providers, large scale EHR data are also made available through government open data initiatives, such as claims data from the New York State Statewide Planning and Research Cooperative System (SPARCS)7. In addition, commercial EHR vendors often provide large scale de-identified EHR data for research purposes; for example, Cerner’s Health Facts is a large multi-institutional de-identified database derived from EHRs and administrative systems.
Traditional machine learning has been widely explored and discussed in previous work8,9,10,11. Recently, deep learning methods are gaining popularity in EHR based predictive modeling. For instance, Rajkomar et al. performed a large scale deep learning-based study with high prediction accuracy using EHR data in multiple medical events prediction12. Another study employed a fully connected deep neural network to suggest candidates for palliative care13. Recurrent neural networks (RNN) are also applied to take advantage of patient’s background information for prediction of clinical events12,14,15,16. For example, one study explored the application of RNN for chronic disease prediction using medical notes17. Our recent work has applied fully connected networks for predicting diseases and improving coding18, 19. For opioid related application, Che20 followed a deep learning based method to classify opioid patients into opioid- dependent and long-term users. Ellis used machine learning classifiers to predict the likelihood of patients having substance dependence 21.
In this paper, we built multiple prediction models for predicting the risk of opioid poisoning in the future using patients’ history from claims data and EHR data respectively, and examined most important features for such predictions. We leveraged large scale databases to identify features that are commonly associated with opioid poisoning, while minimizing irrelevant features. We used the medical records of a patient for the prediction, including demographic information and past medical history including diagnoses, laboratory results, medications and related clinical events. Both traditional machine learning algorithms and deep learning methods were studied in our research. Our results demonstrated that with comprehensive EHR data such as Health Facts, our models provided highly promising prediction results: we were able to generate a best recall using Random Forest based method (precision: 95.3%, recall: 85.7%, F1: 90.3%, AUC: 95.1%), and best precision and Area Under the ROC Curve (AUC) with Neural Networks (precision: 99.2%, recall: 77.8%, F1: 87.2%, AUC: 95.4%). We also discovered that clinical event features play critical roles in the prediction.
Methods
Data Sources
We extracted inpatient EHR data from two clinical databases, SPARCS and Health Facts, as our data sources.
SPARCS Inpatient Data. We used hospital discharge data from New York State SPARCS7 database. New York State requires any New York State healthcare facility (Article 28 licensed) certified to provide inpatient services, ambulatory surgery services, emergency department services or outpatient services to submit data to SPARCS. The purpose of SPARCS is to create a statewide dataset for providing high quality medical care by serving as an information source.
Cerner’s Health Facts Inpatient Data. We also utilized Cerner’s Health Facts as another data source for our studies. Health Facts includes de-identified EHR data from over 600 participating Cerner client hospitals and clinics in the United States. In addition to encounters, diagnoses, procedures and patients’ demographics that are typically available in claims data, Health Facts also includes medication dosage and administration information, vital signs, laboratory test orders and results, surgical case information, other clinical observations, and health systems attributes22.
Diagnosis Codes for Data Extraction
All patients were classified into two groups, namely opioid overdose patients and other patients. Opioid overdose patients are defined as those who received at least one opioid related diagnosis code in their medical records. For those patients who have not been diagnosed with those codes, we took them as negative (non-opioid poisoned) patients.
The opioid poisoning related diagnosis codes are a collection of ICD-9 codes and ICD-10 codes (starting from October 1, 2015) for poisonings by opiates, opium, heroin, methadone, and other related narcotics. According to Moore23, the selected ICD-9 codes include 965.0 (Poisoning; Opiates and Related Narcotics), 965.00 (Poisoning; Opium/alkaloids, unspecified), 965.01 (Poisoning; Heroin), 965.02 (Poisoning; Methadone), 965.09 (Poisoning; Other opiates and related narcotics), E85.00 (Accidental Poisoning; Heroin), E85.01 (Accidental Poisoning; Methadone), 97.01 (Poisoning; Opiate antagonists) and E85.02 (Accidental Poisoning; Other Opiates and Related Narcotics), selected ICD-10 codes include T40.4 (Poisoning; other synthetic narcotics), T40.0 (Poisoning; opium), T40.1 (Poisoning; heroin), T40.2 (Poisoning; other opioids), T40.3 (Poisoning; methadone), T40.6 (Poisoning; narcotics), all of the codes and their descendant codes.
Although we don’t know if those negative patients will get opioid overdose in the future, we can take their status of opioid poisoning in the last visit as the future we want to predict. We can say that they have low risk of opioid poisoning in near future. Then we can use all the information of visits before last one as features for prediction.
Study Datasets
We built two independent study datasets for SPARCS and Health Facts respectively. We extracted records from January 13, 2005 to December 25, 2016 from SPARCS. We selected patients with at least one historic encounter before first opioid poisoned related diagnosis. We randomly chose 40,000 positive (opioid poisoned) patients. As the dataset would be highly imbalanced by having all non-opioid related patients, we chose 400,000 negative patients without a history of opioid poisoning.
For Health Facts database, we extracted records from January 8, 2000 to December 29, 2017. The selection of patients is similar to SPARCS data, but we further filtered patients and retained those who had at least one hospital visit with a clinical event record to help in evaluating the importance of clinical events. We used 110,000 patients from Health Facts, with 10,000 positive ones and 100,000 negative ones.
Features. Information useful to predict future opioid overdose includes diagnosis codes, procedure codes, medications, clinical events and demographic information. Since SPARCS and Health Facts are very different datasets, the features from each dataset vary significantly.
Diagnosis codes specify diseases, symptoms, poisoning for patients, and the history of diseases are critical information for predicting the future. Due to the large space of ICD codes, in order to prevent influence of too many unrelated or biased features, we filtered the diagnosis codes based on their frequency of co-occurrence with opioid poisoning, or their frequency appeared in the history of opioid poisoned patients. For reliability, we removed all opioid poisoning related diagnosis codes to prevent the model from directly getting results from the related codes. Diagnosis codes are used for both SPARCS and Health Facts datasets.
Procedure codes are specific surgical, medical or diagnostic interventions received by patients. Procedure codes are extracted for both datasets.
Medications are recorded by NDC codes, which is available in Health Facts dataset only. Preprocessing medication codes followed the same procedures as diagnosis codes and procedure codes. After filtering, only 10% of them are selected in the feature space. As dosage and duration of medications can be important, they are added to the features space using medication codes. For a specific medication, we measured the time period that the patient took it and the total dosage the patient took during the period, and had them added to the feature space. Quantity of dosage is measured in according unit in the database, to illustrate it, liquid dosage such as Toradol IV/VM (ketorolac) is measured in tubes, solid dosage such as Pepcid (famotidine) is measured in tablets, and duration is measured in minutes.
Clinical events are related symptoms, procedures, and personal situations that are not formally classified into any codes above, which is available in Heath Facts dataset only. Some of them are identified as clinical events in Health Facts, for instance, the pain level of patients, smoke history, height, weight, and travel information. Since 79.21% of hospitals in Health Facts have clinical event records, they can be helpful for most hospitals for prediction.
Demographic information such as age, gender and race are added to the feature space as well to improve the prediction24, the three features are included in both datasets. Sources of payments in SPARCS include payment type such as Self-Pay, Medicare, Medicaid, Insurance Company, among others. Since they are relevant to a patient’s social- economic status, we included it in the feature space in SPARCS dataset.
Feature Selection and Normalization
While there is a large number of codes from diagnosis, procedures and medications, many of them are not useful for prediction. Gathering all codes would also create a gigantic feature space that would then result in very slow training process. Therefore, we filtered the features to compress the feature space. For each feature category, we ranked all codes by their frequencies of occurrence in the history of patients with opioid poisoning. We kept the top 10% features in each category in the feature space. Note that Health Facts has more comprehensive features than SPARCS. The numbers of features selected are summarized in Table 1.
Table 1.
Summary of selected features for prediction in study datasets.
| Datasets | Category | # of Features | Description |
| SPARCS | Diagnosis | 2000 | ICD-9 and ICD-10 codes |
| Procedure | 2000 | ICD and CPT codes | |
| Demographic information | 4 | Race, gender, age and payment method | |
| Health Facts | Diagnosis | 2000 | ICD-9 and ICD-10 codes |
| Procedure | 1000 | ICD and CPT codes | |
| Demographic information | 3 | Race, gender and age | |
| Clinical Events | 900 | 500 events and numeric value for 400 of them | |
| Medication | 4500 | 1500 NDC codes with does quantity and duration |
For opioid poisoning patients, we used features from visits before they were diagnosed with opioid poisoning for the first time. We took advantage of all visits before the last one for non-opioid poisoning patients, features in all of those visits will be used for prediction. Their status of opioid poisoning in the last visit is the target we want to predict.
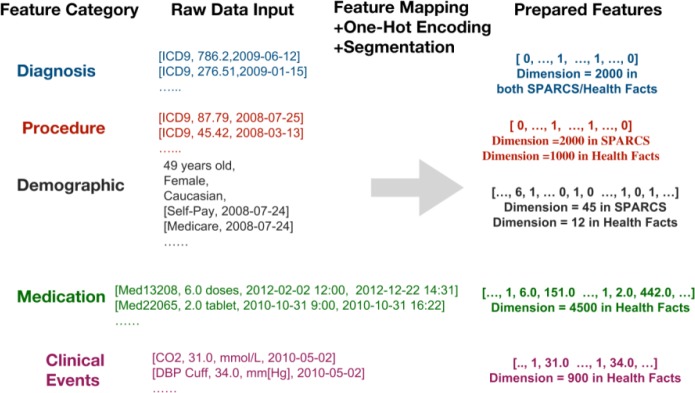
For ages, we segmented them into multiple age groups according to the ages of last visit: the first age group is 0-5, followed by every 10 years. This can accelerate the training process with minimal impact on the performance. For categorical features, for example, race and payment methods, One-Hot encoding method was applied to encode those features. Figure 1 illustrates how One-Hot Encoding is implemented for sources of payments. For Patient 1, a code [1,1,0,0,0,0] will be generated.
Figure 1.
An Illustration of the One-Hot Encoding on Sources of Payment.
We used a binary representation for diagnosis codes, procedure codes, medication codes and clinical events. If one of these features is detected from a patient’s history, the feature value is 1, otherwise the value is 0. Other features, such as medication dosage quantity and duration, clinical events of numeric values such as blood pressure, height, pain score, are assigned with numeric value and are measured in according units in the database, for instance, height measured in centimeters, blood pressure measured in mm[Hg]. The feature preprocessing is illustrated in Figure 2.
Figure 2.
Example of feature preprocessing or the prediction models.
Prediction Methods
The goal of this study is to predict opioid poisoning of patients in the future using existing EHR data. We built our prediction models with multiple machine learning methods. Traditional machine learning methods such as decision tree and random forest have been proved effective in many health data analytics applications. Recently, deep learning methods have been widely used due to the capability of handling large number of features. Since there are a large number of features in our studies, we decided to take advantage of deep learning methods as well and compared that with traditional methods.
Traditional Machine Learning Methods. We utilized methods including random forest, decision tree and logistic regression in our work, which have proven effective for EHR data-based prediction tasks 21, 25, 26. In the experiments, we kept most settings and parameters with default values, and adjusted some of them to fit our tasks. In practice, for clinical decision support, identifying all patients with high opioid poisoning risk is desired, thus between high precision and recall rates, the high recall rate in the prediction model can be more critical. In logistic regression, we employed l2 regularization as the penalization and liblinear as the optimizing algorithm. Both random forest and decision tree models took Gini impurity as the criterion to split data in training, which will be further discussed for feature importance calculation below. Furthermore, there is no tree depth limit for either random forest or decision tree model. We assigned a 10 times higher weight to positive cases than negative cases for all three methods during the training phase in order to achieve a higher F1 score, which can potentially solve the problem that the dataset is imbalanced.
Deep Learning Methods. Deep neural networks have been proven effective in many healthcare prediction applications13, 14, 16, 20, 27. We implemented a fully connected neural network based model. Our model is composed of three fully connected layers, two dropout layers and one output layer. First two fully connected layers are each followed by a dropout layer and then followed again by one more fully connected layer, which is connected to the output layer. We set the dimension of first two fully connected layers as 512 and third fully connected layer as 8. Since this is a binary classification task, the dimension of the last layer is one. A dropout layer follows a fully connected layer to prevent overfit - it will randomly drop out a portion of outputs from previous fully connected layer at each training epoch. We set the portion or namely dropout rate as 20%. The framework of our neural network is illustrated in Figure 3.
Figure 3.
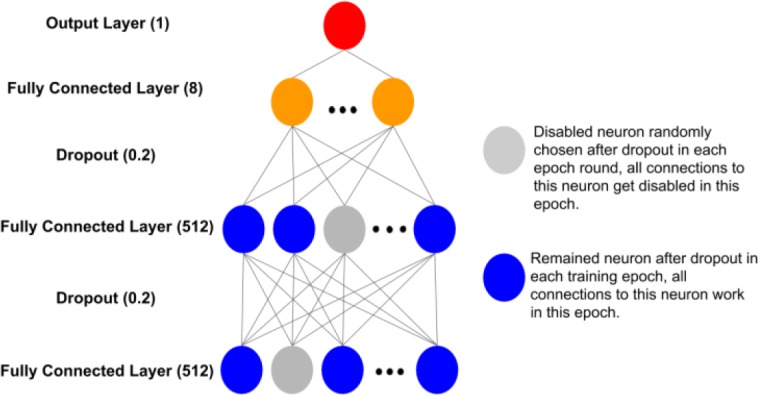
The framework of the neural network designed for the prediction model.
A rectified linear unit (ReLU) function is used as the non-linear transformation function for each hidden layer. We chose ReLU for preventing vanishing gradient and sparse activation problems, and improving computation efficiency28. A sigmoid function is applied in the last layer. We learned the parameters by optimizing binary cross- entropy loss function. To minimize the loss function, Adam optimization algorithm was selected. Adam is an optimization algorithm can replace classical stochastic gradient descent procedure to update network weights iterative, it has advantages in computation efficiency and little memory requirement for it combines the best property of adaptive gradient algorithm and root mean square propagation29.
Implementation. In our experiment, the implementation environment is the Python programming language (2.7). Traditional machine learning methods are implemented with Python scikit-learn package30. Deep learning is implemented with Python Tensorflow31 and Python Keras32. Other used libraries include Python Numpy and Python Pandas. The training was performed on an NVIDIA Tesla V100 (16GB RAM).
Results
Prediction Results Analysis
In our experiments, for both SPARCS and Health Facts datasets, we randomly took 90% of positive and negative patients as training set and rest as test set. To be specific, 360,000 negative patients and 36,000 positive patients as training set, while 40,000 negative patients and 4,000 positive patients as test set, for SPARCS dataset. 90,000 negative patients and 9,000 positive patients as training set, while 10,000 negative patients and 1,000 positive patients as test set, for Health Facts dataset.
To comprehensively evaluate performance of models, we calculated all common metrics including accuracy, precision, recall, F1 score and AUC. As the dataset is imbalanced, accuracy and AUC can be misleading. As we stated in the previous section, recall is a critical factor for the prediction models. The F1 score is a measurement considering both precision and recall, so it is an aggregated assessment of the overall prediction performance. We compared traditional methods and deep learning method for two datasets respectively. The results are shown in Table 2. The best results for each metric category are highlighted in bold.
Table 2.
Experiment Results of different methods on SPARCS and Health Facts datasets.
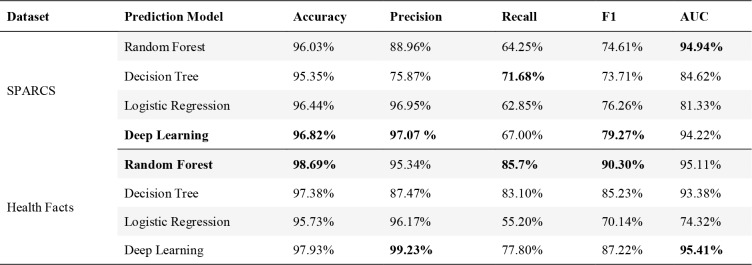 |
Results demonstrated our models are capable of classifying opioid poisoning very well. We can achieve an F1 score of 79.27% for SPARCS (by deep learning) and 90.30% for Health Facts (by random forest). For precision, the best performance we can achieve is through deep learning: 97.07% for SPARCS and 99.23% for Health Facts, indicating the ability of models to identify only opioid poisoned patients. For recall, we can achieve 71.68% for SPARCS and 85.70% for Health Facts respectively for the best case, indicating the ability to find all the opioid poisoned patients in the dataset. The best AUC score we can achieve is 94.94% for SPARCS and 95.41% for Health Facts respectively.
For the SPARCS dataset, which comes with a smaller number of features, deep learning generates the best F1 score and a comparable AUC score with random forest. For Health Facts, which has more comprehensive features, random forest has the best F1 score, and deep learning generates the best AUC score.
Feature Analysis
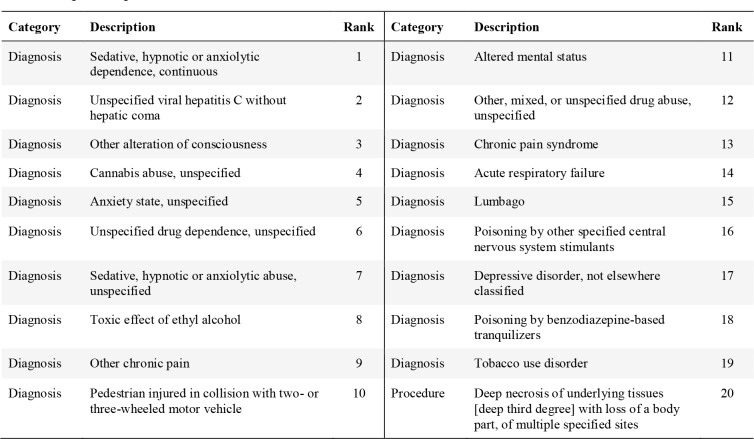
It is vital to understand the importance of different features in the models, to support researchers or clinicians to exploit potential causes or trajectories of diseases. Based on our best traditional method random forest, we generated top most important features for both datasets in Table 3 and 4 respectively. The rank and feature category are also shown in the tables. Random forest calculates the importance of each feature by using Gini importance33. It is defined as the total decrease in node Gini impurity index weighted by the probability of reaching that node averaged over all decision trees of the ensemble. Gini impurity index is defined as:
Table 3.
Top 20 Important Features for Prediction on SPØCS Dataset.
 |
where is the number of classes, is the ratio of this class, and G is the Gini impurity index. Random forest is an ensemble of decision trees. For every input sample, each decision tree will decide the path from root to leaf node for it, and the leaf will tell if the case is positive or negative. Then the model will ensemble the results of all decision trees to decide the final result.
In every node of the decision tree, there is a feature to decide the path after the node. So for each node, samples left for each class are different, and the Gini impurity index will be different. Then we have Gini importance as:
Gparent is the Gini impurity index of the parent node, 1 and 2 are the Gini impurity indexes for two child nodes. Finally, the weighted summation of Gini importance of all nodes for one feature in all decision trees will be the final importance of that feature.
For New York State SPARCS data, most important features are diagnosis codes. The top feature is “Sedative, hypnotic or anxiolytic dependence, continuous” (ICD-9 code 304.11, approximately mapped to ICD-10 code F13.20 “Sedative, hypnotic or anxiolytic dependence, uncomplicated”). These disorders result from the non-medical use of medications known as sedatives, hypnotics, and anxiolytics. The second top feature is relevant to Hepatitis C (ICD-9 code 070.70 or ICD-10 code B19.20), which is commonly transmitted by needles shared among those who inject drugs non- medically34. The third top feature “other alteration of consciousness”. Common underlying causes of decreased consciousness includes drugs, alcohol, substance abuse, certain medical conditions, epilepsy, low blood sugar, etc. Note that marijuana misuse (“cannabis abuse, unspecified”) ranks top 4. There are multiple top features relevant to chronic pain (“other chronic pain”, “chronic pain syndrome”, “lumbago”). Injury from car accidents or third-degree burn are also among the top 20 features.
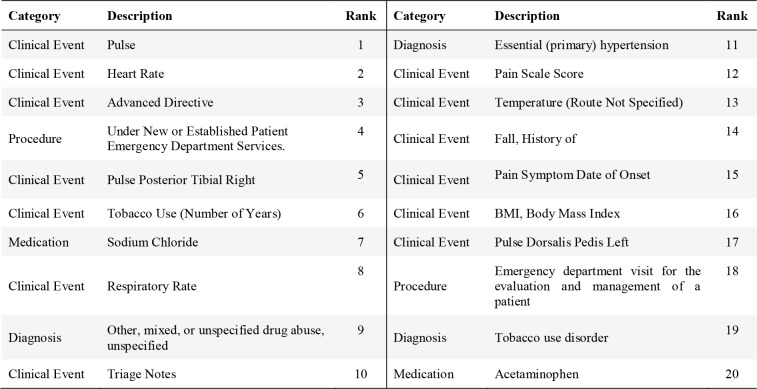
The Health Facts database has much richer features compared to SPARCS data. It includes many clinical events and medications in addition to diagnoses and procedures. Interestingly, basic measurements such as heart rate (Pulse, Heart Rate, Pulse Posterior Tibial Right, or Pulse Dorsalis Pedis Left) and respiratory rate are among top predicting features, as taking too much of opioid can lead to a slow heart rate and difficulty maintaining breathing35. Temperature, pain scale, history of fall, and BMI are also among the top 20 features.
Table 5 summarizes the aggregated importance of each category of features on contributing to the prediction. For SPARCS, diagnosis dominates the contribution, and the procedure follows. Demographic information also contributes to the prediction. For Health Facts, the descending order of importance of the predictor categories is clinical events, diagnosis, medications, procedure and demographic information.
Table 5.
Importance for each feature category.
| SPARCS | Health Facts | ||||||
| Diagnosis | Procedure | Demographic | Diagnosis | Procedure | Medications | Clinical Events | Demographic |
| 78.07% | 15.27% | 6.64% | 25.14% | 6.17% | 13.81% | 50.09% | 4.79% |
Experiment on Using Primary Data only for the Prediction
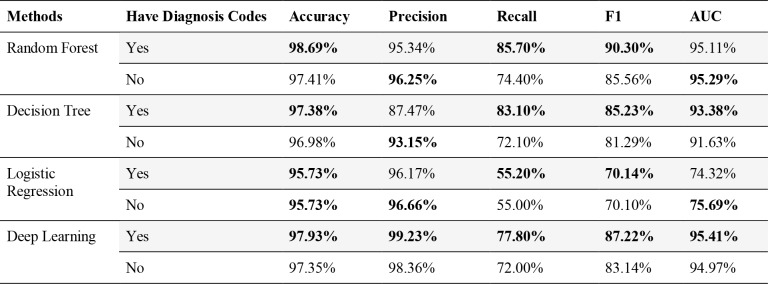
Since diagnosis codes are secondary data for billing purposes, we were interested in studying the performance with only primary data. We took the Health Facts dataset and removed all diagnosis codes and then built the same models. Table 6 shows the result before and after removing diagnosis features. By removing the diagnosis data, we could still achieve a good performance on prediction with similar results. Random Forest achieves slightly higher AUC without diagnosis codes.
Table 6.
Performance of models before and after removing diagnosis features on Health Facts.
 |
Discussion
Data and evidence based studies hold high potential for studying the problem of opioid epidemic in the U.S. With the wide availability of Electronic Health Records, predictive modeling provides a powerful approach to automatically predict the risks of opioid overdoses. Compared to previous related work, for example Che20 try to classify opioid overdose patients into short and long term users, our work is to identify potential opioid overdose patients among all patients. To our best knowledge, this is the first work on machine learning based opioid overdose prediction with large scale EHR data. Instead of limiting the method to a specific model, we proposed multiple models and compared their performance.
While claims data such as SPARCS has limited information, our experiments demonstrate that they can still achieve reasonable prediction results. More comprehensive EHR data such as Health Facts has richer information and thus can achieve very promising results. Our methods can achieve best recall with the random forest method (precision: 95.3%, recall: 85.7%, F1 score: 90.3% and AUC: 95.11%), and best precision with deep learning (precision: 99.2%, recall: 77.8%, F1 score: 87.2% and AUC: 95.41%).
The analysis of features also provides interesting findings. For example, in SPARCS-based claims data, Hepatitis C is an indicator of potential non-medical opioid use, as Hepatitis C infection is frequently infected due to the sharing of needles and syringes for drug use. Marijuana misuse, tobacco use and alcohol are also linked to opioid overdose. Chronic pain management and treatment of acute pain can lead to opioid overdose. With more comprehensive EHR data, we find many clinical events such as measurements of heart beat, respiratory rate and pain scale that can help the prediction, and the clinical events dominates the contribution for prediction. By removing secondary data such as diagnosis codes, we find that our model can still achieve comparable performance. Our study also demonstrates that demographic information and sources of payments are helpful factors for the prediction.
One important information source that could enhance our models is clinical notes, which are missing from datasets in this study. In our future work, we will include clinical notes by applying natural language processing technologies. Another limitation of our method is that we did not employ any specific imputation method to deal with the missing value problem. To include more features with many missing values, we will employ different imputation methods. Besides, for convenience in this work, we took all patients that has not been diagnosed as opioid overdose as negative patients, but actually we don’t know about their future, we will try to apply more reasonable way to identify positive and negative patients. For the deep learning models, we currently have a relatively simpler architecture which does not take advantage of the temporal factors of the data and visits. We will explore RNN method and combine both outpatient and inpatient visits for future studies.
Conclusion
The opioid epidemic has become a national emergency for public health in the United States. Identifying patients of high risk of opioid overdose can provide smarter and safer clinical decisions for treatment, and potentially improve current clinical practices for pain management. Our studies on machine learning based predictive models for opioid overdose prediction show promising results with both claims data and comprehensive EHR data. It demonstrates that an AI based approach, if implemented at clinical side, can achieve automated prediction with high accuracy, and provide an opportunity for AI assisted prediction to support healthcare providers to combat opioid crisis.
Figures & Table
Table 4.
Top 20 Top Predicting Features in Health Facts Dataset.
 |
References
- 1.Han B, Compton WM, Blanco C, Crane E, Lee J, Jones CM. Prescription opioid use, misuse, and use disorders in US adults: 2015 National Survey on Drug Use and Health. Annals of Internal Medicine. 2017 Sep 5;167(5):293–301. doi: 10.7326/M17-0865. [DOI] [PubMed] [Google Scholar]
- 2.Rudd RA. Increases in drug and opioid-involved overdose deaths—United States, 2010–2015. MMWR Morbidity and mortality weekly report. 2016:65. doi: 10.15585/mmwr.mm655051e1. [DOI] [PubMed] [Google Scholar]
- 3.Scholl L, Seth P, Kariisa M, Wilson N, Baldwin G. Drug and opioid-involved overdose deaths—United States, 2013–2017. Morbidity and Mortality Weekly Report. 2019 Jan 4;67(5152):1419. doi: 10.15585/mmwr.mm675152e1. [DOI] [PMC free article] [PubMed] [Google Scholar]
- 4.Dowell D, Haegerich TM, Chou RJJ. CDC guideline for prescribing opioids for chronic pain—United States, 2016. 2016;315(15):1624–45. doi: 10.1001/jama.2016.1464. [DOI] [PMC free article] [PubMed] [Google Scholar]
- 5.Bruneau J, Ahamad K, Goyer MÈ, Poulin G, Selby P, Fischer B, Wild TC, Wood E. Management of opioid use disorders: a national clinical practice guideline. Canadian Medical Association Journal. 2018 Mar 5;190(9):E247–57. doi: 10.1503/cmaj.170958. [DOI] [PMC free article] [PubMed] [Google Scholar]
- 6.Henry J, Pylypchuk Y, Searcy T, Patel V. Adoption of electronic health record systems among US non-federal acute care hospitals: 2008-2015. ONC data brief. 2016 May;35:1–9. [Google Scholar]
- 7.Statewide Planning Research Cooperative System. [Internet]. Health.ny.gov. [cited 7 March 2019] Available from: https://www.health.ny.gov/statistics/sparcs/
- 8.Cheng Y, Wang F, Zhang P, Hu J, editors. Risk prediction with electronic health records: A deep learning approach. Proceedings of the 2016 SIAM International Conference on Data Mining; 2016: SIAM. [Google Scholar]
- 9.Miotto R, Wang F, Wang S, Jiang X, Dudley JT. Deep learning for healthcare: review, opportunities and challenges. 2017;19(6):1236–46. doi: 10.1093/bib/bbx044. [DOI] [PMC free article] [PubMed] [Google Scholar]
- 10.Shickel B, Tighe PJ, Bihorac A, Rashidi P. Deep EHR: A survey of recent advances in deep learning techniques for electronic health record (EHR) analysis. 2018;22(5):1589–604. doi: 10.1109/JBHI.2017.2767063. [DOI] [PMC free article] [PubMed] [Google Scholar]
- 11.Wang F, Casalino LP, Khullar D. Deep Learning in Medicine—Promise, Progress, and Challenges. 2018 doi: 10.1001/jamainternmed.2018.7117. [DOI] [PubMed] [Google Scholar]
- 12.Rajkomar A, Oren E, Chen K, Dai AM, Hajaj N, Hardt M, et al. Scalable and accurate deep learning with electronic health records. 2018;1(1):18. doi: 10.1038/s41746-018-0029-1. [DOI] [PMC free article] [PubMed] [Google Scholar]
- 13.Avati A, Jung K, Harman S, Downing L, Ng A, Shah NH. Improving palliative care with deep learning. BMC medical informatics and decision making. 2018 Dec;18(4):122. doi: 10.1186/s12911-018-0677-8. [DOI] [PMC free article] [PubMed] [Google Scholar]
- 14.Lipton ZC, Kale DC, Elkan C, Wetzel R. Learning to diagnose with LSTM recurrent neural networks. 2015 Nov 11; arXiv preprint arXiv:1511.03677. [Google Scholar]
- 15.Esteban C, Staeck O, Baier S, Yang Y, Tresp V, editors. Predicting clinical events by combining static and dynamic information using recurrent neural networks. 2016 IEEE International Conference on Healthcare Informatics (ICHI); 2016: Ieee.. [Google Scholar]
- 16.Choi E, Bahadori MT, Schuetz A, Stewart WF, Sun J. Doctor ai: Predicting clinical events via recurrent neural networks. 2015 [PMC free article] [PubMed] [Google Scholar]
- 17.Liu J, Zhang Z, Razavian N. Deep ehr: Chronic disease prediction using medical notes. 2018 [Google Scholar]
- 18.Rashidian S, Hajagos J, Moffitt R, Wang F, Dong X, Abell-Hart K, et al. Disease phenotyping using deep learning: A diabetes case study. 2018 [Google Scholar]
- 19.Rashidian S, Hajagos J, Moffitt RA, Wang F, Noel KM, Gupta RR, Tharakan MA, Saltz JH, Saltz MM. Deep Learning on Electronic Health Records to Improve Disease Coding Accuracy. AMIA Summits on Translational Science Proceedings. 2019;2019:620. [PMC free article] [PubMed] [Google Scholar]
- 20.Che Z, Sauver JS, Liu H, Liu Y, editors. Deep Learning Solutions for Classifying Patients on Opioid Use. AMIA Annual Symposium Proceedings. 2017 American Medical Informatics Association. [PMC free article] [PubMed] [Google Scholar]
- 21.Ellis RJ, Wang Z, Genes N, Ma’ayan A. Predicting opioid dependence from electronic health records with machine learning. 2019;12(1):3. doi: 10.1186/s13040-019-0193-0. [DOI] [PMC free article] [PubMed] [Google Scholar]
- 22.SBMI Data Service. [Internet] sbmi.uth.edu. [cited 7 March 2019] Available from: https://sbmi.uth.edu/sbmi- data-service/data-set/cerner/
- 23.Case Study: Exploring How Opioid-Related Diagnosis Codes Translate From ICD-9-CM to ICD-10-CM. [Internet]. hcup-us.ahrq.gov. [cited 7 March 2019]. Available from: https://www.hcup-us.ahrq.gov/datainnovations/ICD-10CaseStudyonOpioid-RelatedIPStays042417.pdf.
- 24.Chen X, Wang Y, Yu X, Schoenfeld E, Saltz M, Saltz J, et al., editors. Large-scale analysis of opioid poisoning related hospital visits in New York state. AMIA annual symposium proceedings. 2017 American Medical Informatics Association. [PMC free article] [PubMed] [Google Scholar]
- 25.Taslimitehrani V, Dong G, Pereira NL, Panahiazar M, Pathak J. Developing EHR-driven heart failure risk prediction models using CPXR (Log) with the probabilistic loss function. 2016;60:260–9. doi: 10.1016/j.jbi.2016.01.009. [DOI] [PMC free article] [PubMed] [Google Scholar]
- 26.Taylor RA, Pare JR, Venkatesh AK, Mowafi H, Melnick ER, Fleischman W, et al. Prediction of Inæhospital Mortality in Emergency Department Patients With Sepsis: A Local Big Data–Driven, Machine Learning Approach. 2016;23(3):269–78. doi: 10.1111/acem.12876. [DOI] [PMC free article] [PubMed] [Google Scholar]
- 27.Ravì D, Wong C, Deligianni F, Berthelot M, Andreu-Perez J, Lo B, et al. Deep learning for health informatics. 2017;21(1):4–21. doi: 10.1109/JBHI.2016.2636665. [DOI] [PubMed] [Google Scholar]
- 28.Nair V, Hinton GE, editors. Rectified linear units improve restricted boltzmann machines. Proceedings of the 27th international conference on machine learning (ICML-10); 2010 [Google Scholar]
- 29.Kingma DP, Ba J. Adam: A method for stochastic optimization; 2014. [Google Scholar]
- 30.Pedregosa F, Varoquaux G, Gramfort A, Michel V, Thirion B, Grisel O, et al. Scikit-learn: Machine learning in Python. 2011 (Oct):2825–30. [Google Scholar]
- 31.Abadi M, Barham P, Chen J, Chen Z, Davis A, Dean J, et al., editors. Tensorflow: A system for large-scale machine learning. 12th {USENIX} Symposium on Operating Systems Design and Implementation ({OSDI} 16) 2016 [Google Scholar]
- 32.Chollet F. Keras. 2015 [Google Scholar]
- 33.Breiman L. Routledge: 2017. Classification and regression trees. [Google Scholar]
- 34.Hepatitis C. Questions and Answers for the Public. [Internet]. cdc.gov. [cited 7 March 2019]. Available from: https://www.cdc.gov/hepatitis/hcv/cfaq.htm#C1.
- 35.Martin WR. Pharmacology of opioids. Pharmacological Reviews. 1983 Dec 1;35(4):283–323. [PubMed] [Google Scholar]


