

Abstract
As health IT has become overloaded with patient information, provider burnout and stress has accelerated. Studies have shown that EHR usage leads to heightened cognitive workload for nurses, and increases in cognitive workload can result in stronger feelings of exhaustion and burnout. We conducted a time motion study in an oncology division to examine the relationships between nurses’ perceived workload, stress measured by blood pulse wave (BPw), and their time spent on nursing activities, and to identify stress associated with EHR use. We had a total of 33 observations from 7 nurses. We found that EHR-related stress is associated with nurses’ perceived physical demand and frustration. We also found that nurses’ perceived workload is a strong predictor of nurses’ stress as well as how they spent time with their patients. They also experienced higher perceived mental demand, physical demand, and temporal demand when they were assigned to more patients, regardless of patient acuity. Our study presents a unique data triangulation approach from continuous stress monitoring, perceived workload, and a time motion study.
Introduction
Numerous health information technologies (ITs) have been implemented in hospitals, and influence patient care, nursing activities, and turnover time and volume.1 There is a growing body of literature describing nurses’ work using observational studies.2-10 Several variables have been identified to affect nurses’ activities. For example, patient care time and quality is significantly correlated to nurse staffing and patient acuity.11-14 Patient acuity helps nurse managers determine levels of patient care, staffing, nurse-patient assignment, and the cost of care.15 In addition, the differences in the working pattern among nurses have also been noted.1,16 Nurses’ perceived workload is significantly correlated to the amount of work that could have been delegated but was not, nurse-patient ratio, and the amount of documentation.17 However, although evidence has shown the impact of these variables, only one study has controlled for these potential confounders to assess nurses’ time allocation on nursing activities.18
In addition, as health IT has become overloaded with patient information, provider burnout and stress has accelerated.19,20 While the amount of literature investigating physician burnout from EHR usage is robust, limited research has explored EHR burnout among nurses. However, studies have shown that EHR usage leads to heightened cognitive workload for nurses, and increases in cognitive workload can result in stronger feelings of exhaustion and burnout.21,22 Similarly, Gregory and colleagues found that nurses’ and physicians’ perception of having insufficient time to complete tasks related to alerts in the EHR was a significant predictor of cognitive weariness, a subscale of burnout in the disseminated questionnaire.23 One other study conducted a survey with advanced practice registered nurses exploring the association between EHR related stress and burnout.24 More than half of the respondents reported that the EHR added frustration to their day, and insufficient time for documentation in the EHR was commonly reported as well. After adjusting for demographics and practice characteristics, researchers found that EHR frustration and insufficient documentation time were both significant predictors of burnout among nurses. In another survey, 61% of nursing personnel reported feeling heightened frustration when using their respective EHR systems.25 While the existing evidence discussed suggests that EHR usage leads to burnout among nurses, further investigation must be done in order to properly characterize the association in order to facilitate solutions.
We conducted a time motion study to observe and record nursing activities during their working day shifts between 7am to 7pm. In a prior study, we reported our design and approaches to collect and visualize nursing workflow in three activity dimensions: communication, hands-on tasks and location.26,27 Communication represents whom nurses are interacting with; hands-on tasks represent tasks nurses are physically performing (i.e. preparing medication); and location represents where nursing activities take place. We explored these three activity dimensions across the continuum of time to understand multitasking and task switching in nursing practice.26,27 We also controlled the distribution of observation time by splitting the 12-hour nursing day shift into three time blocks: 7am-11am, 11am-3pm, and 3pm-7pm. Our novel approach explores the three activity dimensions, across the continuum of time, to understand the phenomena of multitasking in nursing practice. 26,29-31 The study found that nurses multitasked (having communication and hands-on tasks simultaneously) 39.48% of all times. The study design and methods also demonstrated a practical and reliable approach to conducting and analyzing time motion studies.26,27
In this paper, we present a new time motion study in an oncology division with the same study design as the previous study,26,27 but included additional variables to investigate factors affecting nursing practice, such as staffing, patient acuity, nurses’ perceived workload, and their physiological response to stress, blood pulse wave (BPw). BPw is described as the pulse wave that travels through the circulatory system when the heart contracts and blood is ejected.32 BPw is related to cardiac demands,32 which represents an elevated or aroused physiological state and is correlated with potential psychological or emotional stressors.32 There are few studies about BPw and its relation to stress, but literature regarding pulse wave velocity (PWV) is flourishing. The definition of PWV is comparable to that of BPw, as it is the velocity of the arterial pulse that propagates through the circulatory system.33 PWV is used clinically as a measure of arterial stiffness, and is determined by measuring the time it takes a pulse wave to travel a given distance among the blood vessel.34,35 A number of studies have discovered associations between mental stress and both PWV and arterial stiffness due to the contribution of stress to increased blood pressure and risk for hypertension.36-40 Specifically, acute mental stress has been found to lead to significantly sustained increases in PWV,36,37,39 and individuals suffering from chronic stress are more likely to have greater, prolonged PWV values.40 The evidence suggests the similarity of BPw and PWV, and that BPw or PWV, can serve as an adequate measure of psychological stress. In this study, we used a commercial device capable of continuously measuring BPw.
The purposes of the study were to examine the relationships between nurses’ perceived workload, stress measured by BPw, and their time spent on nursing activities. We were especially interested in identify stress associated with EHR use. To our knowledge, we were the first study integrating data sources from nurses’ perceived workload, BPw, and a time motion study.
Methods
Setting and Sample
The time motion study was conducted in an oncology division at a mid-west academic medical center. We recruited registered nurses who worked in the observed unit. We observed nurses in the general patient care and adjacent areas such as the nursing station, hallway, medication/supply room, and patient rooms. In this unit, nurse-patient ratios ranged from 1:3 to 1:4.
Observed nursing activities
We observed nursing activities, such as hand-off (shift reporting), direct patient care (patient assessment, medication administration, procedures), indirect patient care (medication preparation, obtaining medication), interprofessional communication, and EHR review and charting. Due to patient safety and the difficulty of observing nurses in patient isolation rooms, we did not document nurses’ hands-on tasks and communication in these rooms. The observable nursing activities list was refined iteratively with the division’s clinical leadership and research team, and finalized during the training and trial observations. In total, we defined 16 types of communication, 35 hands-on tasks, and 23 locations. A list of example activities with definitions and start-end times can be found in our prior publication.26
We used TimeCaT,41 a validated electronic time capture tool developed to support data collection for time motion studies, optimized for touch enabled tablet computers and iPads. Observers document nursing activities in TimeCaT when they shadow nurses.41 In TimeCaT, we were also able to visualize workflow and explore the location where nursing activities occurred. The data collected in TimeCaT allowed us to portray nurses’ work: with whom the nurse was speaking (communication), while doing what (hands-on task), and at what location.26
Observers & Inter-observer reliability assessment (IORA)
Our observers were three undergraduate senior nursing students. Observers were required to attend training sessions and trial observations for at least 12 hours. We established the inter-observer reliability via the IORA feature provided in TimeCaT.41 The IORA in TimeCaT considers four types of agreements: 1) proportion-kappa (P-K): evaluates the naming agreement on virtually created one-second activity, based on the Kappa statistic. P-K provides a global assessment of the agreement over time; 2) naming-kappa (N-K): a systematic pairing approach based on time-overlap, and provides a Kappa statistic representing the agreement on activity naming; 3) duration-concordance correlation coefficient (D-CCC): agreement on the duration of an activity.26 We ensured that the IORA results indicated consistent agreement between our observers before the data collection (Table 1).
Table 1.
Inter-observer reliability assessment
| Communication | Hands-On Task | Location | ||||||||||
| P-K | N-K | D-CCC | S-NW | P-K | N-K | D-CCC | S-NW | P-K | N-K | D-CCC | S-NW | |
| IORA | 93.34% | 75.21% | 0.905P | 0.76 | 92.76% | 80.43% | 0.944p | 0.85 | 97.66% | 83.58% | 0.994p | 0.86 |
| S1 vs S2 | 0.88K | 0.63 K | 0.9K | 0.75K | 0.97K | 0.78K | ||||||
| IORA2 | 93.23% | 75.68% | 0.942p | 0.84 | 90.7% | 73.77% | 0.947p | 0.78 | 94.17% | 79.78% | 0.996 | 0.82 |
| S2 vs S3 | 0.86K | 0.68K | 0.86K | 0.69K | 0.93K | 0.73K | ||||||
P-K= proportion-kappa; N-K= naming-kappa; D-CCC= duration-concordance correlation coefficient; S-NW= Sequence-Needleman-Wunsch
Data Collection
No identifiable information or health records were collected. A typical 12-hour nursing day shift was split into three time blocks: 7am-11am, 11am-3pm, and 3pm-7pm. The 4-hour observation time block minimized the chance of unbalanced data if a 12-hour day shift happened to have a heavy or light workload, and also prevented observer fatigue. Each 4-hour observation was a one-on-one observation: one observer shadowed one nurse. Observers maintained a certain distance from the observed nurse during the observation, and were not allowed to interact with the observed nurse in order to collect data reflecting true time duration and context. After approval from the local Institutional Review Board, observers obtained informed consent from the observed nurse as well as permission from patients to observe their care.
Stress: We measured BPw as the indication of the nurse’s stress level.32 We used a wearable device on the upper arm of the nurse to continuously measure BPw. The device has been used for monitoring chronic stress and assessment of patients’ mental stress. During the time motion study observations, we provided the wearable BPw measure, developed by Biovotion, to the observed nurse. The wearable device at the upper arm measures biometric signals continuously with timestamps, including BPw. Biovotion has been used for monitoring chronic stress42 and assessment of patients’ mental stress.43 For each 4-hour observation, the continuous stress (BPw) data were collected and integrated with the time motion study data.
Perceived workload: At the end of each observation, we asked the observed nurse to fill out the NASA task-load index (TLX), which is widely used to assess perceived workload. The NASA-TLX consists of 6 questions:44 1) Mental Demand: How much mental and perceptual activity was required?; 2) Physical Demand: How much physical activity was required?; 3) Temporal Demand: How much time pressure did you feel due to the pace at which the tasks or task elements occurred?; 4) Performance: How successful were you in performing the task?; 5) Effort: How hard did you have to work (mentally and physically) to accomplish your level of performance?; and 6) Frustration: How irritated, stressed, and annoyed versus content, relaxed, and complacent did you feel during the task? Nurses rated their perceived workload from 0 (very low) to 100 (very high).
Staffing: We collected staffing data for each observation including nurse-patient ratio, patient type (primary, non-primary, or in isolation), number of consecutive days worked, number of discharges by the observed nurse, and patient acuity. We assessed patient acuity based on an adapted AcuityPlus, which is a patient classification methodology developed by the QuadraMed Corporation.45 It has been used to determine the acuity and the type of care needed for each patient, such as communication and cognitive support, safety management, activities of daily living, etc. AcuityPlus has been validated by several studies.46,47 Based off of the acuity and care, each patient then was assigned a numerical acuity score. The acuity score ranged from 15 (lowest acuity) to 43 (highest acuity).
Nurses’ demographics: We also collected nurses’ age, education, gender, and years of working experience.
Data Analysis
We performed descriptive analysis to summarize nurses’ time spent and stress on nursing activities in communication, hands-on tasks, and locations. We used one-way ANOVA with post hoc analysis and Bonferroni correction to examine group differences, and paired t-test to compare two variables as repeated measures in every observation. We performed the linear mixed effects model to examine factors affecting outcome variables and account for correlation of repeated observations from the same nurse. All statistical analyses were two-sided at significance level 0.05 and conducted in SAS 9.4 and IBM SPSS 25.0.
Results
We completed a total of 33 observations (132 hours) with 7 registered nurses from May 2018 to February 2019. We also conducted a post-hoc analysis and found that our sample size has an 80% power to detect an effect size of 0.6 with linear mixed effects model at significance level 0.05. This was calculated based on a two-sided Wald test of regression coefficients in linear mixed effects model adjusting for design effect and correlation of repeated measures from the same nurse. From the seven nurses, six nurses had three to six observations; one nurse had one observation; 4.41 observations on average. Among the 33 observations, nine were on Monday, 1 on Tuesday, 6 on Wednesday, 5 on Thursday, 9 on Friday, 0 on Saturday, and 3 on Sunday; 11 were 7am-11am, 10 were 11am-3pm, and 12 were 3pm-7pm. Participating nurses have a mean age of 30, with 3.18 years of working experience on average. One male nurse participated, and all nurses have a bachelor’s degree. Table 2 summarizes the demographics, staffing, and nurses’ perceived workload, stress by BPw, and time spent in patient rooms per 4-hour observation.
Table 2.
Summary of descriptive analysis
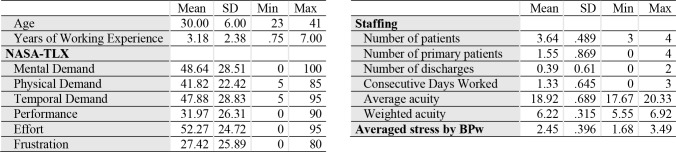 |
Before compositing patients’ acuity scores for a single observation (nurse patient ratios ranged from 1:3 to 1:4), we examined whether nurses’ time spent in the patient room was being influenced by patient acuity or patient types: primary patient (P), non-primary patient (NP), and in isolation (ISO). One-way ANOVA showed that there were no differences of nurses’ time spent in a patient room among the three patient types (p=0.8635). Patient acuity was also not a significant predictor for time spent in a patient room (p=0.0847). However, there were differences of the mean patient acuity scores among the three patient types (P: NP: ISO, mean(SD) = 18(1.27): 19.35(1.48): 20.22(2.10), p<0.0001). The patient acuity scores for ISO and NP are significantly higher than P. We used the average acuity score and number of patients as the patient load in an observation. We also computed weighted acuity scores to adjust for the average acuity score in an observation. We weighted patient acuity scores with weights as following: weight_P=18/(18+19.35+20.22); weight_np=19.35 /(18+19.35+20.22); weight_iso=20.22/(18+19.35+20.22). As a result, the single patient acuity score for each observation can be calculated as weighted acuity = weighted acuity total/number of patients. During the analyses, we did not find average acuity or weighted acuity as a significant factor to stress or time spent.
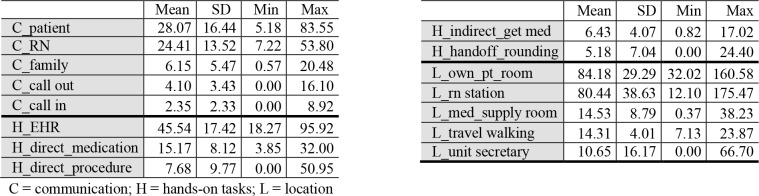
We examined nurses’ time spent on nursing activities (Table 3) and found that nurses spent the most time communicating with patients (28.07 mins) and other nurses (24.41 mins), followed by phone calls (6.45 mins), and communication with family (6.15 mins). For hands-on tasks, nurses’ spent most time on EHR (45.54 mins), and the time is significantly higher than the second highest hands-on task: direct medication time (15.17 mins) (p=0.000). Nurses spent the most time in patient rooms (84.18 mins) and at the nursing station (80.44 mins).
Table 3.
Nurses’ top time spent (minutes) activities per 4-hour observation
 |
Factors associated with nurses’ average stress
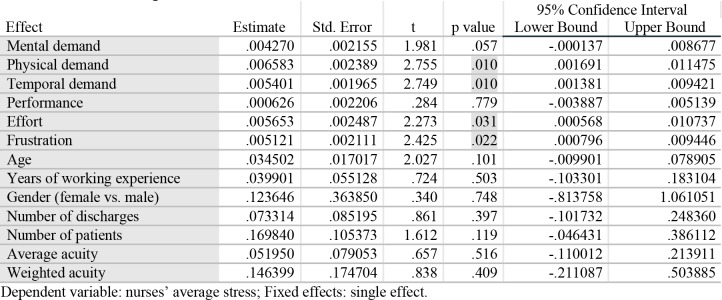
We performed linear mixed effect models to examine factors associated with nurses’ average stress in a 4-hour observation. When considering the simplest linear mixed effect models with each individual fixed effect, only perceived physical demand, temporal demand, effort, and frustration shows statistically significant (Table 4). We also did not find any difference in stress across time blocks (7am-11am, 11am-3pm, and 3pm-7pm) (p=0.759).
Table 4.
Nurses’ average stress with individual fixed effect
 |
Nurses’ average stress and perceived workload
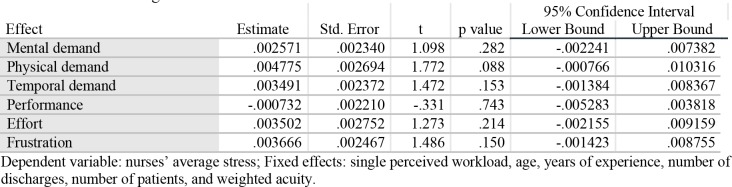
When examining multiple fixed effects in the linear mixed effect model to account for demographics and staffing together, none showed significant association with nurses’ stress (Table 5). Also, none of nurses’ demographics and staffing variables were significantly associated with nurses’ stress.
Table 5.
Nurses’ average stress and NASA-TLX
 |
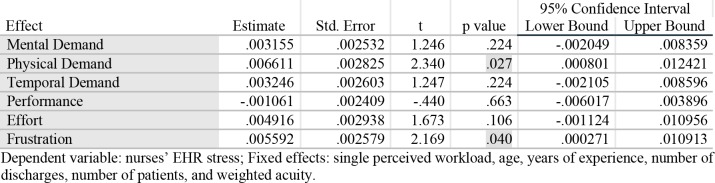
Nurses’ EHR stress and perceived workload
When examining nurses stress while using EHR (EHR charting and review) and their perceived workload, we found that nurses with higher perceived physical demand and frustration were associated with higher stress (p<0.05) (Table 6). But again, none of the nurses’ demographics or staffing showed statistical significance.
Table 6.
Nurses’ EHR stress and NASA-TLX
 |
Nurses’ EHR stress and EHR use time
When examining nurses’ EHR stress and the time spent on EHR, we did not find nurses’ EHR stress associated with longer use of EHR (p=0.846) (Table 7). None of nurses’ demographics or staffing showed significant different either. We also did not find longer EHR use with more nurse-patient ratio (p=0.733).
Table 7.
Nurses’ EHR stress and EHR use time
 |
Dependent variable: nurses’ EHR stress; Fixed effects: EHR time, age, years of experience, number of discharges, number of patients, and weighted acuity.
Nurses’ time in own patient room and EHR use time
We examined nurses’ time in own patient room and EHR use time (Table 8). Although not statistically significant, there is a trend that nurses who spent more time using EHR would have less time in own patient room (p=0.092) (Figure 1).
Table 8.
Nurses’ time in own patient room and EHR use time
 |
Figure 1.
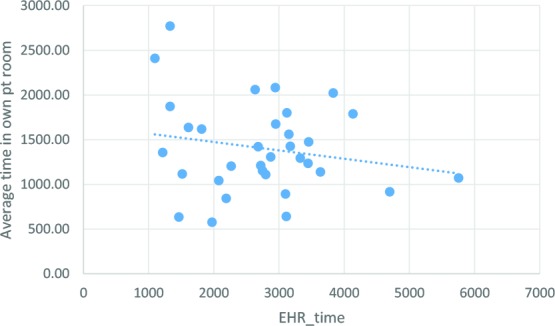
Time in own patient room and EHR
Stress with own patients vs. other patients
We also examined nurses’ stress in patient rooms, both paired t-test and Wilcoxon signed ranks test showed that nurses have similar stress in own patients room and in other patients room (own patients room stress: other patients’ rooms stress respective, Mean(SD) = 2.40(0.12): 2.56(0.73), p=0.180).
Nurses time spent in own patients room and patient acuity
Besides nurses’ stress, we were interested in whether nurses’ time spent in own patients room being influenced by patient acuity. The result from the linear mixed model, after accounting for nurses’ demographics and staffing, was similar to what we found with one-way ANOVA. We did not find patient acuity associated with nurses’ time spent in own patient’s room (p=0.895), nor any nurses’ demographics and staffing variables (p>0.3).
Nurses time spent in own patients room and perceived workload
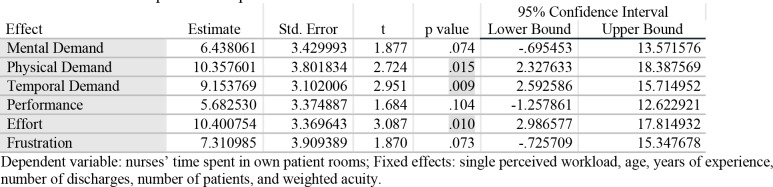
We also examined whether nurses time spent in patient rooms was associated with their perceived workload. The results showed that nurses’ time spent in own patient rooms had a positive relationship with perceived physical demand, temporal depend, and effort. In other words, when nurses expressed increases in perceived physical demand, temporal demand, and effort, they have likely spent more time in their patient rooms (Table 9).
Table 9.
Nurses’ time spent in own patient rooms and NASA-TLX
 |
Nurses’ patient load and perceived workload
We also noticed that nurses with more patients expressed a higher perceived mental demand (p=0.044), physical demand (p=0.041), and temporal demand (p=0.010). In addition, higher perceived frustration is associated with higher patient acuity (p=0.014). All models have accounted for nurses’ demographics and staffing.
Discussion
EHR stress associated with nurses’ frustration
Provider burnout and stress has accelerated due to being overloaded with patient information.19,20 Studies have shown that EHR usage leads to heightened cognitive workload for nurses, and increases in cognitive workload can result in stronger feelings of exhaustion and burnout.21,22 Similarly, a study found that nurses’ and physicians’ perception of having insufficient time to complete tasks related to alerts in the EHR was a significant predictor of cognitive weariness, a subscale of burnout in the disseminated questionnaire.23 Additionally a survey of advanced practice registered nurses explored the association between EHR related stress and burnout.24 More than half of the respondents reported that the EHR added frustration to their day, and insufficient time for documentation in the EHR was commonly reported as well. After adjusting for demographics and practice characteristics, researchers found that EHR frustration and insufficient documentation time were both significant predictors of burnout among nurses. In another survey, 61% of nursing personnel reported feeling heightened frustration when using their respective EHR systems.25
In our study, we collected continuous stress data and perceived workload, and coupled with the time motion study, enriched our ability to examine nurses’ EHR stress and validate nurses’ perceived frustration. Our results showed that nurses spent 45.54 minutes per 4-hour time block using the EHR, and this EHR use time was much more than any other communication or hands-on activities. We also found that nurses’ perceived physical demand and frustration were significantly associated with EHR stress. Previous studies reported frustration of using EHR due to insufficient documentation time.24,25 It seems ironic that nurses have spent the most time on EHR among all activities, are frustrated, but need more time on EHR. Although we did not detect association between nurses’ stress and longer use of EHR, the insignificant results may be due to that we do not have sufficient power to detect small effects (type II error). We also noticed that the continuous stress monitoring is better at detecting high stress in safety-related events, such as when being the second check witness and in the isolation room. More studies are needed to investigate the use of continuous stress monitoring to detect EHR-related stress. A better EHR design is also required to decrease EHR documentation time and cognitive load in using EHR.
Nurses’ perceived workload
Several studies have investigated the association between nurses’ workload and the quality of care they provide. One study found that higher workloads, higher acuity assignments, and poorly organized work environments were all key predictors of omitted or significantly delayed patient care.48 Similarly, another study found that larger patient to nurse ratios contributed to increased missed care.49 Beyond patient volume and acuity, researchers also found that nurses’ subjective or perceived quality of care and patient safety were strongly related to the number of missed care events.49 In addition, nurses’ perceived workload contributed to their ability to provide quality care. Using the NASA-TLX and nurse-reported missed essential care reports, researchers determined that even though staffing ratios and patient acuity were strongly associated with missed nursing care, their effects were greatly reduced when taking into account the nurses’ perceived workload.50 Our findings are consistent with these studies that nurses’ demographics, staffing, and patient acuity were not statistically associated with nurses’ stress. Instead, their perceived workload plays an important role in their time allocation and vice versa. Thus, nursing workload coupled with how that workload is experienced may directly affect patient care quality and delivery. This could also be problematic due to the fact that nurses frequently experience interruptions, which was found to be associated with an increased perceived workload.51
Nurses’ time spent on direct patient care and EHR- is there a balance?
Although not statistically significant, we found a trend that nurses’ increased EHR use was associated with less time in own patient room. Also, it seems rational that nurses would spend more time with patients with higher acuity, but we did not find any significant differences in nurses’ time spent based on patient types and acuity. After adjusting for repeated measures, we still did not find any differences due to patient acuity, nurses’ demographics, or staffing variables. Previous research has found that patient care time and quality are significantly correlated to nurse staffing and patient acuity.11-14 However, the complexity and variety of what nurses’ actually do may have impeded nurses’ functions and responsibilities in patient care. Nurses expressed lack of time being with their patients and frustration on insufficient resources needed.52,53 While top-of-license practice is recommended and needed for quality patient care, it remains critical, but unknown, regarding the best strategies to support the health IT world that nurses currently and will continue to face.
Study Limitations
The study had several limitations, 1) one unit in one hospital within one academic health system; 2) The small sample size (n=33); 3) Potential insufficient power to detect small effects (type II error); 4) Utilizing only one commercial device for BPw. Although some studies have utilized the wearable device to assess patients’ stress, we did not test the reliability of the device prior to the study. However, the wearable stress monitoring device did detect sensible stress outcomes. For example, nurses had the highest stress when being the second check witness and in the isolation room; Other limitations include 5) Lack of documented activities in the isolation room, as observers were not allowed access to the isolation room for safety reason; 6) Participation bias as the study required nurses’ participation and consent 7) Observation bias due to human capacity to accurately record every action.54 We may have missed some activities in rapidly changing activities, but we minimized the inconsistency between observers through rigorous training, IORA, and clearly defined definitions of each activity; 8) We detected association between variables, but cannot conclude the causal relationship. Additional qualitative research or a larger sample size would be needed to validate the findings.
Conclusion
We conducted a time motion study to examine the relationship between nurses’ stress and perceived workload, and their association with particular nursing activities. Our study presents a unique data triangulation approach from continuous stress monitoring, perceived workload, and a time motion study, and could be replicable to other healthcare organizations or disciplines. The approach enriched our ability to detect EHR-related stress and was validated by nurses’ perceived physical demand and frustration. Our findings also showed that nurses’ perceived workload is a strong predictor of nurses’ stress as well as how they spent time with their patients. They also experienced higher perceived mental demand, physical demand, and temporal demand when they are assigned to more patients, regardless of patient acuity. Future studies should investigate the use of continuous stress monitor to identify potential support needed, as well as internal stress reduction techniques that could help with reducing perceived stress for nurses.
Acknowledgement
The project was supported by the Healthcare Innovation Lab at BJC HealthCare/Washington University School of Medicine. We especially appreciate the support from the study site, nurse managers, and nurses who participated in the study.
Figures & Table
References
- 1.Read-Brown S, Sanders DS, Brown AS, et al. Time-motion analysis of clinical nursing documentation during implementation of an electronic operating room management system for ophthalmic surgery. AMIA Annu Symp Proc. 2013;2013:1195–1204. [PMC free article] [PubMed] [Google Scholar]
- 2.Benner P, Sheets V, Uris P, Malloch K, Schwed K, Jamison D. Individual, practice, and system causes of errors in nursing: a taxonomy. J Nurs Adm. 2002;32(10):509–523. doi: 10.1097/00005110-200210000-00006. [DOI] [PubMed] [Google Scholar]
- 3.Clarke SP, Aiken LH. Failure to rescue. Am J Nurs. 2003;103(1):42–47. doi: 10.1097/00000446-200301000-00020. [DOI] [PubMed] [Google Scholar]
- 4.Ebright PR, Patterson ES, Chalko BA, Render ML. Understanding the complexity of registered nurse work in acute care settings. J Nurs Adm. 2003;33(12):630–638. doi: 10.1097/00005110-200312000-00004. [DOI] [PubMed] [Google Scholar]
- 5.Higuchi KA, Donald JG. Thinking processes used by nurses in clinical decision making. J Nurs Educ. 2002;41(4):145–153. doi: 10.3928/0148-4834-20020401-04. [DOI] [PubMed] [Google Scholar]
- 6.Potter P, Wolf L, Boxerman S, et al. An Analysis of Nurses’ Cognitive Work: A New Perspective for Understanding Medical Errors Advances in Patient Safety: From Research to Implementation (Volume 1: Research Findings) Rockville MD2005. [PubMed] [Google Scholar]
- 7.Wolf LD, Potter P, Sledge JA, Boxerman SB, Grayson D, Evanoff B. Describing nurses’ work: combining quantitative and qualitative analysis. Hum Factors. 2006;48(1):5–14. doi: 10.1518/001872006776412289. [DOI] [PubMed] [Google Scholar]
- 8.Tang Z, Mazabob J, Weavind L, Thomas E, Johnson TR. A time-motion study of registered nurses’ workflow in intensive care unit remote monitoring. AMIA Annu Symp Proc. 2006:759–763. [PMC free article] [PubMed] [Google Scholar]
- 9.Capuano T, Bokovoy J, Halkins D, Hitchings K. Work flow analysis: eliminating non-value-added work. J Nurs Adm. 2004;34(5):246–256. doi: 10.1097/00005110-200405000-00008. [DOI] [PubMed] [Google Scholar]
- 10.Blay N, Duffield CM, Gallagher R, Roche M. A systematic review of time studies to assess the impact of patient transfers on nurse workload. Int J Nurs Pract. 2014;20(6):662–673. doi: 10.1111/ijn.12290. [DOI] [PubMed] [Google Scholar]
- 11.Chan TC, Killeen JP, Vilke GM, Marshall JB, Castillo EM. Effect of mandated nurse-patient ratios on patient wait time and care time in the emergency department. Acad Emerg Med. 2010;17(5):545–552. doi: 10.1111/j.1553-2712.2010.00727.x. [DOI] [PubMed] [Google Scholar]
- 12.van Oostveen CJ, Gouma DJ, Bakker PJ, Ubbink DT. Quantifying the demand for hospital care services: a time and motion study. BMC Health Serv Res. 2015;15:15. doi: 10.1186/s12913-014-0674-2. [DOI] [PMC free article] [PubMed] [Google Scholar]
- 13.Sochalski J. Is more better?: the relationship between nurse staffing and the quality of nursing care in hospitals. Med Care. 2004;42(2 Suppl):II67–73. doi: 10.1097/01.mlr.0000109127.76128.aa. [DOI] [PubMed] [Google Scholar]
- 14.Colombo A, Solberg B, Vanderhoeft E, Ramsay G, Schouten HC. Measurement of nursing care time of specific interventions on a hematology-oncology unit related to diagnostic categories. Cancer Nurs. 2005;28(6):476–480. doi: 10.1097/00002820-200511000-00011. [DOI] [PubMed] [Google Scholar]
- 15.Garcia AL. Variability in Acuity in Acute Care. J Nurs Adm. 2017;47(10):476–483. doi: 10.1097/NNA.0000000000000518. [DOI] [PubMed] [Google Scholar]
- 16.Sakai Y, Yokono T, Mizokami Y, et al. Differences in the working pattern among wound, ostomy, and continence nurses with and without conducting the specified medical act: a multicenter time and motion study. BMC Nurs. 2016;15:69. doi: 10.1186/s12912-016-0191-1. [DOI] [PMC free article] [PubMed] [Google Scholar]
- 17.Nelson J, Valentino L, Iacono L, Ropollo P, Cineas N, Stuart S. Measuring workload of nurses on a neurosurgical care unit. J Neurosci Nurs. 2015;47(3):E9–19. doi: 10.1097/JNN.0000000000000136. [DOI] [PubMed] [Google Scholar]
- 18.Wong D, Bonnici T, Knight J, Gerry S, Turton J, Watkinson P. A ward-based time study of paper and electronic documentation for recording vital sign observations. J Am Med Inform Assoc. 2017;24(4):717–721. doi: 10.1093/jamia/ocw186. [DOI] [PMC free article] [PubMed] [Google Scholar]
- 19.Shanafelt TD, Dyrbye LN, Sinsky C, et al. Relationship Between Clerical Burden and Characteristics of the Electronic Environment With Physician Burnout and Professional Satisfaction. Mayo Clin Proc. 2016;91(7):836–848. doi: 10.1016/j.mayocp.2016.05.007. [DOI] [PubMed] [Google Scholar]
- 20.Shanafelt TD, Hasan O, Dyrbye LN, et al. Changes in Burnout and Satisfaction With Work-Life Balance in Physicians and the General US Working Population Between 2011 and 2014. Mayo Clin Proc. 2015;90(12):1600–1613. doi: 10.1016/j.mayocp.2015.08.023. [DOI] [PubMed] [Google Scholar]
- 21.Colligan L, Potts HW, Finn CT, Sinkin RA. Cognitive workload changes for nurses transitioning from a legacy system with paper documentation to a commercial electronic health record. Int J Med Inform. 2015;84(7):469–476. doi: 10.1016/j.ijmedinf.2015.03.003. [DOI] [PubMed] [Google Scholar]
- 22.Demerouti E, Bakker AB, Nachreiner F, Schaufeli WB. A model of burnout and life satisfaction amongst nurses. J Adv Nurs. 2000;32(2):454–464. doi: 10.1046/j.1365-2648.2000.01496.x. [DOI] [PubMed] [Google Scholar]
- 23.Gregory ME, Russo E, Singh H. Electronic Health Record Alert-Related Workload as a Predictor of Burnout in Primary Care Providers. Appl Clin Inform. 2017;8(3):686–697. doi: 10.4338/ACI-2017-01-RA-0003. [DOI] [PMC free article] [PubMed] [Google Scholar]
- 24.Harris DA, Haskell J, Cooper E, Crouse N, Gardner R. Estimating the association between burnout and electronic health record-related stress among advanced practice registered nurses. Appl Nurs Res. 2018;43:36–41. doi: 10.1016/j.apnr.2018.06.014. [DOI] [PubMed] [Google Scholar]
- 25.Moody LE, Slocumb E, Berg B, Jackson D. Electronic health records documentation in nursing: nurses’ perceptions, attitudes, and preferences. Comput Inform Nurs. 2004;22(6):337–344. doi: 10.1097/00024665-200411000-00009. [DOI] [PubMed] [Google Scholar]
- 26.Yen PY, Kelley M, Lopetegui M, et al. Understanding and Visualizing Multitasking and Task Switching Activities: A Time Motion Study to Capture Nursing Workflow. AMIA Annu Symp Proc. 2016;2016:1264–1273. [PMC free article] [PubMed] [Google Scholar]
- 27.Yen PY, Kelley M, Lopetegui M, et al. Nurses’ Time Allocation and Multitasking of Nursing Activities: A Time Motion Study. AMIA Annu Symp Proc. 2018;2018 [PMC free article] [PubMed] [Google Scholar]
- 28.Kalisch BJ, Aebersold M. Interruptions and multitasking in nursing care. Jt Comm J Qual Patient Saf. 2010;36(3):126–132. doi: 10.1016/s1553-7250(10)36021-1. [DOI] [PubMed] [Google Scholar]
- 29.Yen PY, Lara B, Lopetegui M, et al. Usability and Workflow Evaluation of “RhEumAtic Disease activitY” (READY). A Mobile Application for Rheumatology Patients and Providers. Appl Clin Inform. 2016;7(4):1007–1024. doi: 10.4338/ACI-2016-03-RA-0036. [DOI] [PMC free article] [PubMed] [Google Scholar]
- 30.Lopetegui M, Yen PY, Lai A, Jeffries J, Embi P, Payne P. Time motion studies in healthcare: what are we talking about? J Biomed Inform. 2014;49:292–299. doi: 10.1016/j.jbi.2014.02.017. [DOI] [PMC free article] [PubMed] [Google Scholar]
- 31.Lopetegui MA, Bai S, Yen PY, Lai A, Embi P, Payne PR. Inter-observer reliability assessments in time motion studies: the foundation for meaningful clinical workflow analysis. AMIA Annu Symp Proc. 2013;2013:889–896. [PMC free article] [PubMed] [Google Scholar]
- 32.Biovotion. What is Blood Pulse Wave? https://biovotion.zendesk.com/hc/en-us/articles/213581765-What-is-Blood-Pulse-Wave-. [Google Scholar]
- 33.Sutton-Tyrrell K, Najjar SS, Boudreau RM, et al. Elevated aortic pulse wave velocity, a marker of arterial stiffness, predicts cardiovascular events in well-functioning older adults. Circulation. 2005;111(25):3384–3390. doi: 10.1161/CIRCULATIONAHA.104.483628. [DOI] [PubMed] [Google Scholar]
- 34.Nichols WW. Clinical measurement of arterial stiffness obtained from noninvasive pressure waveforms. Am J Hypertens. 2005;18(1 Pt 2):3S–10S. doi: 10.1016/j.amjhyper.2004.10.009. [DOI] [PubMed] [Google Scholar]
- 35.Lehmann ED. Clinical value of aortic pulse-wave velocity measurement. Lancet. 1999;354(9178):528–529. doi: 10.1016/S0140-6736(99)00179-8. [DOI] [PubMed] [Google Scholar]
- 36.Lipman RD, Grossman P, Bridges SE, Hamner JW, Taylor JA. Mental stress response, arterial stiffness, and baroreflex sensitivity in healthy aging. J Gerontol A Biol Sci Med Sci. 2002;57(7):B279–284. doi: 10.1093/gerona/57.7.b279. [DOI] [PubMed] [Google Scholar]
- 37.Logan JG, Barksdale DJ, Carlson J, Carlson BW, Rowsey PJ. Psychological stress and arterial stiffness in Korean Americans. J Psychosom Res. 2012;73(1):53–58. doi: 10.1016/j.jpsychores.2012.04.008. [DOI] [PMC free article] [PubMed] [Google Scholar]
- 38.Vlachopoulos C, Kosmopoulou F, Alexopoulos N, Ioakeimidis N, Siasos G, Stefanadis C. Acute mental stress has a prolonged unfavorable effect on arterial stiffness and wave reflections. Psychosom Med. 2006;68(2):231–237. doi: 10.1097/01.psy.0000203171.33348.72. [DOI] [PubMed] [Google Scholar]
- 39.Vlachopoulos C, Xaplanteris P, Alexopoulos N, et al. Divergent effects of laughter and mental stress on arterial stiffness and central hemodynamics. Psychosom Med. 2009;71(4):446–453. doi: 10.1097/PSY.0b013e318198dcd4. [DOI] [PubMed] [Google Scholar]
- 40.Utsugi M, Saijo Y, Yoshioka E, et al. Relationship between two alternative occupational stress models and arterial stiffness: a cross-sectional study among Japanese workers. Int Arch Occup Environ Health. 2009;82(2):175–183. doi: 10.1007/s00420-008-0319-z. [DOI] [PubMed] [Google Scholar]
- 41.Lopetegui M, Yen PY, Lai AM, Embi PJ, Payne PR. Time Capture Tool (TimeCaT): development of a comprehensive application to support data capture for Time Motion Studies. AMIA Annu Symp Proc. 2012;2012:596–605. [PMC free article] [PubMed] [Google Scholar]
- 42.Simões L, Gonçalves J, Silva J. Mobile application for stress assessment. Paper presented at: 2017 12th Iberian Conference on Information Systems and Technologies (CISTI) 2017 21-24 June 2017. [Google Scholar]
- 43.Klaas VC, Calatroni A, Hardegger M, Guckenberger M, Theile G, Tröster G. Cham: 2017. Monitoring Patients in Ambulatory Palliative Care: A Design for an Observational Study. [Google Scholar]
- 44.Hart SG. Nasa-Task Load Index (NASA-TLX); 20 Years Later. Proceedings of the Human Factors and Ergonomics Society Annual Meeting. 2006;50(9):904–908. [Google Scholar]
- 45.QuadraMed A. Patient Classification Inpatient Methodology (version 84) Reston, VA2007. [Google Scholar]
- 46.Choi J, Choi JE, Fucile JM. Power up your staffing model with patient acuity. Nurs Manage. 2011;42(9):40–43. doi: 10.1097/01.NUMA.0000403278.96754.fb. [DOI] [PubMed] [Google Scholar]
- 47.Corporation Q. Nurse Staffing and Patient Outcomes: Bridging Research into Evidenced-Based Practice. 2014 [Google Scholar]
- 48.Lake ET, Staiger DO, Cramer E, et al. Association of Patient Acuity and Missed Nursing Care in U.S. Neonatal Intensive Care Units. Med Care Res Rev. 2018 doi: 10.1177/1077558718806743. 1077558718806743. [DOI] [PMC free article] [PubMed] [Google Scholar]
- 49.Ball JE, Murrells T, Rafferty AM, Morrow E, Griffiths P. ‘Care left undone’ during nursing shifts: associations with workload and perceived quality of care. BMJ Qual Saf. 2014;23(2):116–125. doi: 10.1136/bmjqs-2012-001767. [DOI] [PMC free article] [PubMed] [Google Scholar]
- 50.Tubbs-Cooley HL, Mara CA, Carle AC, Mark BA, Pickler RH. Association of Nurse Workload With Missed Nursing Care in the Neonatal Intensive Care Unit. JAMA Pediatr. 2019;173(1):44–51. doi: 10.1001/jamapediatrics.2018.3619. [DOI] [PMC free article] [PubMed] [Google Scholar]
- 51.Forsyth KL, Hawthorne HJ, El-Sherif N, et al. Interruptions Experienced by Emergency Nurses: Implications for Subjective and Objective Measures of Workload. J Emerg Nurs. 2018;44(6):614–623. doi: 10.1016/j.jen.2018.02.001. [DOI] [PubMed] [Google Scholar]
- 52.Loversidge J, Yen PY, Chipps E, Gallagher-Ford L, Genter L, Buck J. Top-of-License Nursing Practice, Part 2: Differentiating BSN and ADN Perceptions of Top-of-License Activities. J Nurs Adm. 2018;48(6):329–334. doi: 10.1097/NNA.0000000000000623. [DOI] [PubMed] [Google Scholar]
- 53.Buck J, Loversidge J, Chipps E, Gallagher-Ford L, Genter L, Yen PY. Top-of-License Nursing Practice: Describing Common Nursing Activities and Nurses’ Experiences That Hinder Top-of-License Practice, Part 1. J Nurs Adm. 2018;48(5):266–271. doi: 10.1097/NNA.0000000000000611. [DOI] [PubMed] [Google Scholar]
- 54.Vankipuram M, Kahol K, Cohen T, Patel VL. Toward automated workflow analysis and visualization in clinical environments. J Biomed Inform. 2011;44(3):432–440. doi: 10.1016/j.jbi.2010.05.015. [DOI] [PubMed] [Google Scholar]