Abstract
Bisphenol A (BPA) is suspected to be associated with several chronic metabolic diseases. The aim of the present study was to review previous epidemiological studies that examined the relationship between BPA exposure and the risk of obesity. PubMed, Web of Science, and Embase databases were systematically searched by 2 independent investigators for articles published from the start of database coverage until January 1, 2020. Subsequently, the reference list of each relevant article was scanned for any other potentially eligible publications. We included observational studies published in English that measured urinary BPA. Odds ratios with corresponding 95% confidence intervals for the highest versus lowest level of BPA were calculated. Ten studies with a sample size from 888 to 4793 participants met our inclusion criteria. We found a positive correlation between the level of BPA and obesity risk. A dose–response analysis revealed that 1-ng/mL increase in BPA increased the risk of obesity by 11%. The similar results were for different type of obesity, gender, and age.
Keywords: BPA/bisphenol A, obesity, child health, public health, meta-analysis
Introduction
Worldwide, the prevalence of obesity has increased significantly in recent decades alongside the risk of many obesity-associated chronic diseases, including type 2 diabetes and cardiovascular disease.1 This rapid and large increase in obesity prevalence cannot be attributed solely to genetic or previously recognized environmental risk factors, such as energy-intensive diets, sedentary lifestyle, or aging.2
A growing body of experimental and epidemiological evidence suggests that fetal programming of genetic systems might contribute to the risk of adult obesity and other components of metabolic syndrome.3 Specifically, new evidence has shown that epigenetic changes associated with man-made chemicals might interact with other factors to affect fetal and postnatal growth, contributing to obesity epidemic.4-6 This review focuses on the developmental effects of estrogenic endocrine-disrupting chemicals (EDCs); more specifically, this article examines the effects of exposure to estrogenic EDC bisphenol A (BPA) on adipocytes and their function, which might affect the risk of adult obesity. Moreover, BPA exposure has been associated with impaired reproductive capacity. Toxic environmental substances, in particular, the substances that disrupt endocrine function have recently attracted much attention due to their ability to interference with synthesis, secretion, transport, metabolism, and binding of hormones.7
Bisphenol A is used extensively worldwide in the manufacture of plastic polymers, such as polycarbonate plastics and epoxy resins, which are found in many consumer products (eg, toys, food and beverage containers, water supply pipes, medical tubing, and cigarette filters). Dietary ingestion is suspected to be the main route for human exposure, although dermal exposure can also occur from skin contact with thermal paper.8 Bisphenol A has been detected at measurable concentrations in urine samples of almost all persons tested worldwide. In addition, BPA has been detected in placental and amniotic fluids and human breast milk, suggesting that exposure starts in utero and may continue after birth via breastfeeding. Previous animal and epidemiological studies have suggested a link between low-dose exposure to EDCs and obesity risk.9 Bisphenol A has been of particular interest because it is widely used, which makes it a common exposure.
In vitro studies have shown that BPA enhances adipocyte cell differentiation, leading to excess fat accumulation. Concurrently, rodent studies have found BPA exposure to increase adipose tissue mass and promote weight gain.10 More recently, evidence of a relationship between BPA and obesity in humans has emerged; however, to date, these studies have been based on a small number of participants. Nevertheless, epidemiological studies based in the United States and China have reported positive associations between BPA and adiposity measures in adults.11,12 Moreover, as an estrogen-like compound, BPA has been shown to affect males and females differently in animal models,13 although evidence of sex differences in the association between BPA and obesity in humans is limited. This systematic review and meta-analysis aimed to examine the relationship between BPA and obesity, including a gender-stratified analysis.
Methods
This review follows the Preferred Reporting Items for Systematic Reviews and Meta-Analyses guidelines developed for systematic reviews of observational studies.14
Search Strategy
PubMed, Web of Science, and Embase databases were systematically searched by 2 independent investigators for articles published from the start of database coverage until January 1, 2020. The following search terms were used: (“obesity,” “fat,” or “overweight”) and (“BPA” or “bisphenol A”). In addition, reference lists included in each article were scanned for potentially eligible publications. Where data in the included articles were unclear or missing, the corresponding author was contacted by e-mail with a request for clarification. Unpublished studies were not included. Only articles published in English were eligible, and only full-text journal articles of original studies were considered.
Study Selection
Studies were eligible for inclusion if they met the following criteria: (1) BPA was the exposure of interest; (2) BPA was reported in ng/mL or μg/L; (3) obesity risk was reported using odds ratios (ORs), hazard ratios (HRs), or relative risk ratios (RRs) with the corresponding 95% confidence interval for the highest level versus lowest level of BPA exposure; (4) obesity or overweight was the outcome of interest; (5) the original study was a case–control, cross-section, or cohort study; and (6) for the dose–response analysis, the level of BPA per category was either provided or could be calculated.
If a study reported more than a single OR, HR, or RR, the ratio obtained after adjustment for the greatest number of covariates was used included in the pooled OR.
We excluded meta-analyses, reviews, case reports, articles for which the full text was not available, animal studies, studies lacking essential data, and other publications deemed irrelevant by the chief investigator.
Two investigators extracted the following data from each included article: first author’s name, publication year, country, geographic location, study design, average age, sample size (number of participants, controls, and cases), level of BPA exposure, and calculated OR, HR, or RR with their corresponding 95% confidence intervals (CIs). We extracted the OR, HR, and RR values achieved in calculations including the greatest number of covariates.
The same 2 investigators independently assessed the quality of each study using the Newcastle-Ottawa Scale.15 This scale scores a study on a scale from 0 to 9, whereby a score of 0 to 3, 4 to 6, and 7 to 9 corresponds to low, moderate, and high quality, respectively. Any discrepancies in data extraction or study quality assessment were resolved through a group discussion with a third investigator.
Statistical Analysis
Pooled estimates of ORs and the corresponding 95% CIs were calculated to assess the association between BPA and obesity risk by comparing the highest versus lowest level of BPA exposure. We evaluated heterogeneity using the Q test and I 2 statistic, with I 2 values of 25%, 50%, and 75% representing low, moderate, and high degrees of heterogeneity, respectively.16 If I 2 >50%, a DerSimonian and Laird random effects model was used; otherwise, a Mantel-Haenszel fixed effects model was used.17 Subgroup analyses were performed to evaluate the effect on outcome of modifying any potentially key covariates, stratified by gender.
We performed dose–response analyses for the association between BPA exposure and risk of obesity, using the method recommended by Greenland and Longnecker and the publicly available Stata code written by Orsini et al.18,19 We extracted the range or mean intake of BPA in each category, the number of cases and participants (or person-years) in each category, and the OR (or RR) with 95% CI. Where person-years or participant count per category was not reported, groups were assumed to be of equal size.20 If the data were not compared using the highest versus lowest level comparisons, an algorithm processor was used to transform a reference group, containing discrete correlated data.21 If neither median nor mean values were reported, we used the midpoint of the range. If the highest category was open ended, we considered the width of that category to be the same as the width of the adjacent category. If the lowest category was open ended, the lowest boundary was set to zero. We evaluated possible nonlinear associations between the intake of BPA and the risk of obesity using restricted cubic splines, with 3 knots at the 10th, 50th, and 90th percentile of the distribution. A P value for nonlinearity was calculated by testing the null hypothesis that the coefficient of the second spline was equal to zero.
A “leave-one-out” sensitivity analysis was used to evaluate whether the results would have been affected significantly by removing one study at a time. Publication bias was assessed using Egger test.22 All data were analyzed using statistical software Stata version 12.0 (StatCorp, College Station, Texas), and P values <.05 were considered statistically significant.
Results
Search Results, Study Characteristics, and Quality Assessment
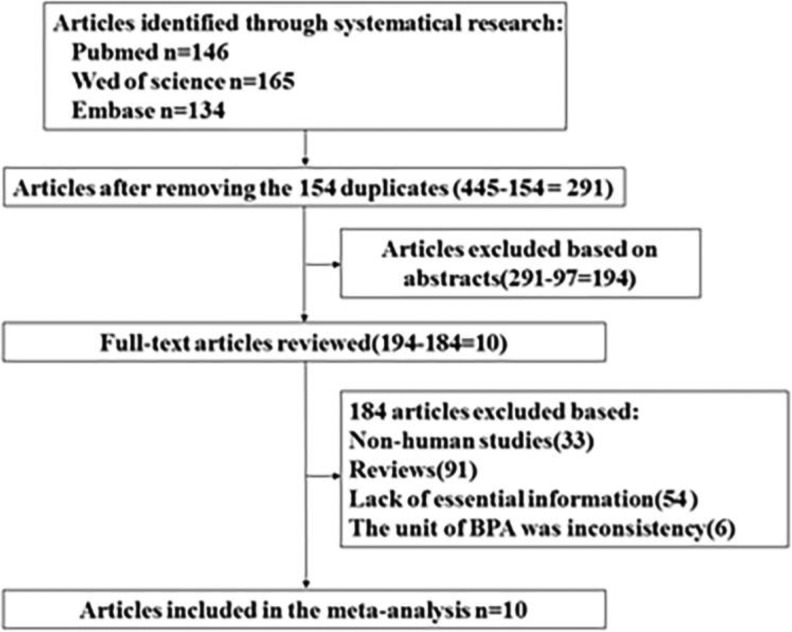
The study selection process and the results of our literature search are shown in Figure 1. We initially identified 413 articles in PubMed, Web of Science, and Embase databases. After excluding duplicates and studies that did not satisfy the inclusion/exclusion criteria, we identified 10 articles eligible for inclusion in the meta-analysis.
Figure 1.
Flow diagram depicting the screening and exclusion of publications included in meta-analysis.
Table 1 summarizes the characteristics of the 10 studies included in our analysis. The studies included a total of 27 993 participants. Six studies originated in the United States, a single study originated in Canada, and 3 studies originated in China. The quality score of all 10 publications ranged from 6 to 8, with a median score of 7.
Table 1.
Characteristics of the 10 Articles Included in Meta-Analysis.
| ID | Author, Year | Country | Study Design | Age Range (Years) | Paticipants | Level Comparison (Highest Vs Lowest) | Adjustment for Covariates | Quality Score |
|---|---|---|---|---|---|---|---|---|
| 1 | Wang et al12 | China | Cross-sectional study | 40 years or older | 3390 | Q4 vs Q1 | Adjusted2 | 8 |
| 2 | Trasande et al23 | United States | Cross-sectional study | 6 years or older | 2838 | Q4 vs Q1 | Adjusted2 | 7 |
| 3 | Do et al24 | Canada | Survey | 18-79 years | 4733 | Q4 vs Q1 | Adjusted2 | 7 |
| 4 | Shankar et al25 | United States | Survey | 20 years or older | 4792 | Q4 vs Q1 | Adjusted2 | 6 |
| 5 | Bhandari et al11 | United States | Survey | 6-18 years | 2200 | Q4 vs Q1 | Adjusted2 | 6 |
| 6 | Hao et al26 | China | Cohort | >40 years | 888 | T3 vs T1 | Adjusted2 | 7 |
| 7 | Liu et al27 | United States | Cross-sectional study | 20 years or older | 1709 | Q4 vs Q1 | Adjusted3 | 7 |
| 8 | Eng et al28 | United States | Cross-sectional study | 6-18 years | 3370 | Q4 vs Q1 | Adjusted2 | 8 |
| 9 | Carwile and Michels29 | United States | Cross-sectional study | 18-74 years | 2747 | Q4 vs Q1 | Adjusted2 | 7 |
| 10 | Li et al30 | China | Cross-sectional study | – | 1326 | Q4 vs Q1 | Adjusted2 | 6 |
Bisphenol A and Obesity Risk
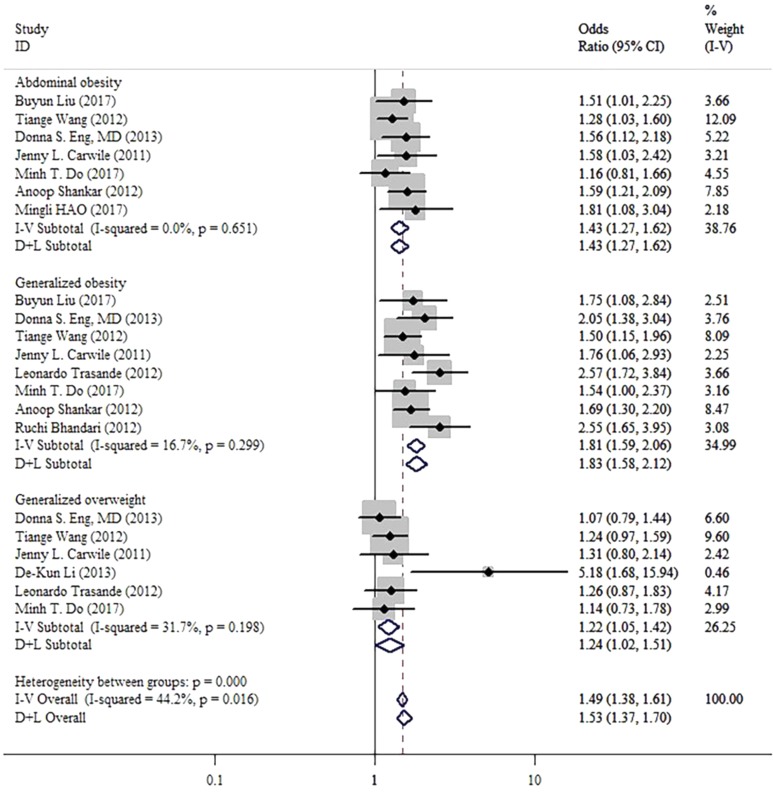
The pooled OR of obesity risk for the highest vs. lowest level of BPA exposure was 1.49 (95% CI: 1.38-1.61, I 2 = 44.2%, P = .016; Figure 2). This result shows a positive correlation between level of BPA and obesity.
Figure 2.
Forest plots summarizing the odds ratio (OR) of obesity for the highest versus the lowest category of bisphenol A (BPA).
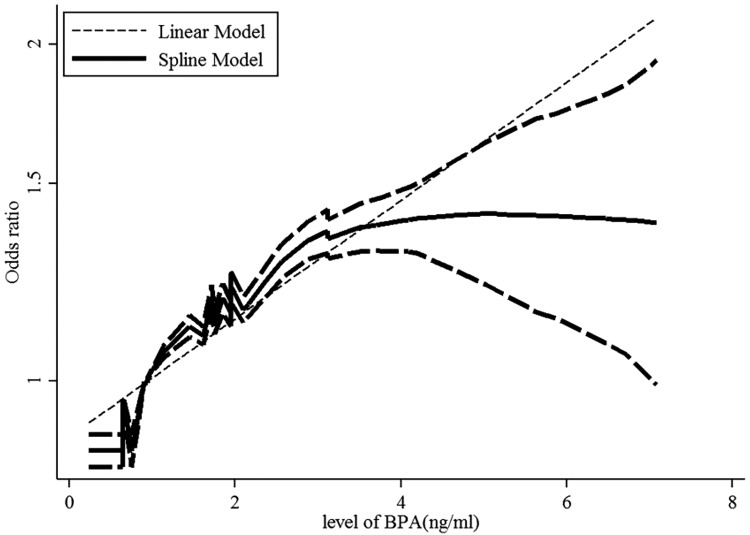
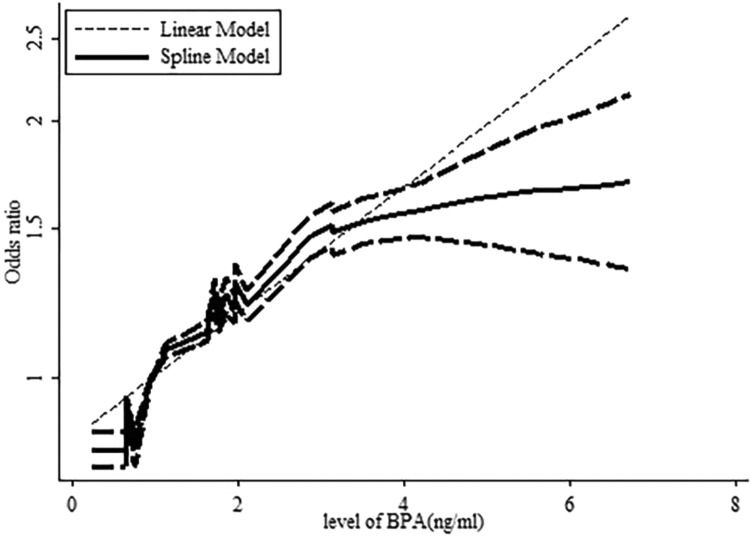
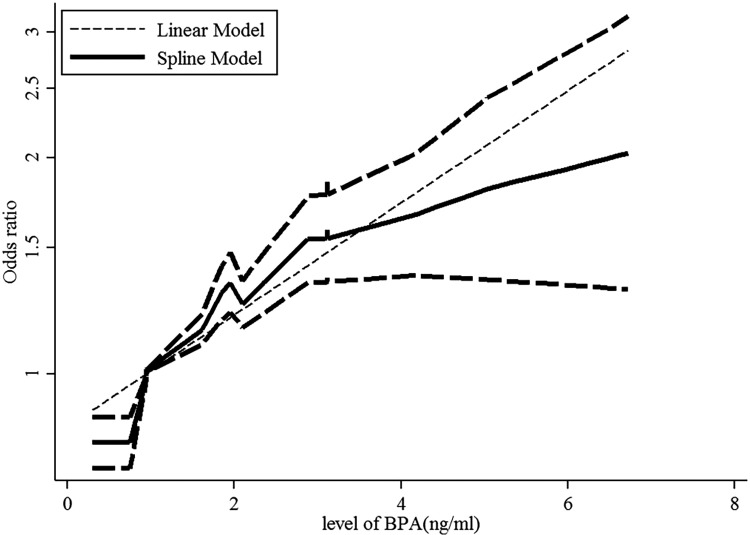
A dose–response analysis of these studies revealed that 1-ng/mL increase in BPA increased the risk of obesity by 11% (OR: 1.11; 95% CI: 1.10-1.13, P value for a linear trend test = .01). We found no evidence of a nonlinear association between BPA and obesity risk (P = .42; Figure 3).
Figure 3.
Dose–response relationships between obesity risk and the level of bisphenol A (BPA). *The solid line and dashed lines represent the estimated relative risk and 95% confidence interval. *The dotted line represents the linear fit to the data.
Subgroup Analysis
The results of subgroup analysis for types of obesity were consistent with overall results (abdominal obesity: OR: 1.43, 95% CI: 1.27-1.62, I 2 = 0%, P = .651; generalized obesity: OR: 1.81, 95% CI: 1.59-2.06, I 2 = 16.7%, P = .299; generalized overweight, OR: 1.22, 95% CI: 1.05-1.42, I 2 = 31.7%, P = .198).
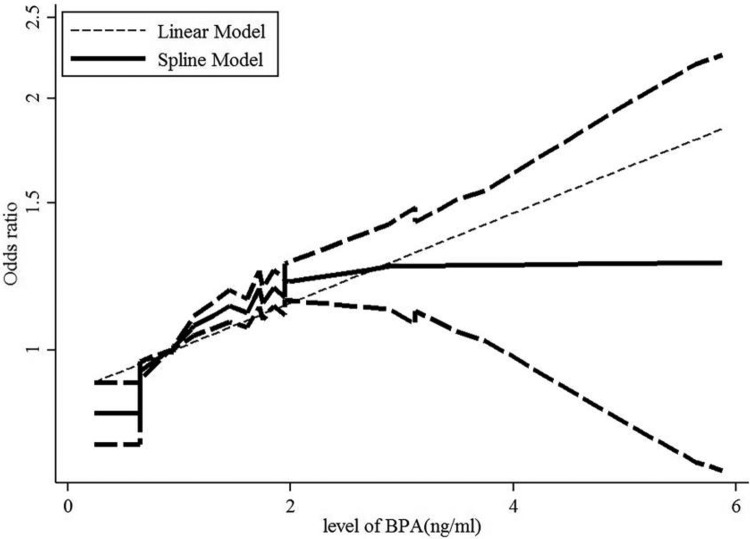
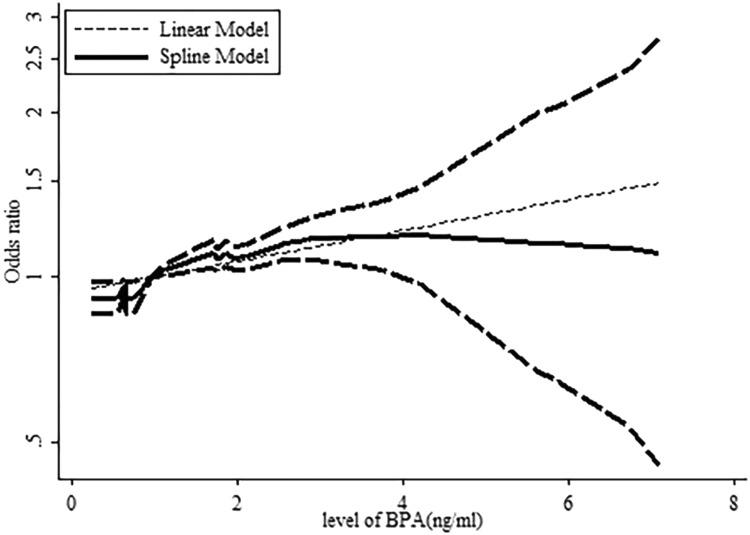
A dose–response analysis revealed that 1-ng/mL increase in BPA increased the risk of abdominal obesity by 12% (OR: 1.12, 95% CI: 1.09-1.14, P value for a linear trend test <.001). We found no evidence of a nonlinear association between BPA and abdominal obesity risk (P = .422; Figure 4). Moreover, a 1-ng/mL increase in BPA corresponded to a 16% increase in the risk of generalized obesity (OR: 1.16, 95% CI: 1.14-1.19, P value for a linear trend test <.001). We found evidence of a nonlinear association between BPA and generalized obesity risk (P = .024; Figure 5). Finally, 1-ng/mL increase in BPA increased the risk of generalized overweight by 5.8% (OR: 1.058, 95% CI: 1.034-1.084, P value for linear trend test <.001). We found no evidence of a nonlinear association between BPA and generalized overweight risk (P = .811; Figure 6).
Figure 4.
Dose–response relationships between abdominal obesity risk and the level of bisphenol A (BPA). *The solid line and dashed lines represent the estimated relative risk and 95% confidence interval. *The dotted line represents the linear fit to the data.
Figure 5.
Dose–response relationships between generalized obesity risk and the level of bisphenol A (BPA). *The solid line and dashed lines represent the estimated relative risk and 95% confidence interval. *The dotted line represents the linear fit to the data.
Figure 6.
Dose–response relationships between generalized overweight risk and the level of bisphenol A (BPA). *The solid line and dashed lines represent the estimated relative risk and 95% confidence interval. *The dotted line represents the linear fit to the data.
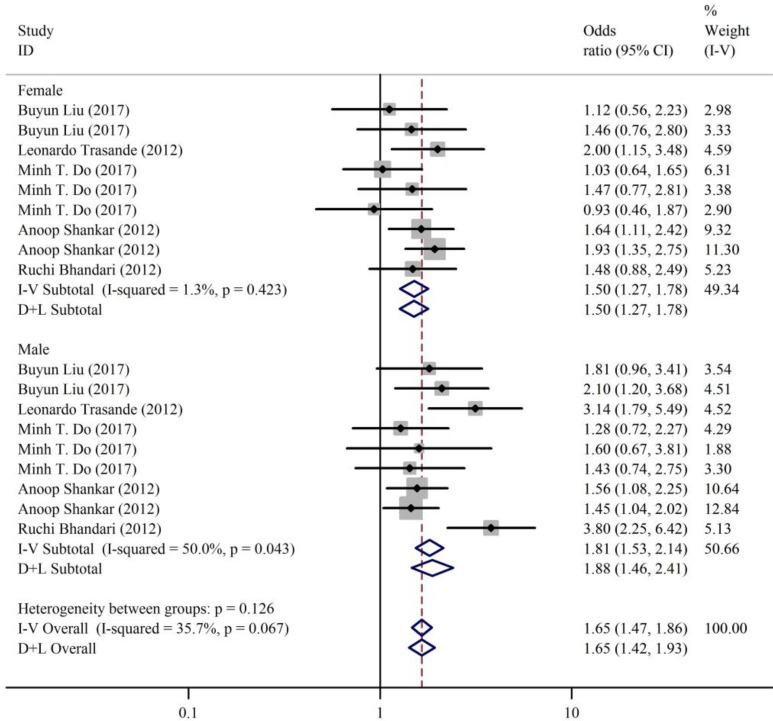
Stratified by gender, the results of subgroup analysis were consistent with the overall results (women: OR: 1.50, 95% CI: 1.27-1.78, I 2 = 1.3%, P = .423; men: OR: 1.81, 95% CI: 1.53-2.14, I 2 = 50.0%, P = .043; Figure 7).
Figure 7.
Forest plots summarizing the odds ratio (OR) of obesity for the highest versus the lowest category of bisphenol A (BPA) in different gender.
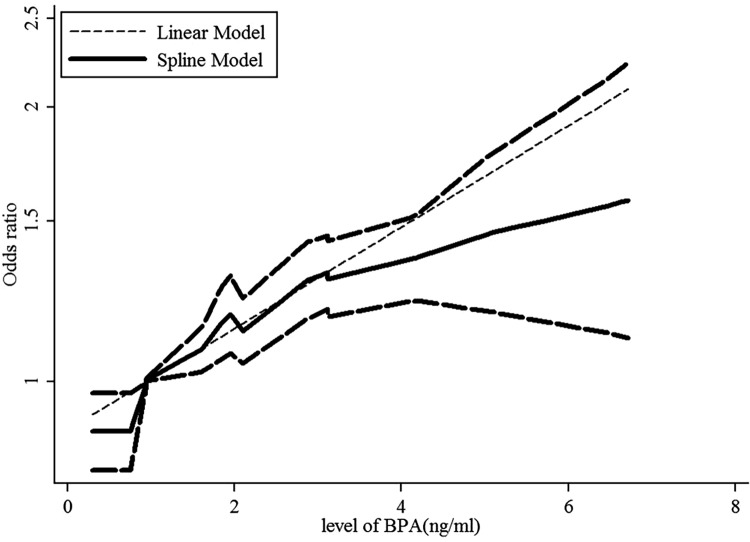
A dose–response analysis revealed that 1-ng/mL increase in BPA increased the risk of obesity by 11.9% in women (OR: 1.119, 95% CI: 1.087-1.152, P value for linear trend test <.001). We found no evidence of a nonlinear association between BPA and obesity risk in women (P = .187; Figure 8). Concurrently, 1-ng/mL increase in BPA increased the risk of obesity by 17.1% in men (OR: 1.171, 95% CI: 1.114-1.205, P value for linear trend test <.001). We found evidence of a nonlinear association between BPA and obesity risk in men (P = .044; Figure 9).
Figure 8.
Dose–response relationships between obesity risk and the level of bisphenol A (BPA) in female. *The solid line and dashed lines represent the estimated relative risk and 95% confidence interval. *The dotted line represents the linear fit to the data.
Figure 9.
Dose–response relationships between obesity risk and the level of bisphenol A (BPA) in male. *The solid line and dashed lines represent the estimated relative risk and 95% confidence interval. *The dotted line represents the linear fit to the data.
Age-stratified subgroup analysis revealed results consistent with the overall results (children: OR: 1.16, 95% CI: 1.14-1.19, I 2 = 0%, P = .665; adults: OR: 1.15, 95% CI: 1.11-1.19, I 2 = 0%, P = .492).
A dose–response analysis revealed that 1-ng/mL increase in BPA increased the risk of obesity by 17.1% in children (OR: 1.171, 95% CI: 1.136-1.206, P value for a linear trend test <.001). We found evidence of a nonlinear association between BPA and obesity risk (P = .037) in children. Finally, 1-ng/mL increase in BPA increased the risk of obesity by 14.9% in adults (OR: 1.149, 95% CI: 1.113-1.186, P value for linear trend test <.001). We found no evidence of a nonlinear association between BPA and obesity risk (P = .053) in adults.
Publication Bias
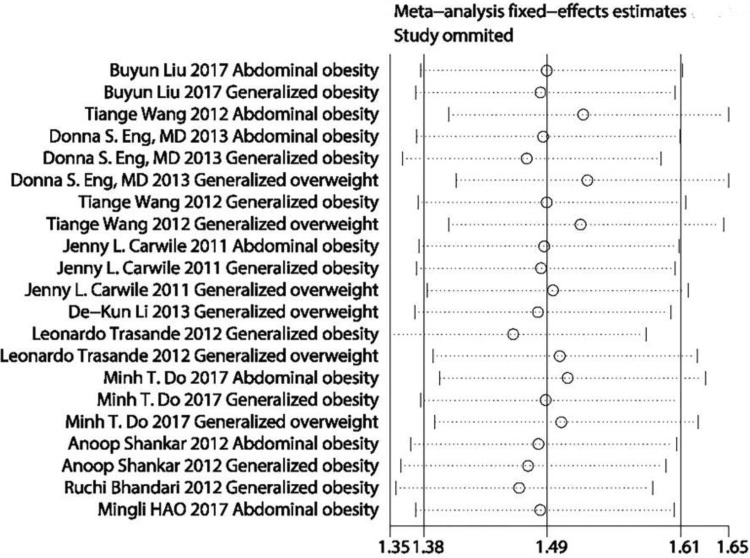
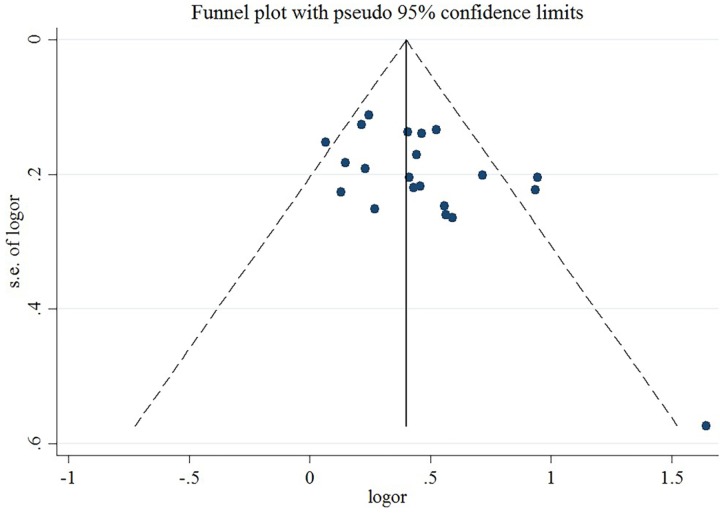
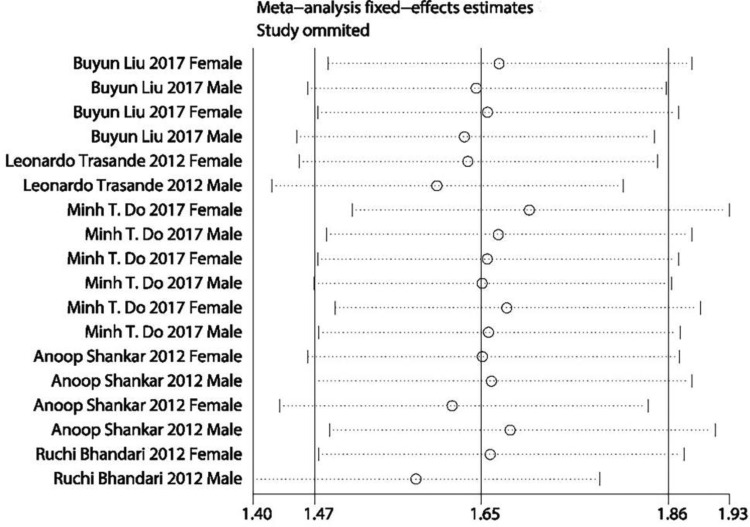
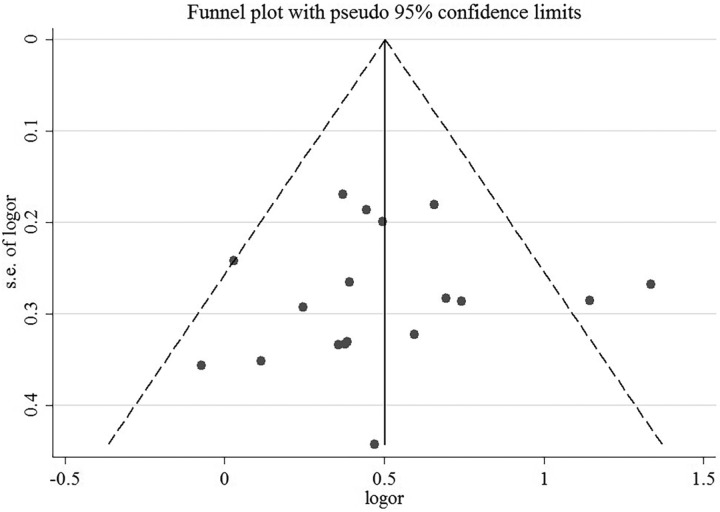
A sensitivity analysis revealed that no individual study affected the pooled effect size for type of obesity (Figure 10). There was no evidence of publication bias in the present meta-analysis (P = .050; Figure 11). In addition, no individual study affected the pooled effect size for gender (Figure 12), and no evidence of publication bias was found (P = .225) in gender-stratified analysis (Figure 13).
Figure 10.
A sensitivity analysis for data of different types of obesity.
Figure 11.
Funnel plot for data of different types of obesity.
Figure 12.
A sensitivity analysis for data of different gender.
Figure 13.
Funnel plot for data of different gender.
Discussion
Bisphenol A is a monomer of polycarbonate plastics and one of the highest volume chemicals used in commerce. Polycarbonate is used in numerous consumer products, including food and water containers, baby bottles, lining metal food and beverage cans, medical tubing, epoxy resins, and dental fillings. Small amounts of BPA can migrate from polymers and contaminate food or water, especially when heated. A significant number of previous studies have documented widespread human exposure to BPA. Bisphenol A, a lipophilic compound, can accumulate in fat and has been detected in 50% of breast adipose tissue samples collected from women worldwide. Bisphenol A levels ranging from 0.2 to 10 ng/mL (equivalent to ∼0.5-40 nM) have been detected in adult and fetal human plasma, urine, and breast milk.31
Bisphenol A is ubiquitous in our environment; therefore, BPA exposure can be considered a common environmental exposure. In fact, BPA has been detected in urine sample of over 90% of tested individuals.32 In the present meta-analysis, all participants had detectable levels of BPA in their urine sample. This systemic review and meta-analysis included 10 studies, revealing a clear correlation between the level of BPA exposure and risk of obesity.
Regarding the mechanism of action, most EDC effects are thought to result from their interaction with nuclear hormone receptors, including estrogen receptors (ERs), androgen, progesterone, thyroid, and retinoid receptors, among others.33 However, a growing body of evidence suggests that the exact mechanism of action is much more complex and that some EDCs might modulate nonnuclear steroid hormone receptors, or orphan receptors, such as the aryl hydrocarbon receptor.34 Other pathways that converge within the endocrine and reproductive systems are likely to be affected.35
From the structural point of view, EDCs are highly heterogeneous, although they have in common a phenol moiety that allows EDCs to interact with steroid hormone receptors as analogs or antagonists.34 In particular, BPA has 2 phenolic and 2 (4, 40)-OH substituents that allow it to create an ER-binding structure. Binding assays have demonstrated that BPA binds both ERa and ERb, although it has a higher affinity for the latter. Despite a relatively low affinity for both receptors, several studies have demonstrated that BPA can promote estrogen-like activities that are similar or stronger than activities elicited by 17β-estradiol.36 These low-dose responses result in part from the activation of rapid responses via nonclassical ER pathways or by a different BPA recruitment of coactivators or corepressors.37,38 In addition to its estrogenic activity, BPA has been shown in some studies to exhibit antithyroid39 and antiandrogenic activity,40 ability to bind to the human estrogen-related41 and pregnane receptor,42 and to stimulate the glucocorticoid receptor.43
Bisphenol A has been reported to alter several metabolic functions.36 However, a major limitation of these studies is use of micromolar doses of BPA. Until BPA is shown as active at environmentally relevant concentrations (within the low nanomolar range), it remains unclear whether it poses risks to human health. Moreover, BPA often exhibits a nonlinear dose-dependent relationship, following a U-shape or an inverted U-shape. Consequently, extrapolation of results such an action or lack of action of BPA at high doses to presumed bioactivity at low doses is unwarranted.
The present study finding on the positive and significant relationship between BPA in both sexes suggests that exposure to BPA might increase the risk of obesity. This finding is consistent with findings from some previous studies, showing that higher urinary BPA concentrations were associated with obesity.44 The following mechanism might account for this relationship between BPA exposure and obesity; releasing adiponectin and adipokine as a key protective factor against abdominal obesity might be inhibited by BPA exposure.
In the present meta-analysis, BPA was detected in all urine samples collected from both sexes. Bisphenol A exposure was significantly associated with indices of generalized and abdominal obesity. However, because of the cross-sectional nature of the data included in the present meta-analysis, the association found in this study cannot be considered causal; further longitudinal studies with larger sample sizes are necessary in this regard.
Acknowledgments
The authors would like to express our gratitude to Dr Yan Hong (Xi’an JiaoTong University) for his kindest contributions and assistances to this study. The authors thank China Northwest Cohort for providing ideas and financial support for this article. The authors would also like to acknowledge the platform and resources that Xi’an Jiao Tong University provides.
Authors’ Note: All analyses were based on previous published studies; thus, no ethical approval and patient consent are required.
Declaration of Conflicting Interests: The author(s) declared no potential conflicts of interest with respect to the research, authorship, and/or publication of this article.
Funding: The author(s) disclosed receipt of the following financial support for the research, authorship, and/or publication of this article: This research was supported by the Program for China Northwest Cohort Study of the National Key Research and Development Program of China (Grant Number: 2017YFC0907200, 2017YFC0907201) and Project of birth defect control and prevention in Shaanxi of the Shaanxi Health and Family Planning Commission (Grant Number: Sxwsjswzfcght2016-013).
ORCID iD: Wentao Wu  https://orcid.org/0000-0003-4417-9033
References
- 1. Lobstein T, Jackson-Leach R, Moodie ML, et al. Child and adolescent obesity: part of a bigger picture. Lancet. 2015;385(9986):2510–2520. [DOI] [PMC free article] [PubMed] [Google Scholar]
- 2. Qasim A, Turcotte M, De Souza R, et al. On the origin of obesity: identifying the biological, environmental and cultural drivers of genetic risk among human populations. Obes Rev. 2018;19(2):121–149. [DOI] [PubMed] [Google Scholar]
- 3. Entringer S, Buss C, Swanson JM, et al. Fetal programming of body composition, obesity, and metabolic function: the role of intrauterine stress and stress biology. J Nut Metabol. 2012;2012. [DOI] [PMC free article] [PubMed] [Google Scholar]
- 4. Elobeid MA, Allison DB. Putative environmental-endocrine disruptors and obesity: a review. Curr Opin Endocrinol Diabetes Obes. 2008;15(5):403. [DOI] [PMC free article] [PubMed] [Google Scholar]
- 5. Masuno H, Kidani T, Sekiya K, et al. Bisphenol A in combination with insulin can accelerate the conversion of 3T3-L1 fibroblasts to adipocytes. J Lipid Res. 2002;43(5):676–684. [PubMed] [Google Scholar]
- 6. Masuno H, Iwanami J, Kidani T, Sakayama K, Honda K. Bisphenol A accelerates terminal differentiation of 3T3-L1 cells into adipocytes through the phosphatidylinositol 3-kinase pathway. Toxicol Sci. 2005;84(2):319–327. [DOI] [PubMed] [Google Scholar]
- 7. Liu Y, Peterson KE. Maternal exposure to synthetic chemicals and obesity in the offspring: recent findings. Curr Environ Health Rep. 2015;2(4):339–347. [DOI] [PMC free article] [PubMed] [Google Scholar]
- 8. Wang Z, Liu H, Liu S. Low-dose bisphenol A exposure: a seemingly instigating carcinogenic effect on breast cancer. Adv Sci. 2017;4(2):1600248. [DOI] [PMC free article] [PubMed] [Google Scholar]
- 9. Legler J, Fletcher T, Govarts E, et al. Obesity, diabetes, and associated costs of exposure to endocrine-disrupting chemicals in the European Union. J Clin Endocrinol Metab. 2015;100(4):1278–1288. [DOI] [PMC free article] [PubMed] [Google Scholar]
- 10. Rönn M, Kullberg J, Karlsson H, et al. Bisphenol A exposure increases liver fat in juvenile fructose-fed Fischer 344 rats. Toxicology. 2013;303:125–132. [DOI] [PubMed] [Google Scholar]
- 11. Bhandari R, Xiao J, Shankar A. Urinary bisphenol A and obesity in US children. Am J Epidemiol. 2013;177(11):1263–1270. [DOI] [PMC free article] [PubMed] [Google Scholar]
- 12. Wang T, Li M, Chen B, et al. Urinary bisphenol A (BPA) concentration associates with obesity and insulin resistance. J Clin Endocrinol Metabol. 2012;97(2):E223–E227. [DOI] [PubMed] [Google Scholar]
- 13. Xu X, Dong F, Yang Y, Wang Y, Wang R, Shen X. Sex-specific effects of long-term exposure to bisphenol-A on anxiety-and depression-like behaviors in adult mice. Chemosphere. 2015;120:258–266. [DOI] [PubMed] [Google Scholar]
- 14. Moher D, Liberati A, Tetzlaff J, Altman DG. Preferred Reporting Items for Systematic Reviews and Meta-Analyses: the PRISMA statement. Int J Surg. 2010;8(5):336–341. [DOI] [PubMed] [Google Scholar]
- 15. Peterson J, Welch V, Losos M, Tugwell P. The Newcastle-Ottawa Scale (NOS) for Assessing the Quality of Nonrandomised Studies in Meta-Analyses. Ottawa, Ontario, Canada: Ottawa Hospital Research Institute; 2011. [Google Scholar]
- 16. Borenstein M, Higgins JP, Hedges LV, Rothstein HR. Basics of meta-analysis: I 2 is not an absolute measure of heterogeneity. Res Synth Methods. 2017;8(1):5–18. [DOI] [PubMed] [Google Scholar]
- 17. Tufanaru C, Munn Z, Stephenson M, Aromataris E. Fixed or random effects meta-analysis? Common methodological issues in systematic reviews of effectiveness. Int J Evid Based Healthc. 2015;13(3):196–207. [DOI] [PubMed] [Google Scholar]
- 18. Greenland S, Longnecker MP. Methods for trend estimation from summarized dose-response data, with applications to meta-analysis. Am J Epidemiol. 1992;135(11):1301–1309. [DOI] [PubMed] [Google Scholar]
- 19. Orsini N, Li R, Wolk A, et al. Meta-analysis for linear and nonlinear dose-response relations: examples, an evaluation of approximations, and software. Am J Epidemiol. 2011;175(1):66–73. [DOI] [PMC free article] [PubMed] [Google Scholar]
- 20. Bekkering GE, Harris RJ, Thomas S, et al. How much of the data published in observational studies of the association between diet and prostate or bladder cancer is usable for meta-analysis? Am J Epidemiol. 2008;167(9):1017–1026. [DOI] [PubMed] [Google Scholar]
- 21. Hamling J, Lee P, Weitkunat R, Ambühl M. Facilitating meta-analyses by deriving relative effect and precision estimates for alternative comparisons from a set of estimates presented by exposure level or disease category. Stat Med. 2008;27(7):954–970. [DOI] [PubMed] [Google Scholar]
- 22. Egger M, Smith GD, Schneider M, Minder C. Bias in meta-analysis detected by a simple, graphical test. BMJ. 1997;315(7109):629–634. [DOI] [PMC free article] [PubMed] [Google Scholar]
- 23. Trasande L, Attina TM, Blustein J. Association between urinary bisphenol A concentration and obesity prevalence in children and adolescents. JAMA. 2012;308(11):1113–1121. [DOI] [PubMed] [Google Scholar]
- 24. Do Minh T, Chang Vicky C, Mendez Michelle A. Urinary bisphenol A and obesity in adults: results from the Canadian health measures survey. Health Promot Chronic Dis Prev Can. 2017;37(12):403. [DOI] [PMC free article] [PubMed] [Google Scholar]
- 25. Shankar A, Teppala S, Sabanayagam C. Urinary bisphenol A levels and measures of obesity: results from the national health and nutrition examination survey 2003-2008. ISRN Endocrinol. 2012;2012:965243. [DOI] [PMC free article] [PubMed] [Google Scholar]
- 26. Hao M, Ding L, Xuan L, et al. Urinary bisphenol A concentration and the risk of central obesity in Chinese adults: a prospective study. J Diabet. 2018;10(6):442–448. [DOI] [PubMed] [Google Scholar]
- 27. Liu B, Lehmler H-J, Sun Y, et al. Bisphenol A substitutes and obesity in US adults: analysis of a population-based, cross-sectional study. Lancet Planet Health. 2017;1(3):e114–e122. [DOI] [PMC free article] [PubMed] [Google Scholar]
- 28. Eng DS, Lee JM, Gebremariam A, Meeker JD, Peterson K, Padmanabhan V. Bisphenol A and chronic disease risk factors in US children. Pediatrics. 2013;132(3):e637–e645. [DOI] [PMC free article] [PubMed] [Google Scholar]
- 29. Carwile JL, Michels KB. Urinary bisphenol A and obesity: NHANES 2003-2006. Environ Res. 2011;111(6):825–830. [DOI] [PMC free article] [PubMed] [Google Scholar]
- 30. Li DK, Miao M, Zhou Z, et al. Urine bisphenol-A level in relation to obesity and overweight in school-age children. PLoS One. 2013;8(6):9. [DOI] [PMC free article] [PubMed] [Google Scholar]
- 31. Fernandez SV, Huang Y, Snider KE, Zhou Y, Pogash TJ, Russo J. Expression and DNA methylation changes in human breast epithelial cells after bisphenol A exposure. Int J Oncol. 2012;41(1):369–377. [DOI] [PMC free article] [PubMed] [Google Scholar]
- 32. Sakhi AK, Lillegaard ITL, Voorspoels S, et al. Concentrations of phthalates and bisphenol A in Norwegian foods and beverages and estimated dietary exposure in adults. Environ Int. 2014;73:259–269. [DOI] [PubMed] [Google Scholar]
- 33. Swedenborg E, Rüegg J, Mäkelä S, Pongratz I. Endocrine disruptive chemicals: mechanisms of action and involvement in metabolic disorders. J Mol Endocrinol. 2009;43(1):1–10. [DOI] [PubMed] [Google Scholar]
- 34. Diamanti-Kandarakis E, Bourguignon JP, Giudice LC, et al. Endocrine-disrupting chemicals: an endocrine society scientific statement. Endocr Rev. 2009;30(4):293–342. [DOI] [PMC free article] [PubMed] [Google Scholar]
- 35. De Coster S, Van Larebeke N. Endocrine-disrupting chemicals: associated disorders and mechanisms of action. J Environ Public Health. 2012;2012:713696. [DOI] [PMC free article] [PubMed] [Google Scholar]
- 36. Alonso-Magdalena P, Rivera FJ, Guerrero-Bosagna C. Bisphenol-A and metabolic diseases: epigenetic, developmental and transgenerational basis. Environ Epigenet. 2016;2(3):dvw022. [DOI] [PMC free article] [PubMed] [Google Scholar]
- 37. Alonso-Magdalena P, Ropero AB, Soriano S, et al. Bisphenol-A acts as a potent estrogen via non-classical estrogen triggered pathways. Mol Cell Endocrinol. 2012;355(2):201–207. [DOI] [PubMed] [Google Scholar]
- 38. Welshons WV, Nagel SC, vom Saal FS. Large effects from small exposures. III. Endocrine mechanisms mediating effects of bisphenol A at levels of human exposure. Endocrinology. 2006;147(6):s56–s69. [DOI] [PubMed] [Google Scholar]
- 39. Moriyama K, Tagami T, Akamizu T, et al. Thyroid hormone action is disrupted by bisphenol A as an antagonist. J Clin Endocrinol Metab. 2002;87(11):5185–5190. [DOI] [PubMed] [Google Scholar]
- 40. Sohoni P, Sumpter J. Several environmental oestrogens are also anti-androgens. J Endocrinol. 1998;158(3):327–340. [DOI] [PubMed] [Google Scholar]
- 41. Takayanagi S, Tokunaga T, Liu X, Okada H, Matsushima A, Shimohigashi Y. Endocrine disruptor bisphenol A strongly binds to human estrogen-related receptor γ (ERRγ) with high constitutive activity. Toxicol Lett. 2006;167(2):95–105. [DOI] [PubMed] [Google Scholar]
- 42. Sui Y, Ai N, Park SH, et al. Bisphenol A and its analogues activate human pregnane X receptor. Environ Health Perspect. 2012;120(3):399–405. [DOI] [PMC free article] [PubMed] [Google Scholar]
- 43. Sargis RM, Johnson DN, Choudhury RA, Brady MJ. Environmental endocrine disruptors promote adipogenesis in the 3t3-l1 cell line through glucocorticoid receptor activation. Obesity. 2010;18(7):1283–1288. [DOI] [PMC free article] [PubMed] [Google Scholar]
- 44. Manikkam M, Tracey R, Guerrero-Bosagna C, Skinner MK. Plastics derived endocrine disruptors (BPA, DEHP and DBP) induce epigenetic transgenerational inheritance of obesity, reproductive disease and sperm epimutations. PLoS One. 2013;8(1):9. [DOI] [PMC free article] [PubMed] [Google Scholar]


