

Abstract
Background:
The coronavirus disease 2019 (COVID-19) pandemic challenges hospital leaders to make time-sensitive, critical decisions about clinical operations and resource allocations.
Objective:
To estimate the timing of surges in clinical demand and the best- and worst-case scenarios of local COVID-19–induced strain on hospital capacity, and thus inform clinical operations and staffing demands and identify when hospital capacity would be saturated.
Design:
Monte Carlo simulation instantiation of a susceptible, infected, removed (SIR) model with a 1-day cycle.
Setting:
3 hospitals in an academic health system.
Patients:
All people living in the greater Philadelphia region.
Measurements:
The COVID-19 Hospital Impact Model (CHIME) (http://penn-chime.phl.io) SIR model was used to estimate the time from 23 March 2020 until hospital capacity would probably be exceeded, and the intensity of the surge, including for intensive care unit (ICU) beds and ventilators.
Results:
Using patients with COVID-19 alone, CHIME estimated that it would be 31 to 53 days before demand exceeds existing hospital capacity. In best- and worst-case scenarios of surges in the number of patients with COVID-19, the needed total capacity for hospital beds would reach 3131 to 12 650 across the 3 hospitals, including 338 to 1608 ICU beds and 118 to 599 ventilators.
Limitations:
Model parameters were taken directly or derived from published data across heterogeneous populations and practice environments and from the health system's historical data. CHIME does not incorporate more transition states to model infection severity, social networks to model transmission dynamics, or geographic information to account for spatial patterns of human interaction.
Conclusion:
Publicly available and designed for hospital operations leaders, this modeling tool can inform preparations for capacity strain during the early days of a pandemic.
Primary Funding Source:
University of Pennsylvania Health System and the Palliative and Advanced Illness Research Center.
The COVID-19 pandemic challenges hospital leaders to make timely, critical decisions about clinical operations and allocation of resources. This discrete-time epidemic simulation using a SIR (susceptible, infected, removed) model estimates the timing of surges in clinical demand and the best- and worst-case scenarios of local COVID-19–induced strain on hospital capacity.
As of 23 March 2020, more than 350 000 cases of coronavirus disease 2019 (COVID-19) and 15 000 deaths had been reported worldwide. Most of these deaths are attributable to the virulence of severe acute respiratory syndrome-coronavirus-2 (SARS-CoV-2), the virus that causes COVID-19, but some may have been due to pandemic-associated surges that strain hospital capacity, defined as the ability of a hospital to deliver high-quality care to all who need it at a given time (1). In addition, underresourced health systems pose a threat not just to patient care, but also to the safety and well-being of health care workers. Thus, clinical operations leaders face significant uncertainty in making optimal decisions about staffing, bed expansions, ventilator purchase and repurposing, testing resources and strategies, personal protective equipment, elective procedures, visitation rules, and other resources.
Routine variations in capacity strain alter care processes and some clinical outcomes in the emergency department, hospital wards, and intensive care unit (ICU) (2–9). However, pandemic-induced strains on capacity far exceed levels observed during peaks in routine demand, requiring new frameworks to guide hospital investments in and allocations of resources to prevent grave consequences of strain.
To guide these decisions, the University of Pennsylvania Health System (UPHS) developed the COVID-19 Hospital Impact Model for Epidemics (CHIME), a susceptible, infected, removed (SIR) model. Borrowing from prior epidemiologic theory, CHIME predicts future population-level estimates of people who begin as susceptible and then may become infected, and removed (that is, either recovered and assumed to be immune or dead). Here, we report the operational dilemmas faced by our healthcare system leadership that motivated the construction of CHIME, the methods and assumptions behind the implementation of this SIR model, and how the interface was crafted and used to empower health system leaders to make decisions based on different scenarios under varying assumptions. The CHIME model and interface are available for public use (http://penn-chime.phl.io), and we describe how we will prospectively assess its performance in informing hospital capacity planning for the current and future epidemics.
Methods
We developed CHIME to forecast the course of COVID-19 in our region. In brief, SIR models provide insights into the dynamics of future disease spread in a population on the basis of currently observed local parameters, such as prevalence and doubling time. Because epidemic dynamics are sensitive to quarantine policies, testing availability, and other local factors, we constructed an interface to enable users to understand how variations in these parameters affect case projections. Although informed by similar explorations of epidemic trajectories in other settings worldwide (10–13), our CHIME tool was explicitly designed to be usable by and responsive to the needs of clinical operations leaders. Exploring local epidemic scenarios over a range of assumptions provided upper and lower bounds for predicted demands on health system capacity, as well as the time available to prepare to meet those demands.
We began by projecting the COVID-19–related demand for total hospital beds, ICU beds, and ventilators (for invasive mechanical ventilation for patients with expected acute respiratory distress syndrome), and the time to exceed current inpatient capacity in our health system's 3 hospitals located within Philadelphia. These 3 hospitals vary in size, resource-intensity, and training program integration. We could not reliably estimate the extent to which such policies as canceling elective admissions and surgeries would reduce demand among patients with other indications for hospitalization, so we chose to model demand only among patients with COVID-19. Thus, all model estimates underestimate the total demand for hospital resources.
Seeking to inform decisions around staffing, nonurgent clinical operations, and investment in additional resources, our health system executives raised time-sensitive operational questions to the Penn Medicine Predictive Healthcare team. Through an iterative process of model development by data scientists, use by operations leaders, and model refinement in response to use needs and local data, we created an interactive, Web-based tool to display the projected epidemic course and clinical demand across a broad range of assumptions about triage and disease spread.
Study Motivation and Process
To predict the expected volume and acuity, and when to expect it for hospital executives, data scientists started with publicly available epidemiologic data on COVID-19 and supplemented this with UPHS-specific clinical outcomes data derived from existing analytic data sets of similar acute respiratory failure populations over the past 6 years at multiple Penn hospitals. Clinicians and clinician-researchers provided the model developers on the data science team with insight into the model inputs and assumptions most subject to variation or inaccuracy and provided adequate ranges of plausible estimates. Through a series of discussions and iterative development of the Web-based tool, CHIME was developed to be as simple as possible while providing actionable information for high-stakes decisions in preparing for the expected COVID-19 epidemic in our region.
Epidemic Model
The SIR model is a compartmental approach to epidemic spread that represents a population of individuals who transition from susceptible, to infected, to removed (recovered and immune or deceased) states (14). By specifying values of initial disease prevalence, population size, time to recovery, and transmission rate, the SIR model makes deterministic predictions about the number of future infections over time. First, on the basis of published case series from China and other regions reporting on the clinical course of observed patients early in the epidemic (15–18) and local information about the regional population (Table 1) served at the 3 hospitals in our health system, we used the SIR framework to model the number and rate of infections in the regional population. Next, we extended these projections of the total number of cases to estimate the proportion of patients with COVID-19 who would require hospital resources (hospitalizations, ICU care, invasive mechanical ventilation). We then conducted a Monte Carlo simulation instantiation of an SIR model with a 1-day cycle with 1000 draws from probability distributions of model parameters. The Supplement (available at Annals.org) provides the details of the equations and parameters underlying the CHIME SIR model.
Table 1. Model Parameters, Ranges, and Data Sources.

Although other approaches to epidemic modeling exist, SIR was chosen for simplicity and speed of deployment. Given substantial uncertainty regarding input parameters for more complicated models and the need to communicate and iterate rapidly with decision makers, we opted not to incorporate more transition states to model infection severity, social networks to model transmission dynamics, or geographic information to account for spatial patterns of human interaction. We recognize that these approaches could offer greater fidelity to known epidemic dynamics but would have come at the cost of slower development, be less clinically intuitive or interpretable, and have greater uncertainty in model inputs.
Outcomes
The primary outputs of the CHIME model are the total counts of expected demand for hospital beds, ICU beds, and ventilators over time at the 3UPHS hospitals in Philadelphia for patients with COVID-19. Secondary outcomes derived from the CHIME model outputs included the number of new admissions each day, the time until demand would exceed current capacity, the time until peak demand, the time spent above current capacity, and the proportion of simulations in each scenario in which capacity was exceeded. We used aggregate counts of existing capacity across the 3 hospitals to accommodate anticipated resource allocation and patient diversions between hospitals (18). Current capacity across the 3 hospitals was defined as 1045 hospital beds, 253 ICU beds, and 183 ventilators, on the basis of internal estimates.
Model Parameters
In the absence of robust historical data on the transmission dynamics of SARS-CoV-2, we surveyed the available literature to identify likely ranges of SIR model parameters (Table 1 ). Table 1 of the Supplement (available at Annals.org) reports further details on these parameters, their ranges, and their distributions. In the base-case analysis, we sampled from continuous distributions for all parameters with a fixed doubling time of 6 days (Td = 6), consistent with estimated observed rates of spread elsewhere (10, 15, 23). We generated 95% CIs by taking the 2.5% and 97.5% percentile estimates from 1000 simulations to account for uncertainty in the forecasts. All simulations and analyses were conducted by using Python, version 3.7.6 (24), and R, version 3.6.1 (25).
Sensitivity Analyses
To understand how the doubling time would affect hospital capacity directly, we varied key assumptions about the doubling time in sensitivity analyses. Specifically, we repeated the primary analysis across the range of doubling times reported in the literature, from a best-case scenario (Td = 10; for example, South Korea) and to a worst-case scenario (Td = 2; for example, Italy) to examine their effect on the time until peak clinical demand and the duration of time spent above existing capacity of the 3 hospitals. We conducted a separate sensitivity analysis to estimate peak simultaneous ventilator demand by varying the proportion of cases requiring invasive mechanical ventilation to simulate how the local age distribution in the Philadelphia region might affect capacity strain (17).
Forecasting Comparisons
For cross-validation with other models, we compared the predictions from CHIME with those from other COVID-19–specific epidemic forecasting tools (12, 13). Although the interfaces, input variables, and underlying models varied in each case, we attempted to replicate the inputs from our base case as closely as possible. We compared these models' forecasts for the time to the peak number of infections and the number of people infected at the peak.
Role of the Funding Source
This study was funded by UPHS and the Palliative and Advanced Illness Research Center. It did not meet the definition of human subjects research. The authors, who are employed by or work within the funding sources, conducted the study independently, and the decision to submit the manuscript for publication was theirs alone.
Results
In the base case, the model projected the needed capacity for hospitalization would reach a peak of 4467 (95% CI, 1738 to 8966) patients with COVID-19 across the 3 hospitals, with 487 (CI, 116 to 1106) patients requiring ICU beds and 170 (CI, 45 to 632) patients requiring ventilators (Figure 1). At the peak of incident cases, the model projected 386 (CI, 160 to 776) total hospital admissions per day, with 61 (CI, 15 to 131) admissions requiring ICU care and 28 (CI, 7 to 93) admissions requiring ventilators (Figure 1 of the Supplement, available at Annals.org). The time until peak hospitalizations in the base case was 56 days (CI, 48 to 62 days) and ranged from 20 days (CI, 18 to 22 days) to 73 days (CI, 75 to 99 days) in the worst and best cases, respectively.
Figure 1.
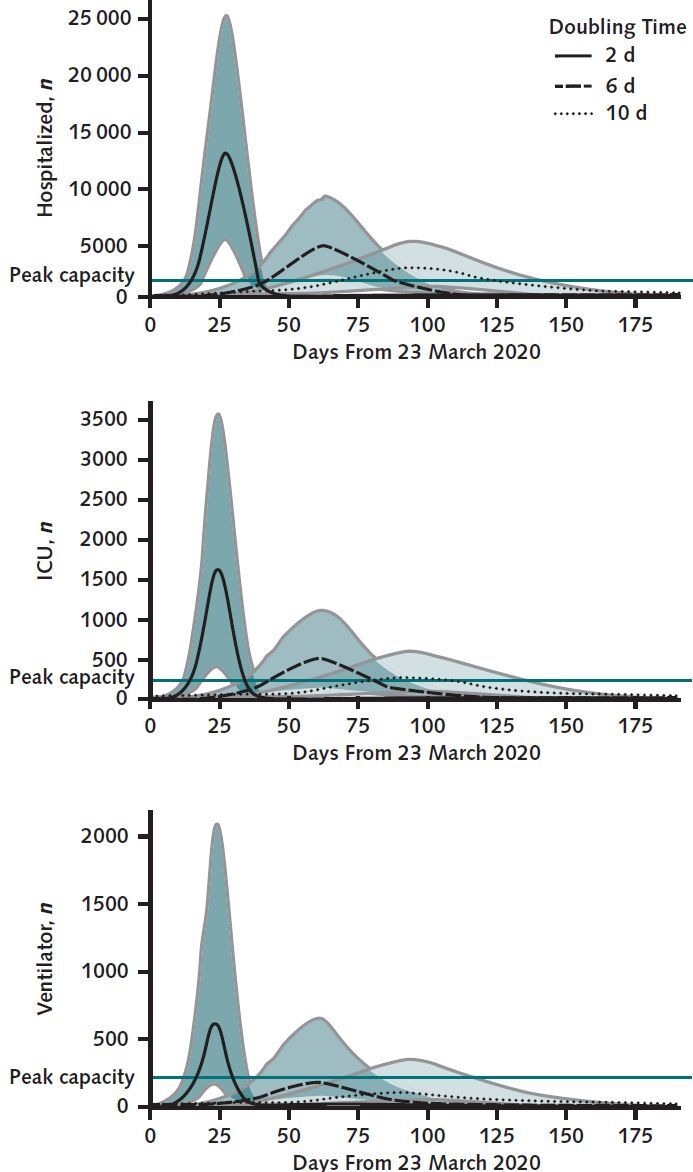
Projected daily total hospital census (top), intensive care unit ICU census (middle), and patients requiring invasive mechanical ventilation (bottom) for patients with COVID-19.
Shaded regions represent 2.5% and 97.5% percentiles across 1000 simulations representing upper and lower bounds on likely scenarios. The gray horizontal lines indicate current health system capacity. ICU = intensive care unit.
In the worst-case scenario (Td = 2 days), the peak simultaneous demand across the 3 hospitals was 12 650 (CI, 5072 to 25 348) total occupied hospital beds, including 1608 (CI, 386 to 3596) ICU beds and 599 (CI, 161 to 2130) ventilators (Figure 1). In this scenario, we estimated a 100% probability of exceeding current capacity for total hospital beds, ICU beds, and ventilators due only to patients with COVID-19.
In the best-case scenario (Td = 10 days), the peak simultaneous demand across the 3 hospitals was 3131 (CI, 908 to 4707) total occupied hospital beds, including 338 (CI, 60 to 576) ICU beds and 118 (CI, 23 to 327) ventilators (Figure 1). Even in this best-case scenario, CHIME estimated a 99.6%, 40%, and 10% probability of exceeding current capacity for total hospital beds, ICU beds, and ventilators, respectively—again, only from patients with COVID-19.
In the base case, our health system had a 50% chance of exceeding our full ventilator capacity due to patients with COVID-19 (Figure 2). Across the range of doubling times, however, the time until ventilator capacity would be exceeded was 16 days (CI, 11 to 21 days) in the worst-case scenario and was unlikely to occur in the best-case scenario. CHIME estimated similar trajectories for the times until the capacities of hospital (Figure 2 of the Supplement, available at Annals.org) and ICU beds (Figure 3 of the Supplement, available at Annals.org) were exceeded.
Figure 2.

Results of sensitivity analysis.
A range of epidemic scenarios based on incident doubling time from worst (2 days) to best (10 days), with a base case of 6 days plotted against current hospital resources, are shown. The green subaxis represents the probability of exceeding current capacity.
In the base case, the expected duration of time over which current capacity would be exceeded was 44 days (CI, 20 to 60 days) for hospital beds, 32 days (CI, 7 to 53 days) for ICU beds, and 23 days (CI, 8 to 66 days) for ventilators in those 50% of simulations where capacity was exceeded (Figure 2).
In varying the proportion of patients who would ultimately require invasive mechanical ventilation, we identified a nearly 6-fold difference in the expected peak simultaneous demand for ventilators (Figure 3). In a scenario in which all patients in the ICU with COVID-19 required invasive mechanical ventilation, the peak simultaneous demand would exceed 1200 ventilators.
Figure 3.
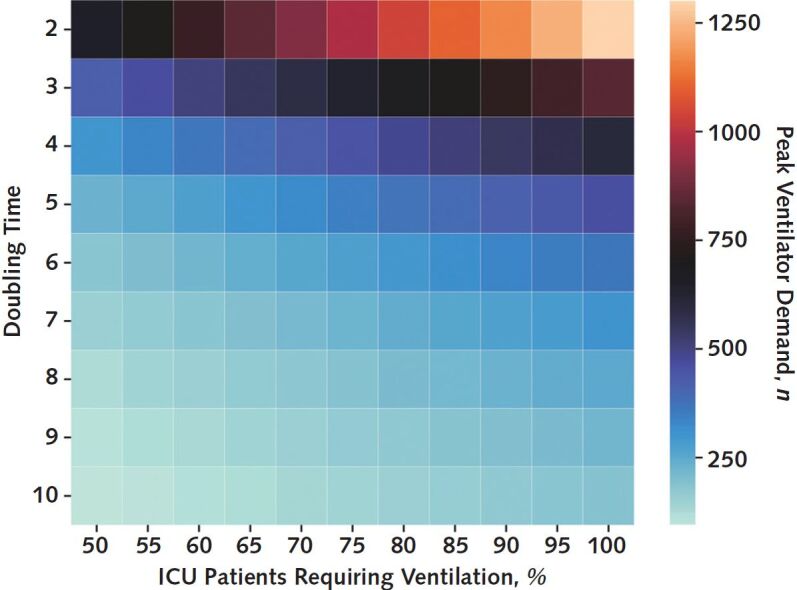
Peak simultaneous demand for ventilators depending on the epidemic doubling time and the percentage of patients with COVID-19 in the intensive care unit (ICU) requiring invasive mechanical ventilation.
Cross-Model Comparisons
The total number of infected cases in the region peaked at 63 days in the CHIME base case, compared with 62 days in the Goh model (13) and at 116 days in the Hill model (12). Despite limitations in the other model interfaces that prevented precise reproduction of CHIME's input parameters, similar starting values led to forecasted peak case counts of 125 498 (Goh model, 75% of CHIME estimate) and 106 584 (Hill model, 64% of CHIME estimate) compared with the predicted CHIME peak of 166 268 cases (Table 2 of the Supplement, available at Annals.org). Counts of the susceptible, infected, and removed populations over time are reported in Figure 4 of the Supplement (available at Annals.org).
Discussion
We found that an SIR model could be used to make short-term projections about hospital capacity strain early in the course of an epidemic. With close collaboration between the clinical and operational leaders of our health system and data science team, we were able to rapidly explore a range of scenarios based on published data from other regions of the world. Indeed, only 2 days passed from the time at which operations leaders requested “projections” to the time at which we had a flexible, user-friendly interface to provide best- and worst-case estimates in real time.
The rapid development and data visualizations provided by CHIME to estimate clinical needs for patients with COVID-19 directly informed our health system's planning for its 3 city-based hospitals in several ways (Table 2). First, the model projections provided support for financially, operationally, and logistically challenging decisions, such as reducing elective surgeries and declining outside transfers, well before our system was actually strained. Such early action is clearly superior for pandemic preparedness and response, but absent such projections, may only have been recognized in hindsight. In addition, these projections helped generate consensus among clinical leaders that these difficult decisions were prudent.
Table 2. Overview of Operational Questions, Relevant Modeling Output, and Subsequent Decisions.

Second, because the projections painted an extreme picture, even without considering clinical needs unrelated to COVID-19, we were motivated to expand surge planning and to explore novel options for building capacity, including unconventional care spaces. Specific surge planning stages that were informed by the model outputs included decreasing current acute care volume (non–COVID-19 and COVID-19) by keeping patients who were less sick out of the hospital and canceling elective surgeries and admissions; dedicating units to COVID-19–only (cohort) care; personal protective and ventilator equipment conservation and acquisition; expanding ICU care into ICU-like care spaces (such as operating rooms); expanding ICU care into wards; expanding ward care into unused clinical spaces (for example, newly built but not yet opened hospital floors and a previously closed wing of our long-term acute care hospital); expanding ward care into ward-like care spaces (dialysis and apheresis units); doubling single rooms; expanding ICU and ward care into noncare spaces (such as building lobbies); reserving off-site rooms, such as hotels, for front-line clinicians; and establishing COVID-19–specific triage units in the emergency department.
Third, on the basis of these projections, our health system successfully petitioned the Pennsylvania government for a waiver from its prohibition on continued operation of construction companies. An additional hospital tower under construction was planned for completion in 15 months, but because construction has been allowed to continue around the clock, 119 new hospital beds will become usable during the projected surge. In short, we anticipate that the epidemic insights gained from CHIME will save many lives by turning vague scenarios of overwhelming clinical demand into actionable estimates of strain, permitting our health system leaders to prepare, react, and respond.
The CHIME-forecasted peak occurred at nearly the same day as that of the Goh model, but much earlier than the Hill model, and included a much larger number of infections than both models. Possible reasons for these differences include the impossibility of aligning input parameters exactly across models, and the fact that both external models incorporated an additional transition state ′E to describe exposed populations who were not yet symptomatic and separate states to account for differential severity of infection. Thus, generating estimates using multiple models may help clinical leaders properly account for uncertainty in all forecasts.
Our study has limitations. First, the SIR model itself is a simplified epidemic model that does not account for the structure of contact networks and resultant transmission. This may be particularly important in the case of COVID-19, because of rapidly shifting regional policies on physical distancing, school and university closures, cancellation of public gatherings, and shelter-in-place advisories. Although we could not account for these dynamics directly in the model itself, differences in rates of interpersonal contact and disease transmission attributable to physical distancing policies were indirectly modeled through the broad range of doubling times used in our sensitivity analyses. In particular, the mass action mixing assumption in CHIME, in which all members of the population are assumed to mix homogeneously with each other, may overestimate the final size of the epidemic (26) as well as produce a steeper decline in cases after peak (27).
Second, this model accounted for hospital demand due only to patients with COVID-19 presenting to 3 hospitals in our health system. Modeling only the needs for patients with COVID-19 would cause these projections to underestimate the total true demand on health system resources. However, other phenomena may cause our approach to over- or underestimate the true demand, including the possibility of different regional outbreaks of COVID-19, varying demand for non–COVID-19-related hospital services with elimination of elective cases, and disruption of usual outpatient care for patients with acute and chronic illnesses. We also expect that the role of suburban hospitals may change as they manage local cases of COVID-19 in less densely populated areas or serve as a reservoir of ICU capacity as regionalization policies seek to offload strain from urban hospitals. These uncertainties will be incorporated into subsequent versions of CHIME as epidemic patterns and local care practices emerge in the coming weeks.
Third, model parameters were sampled from distributions that were fit from published data across heterogeneous populations and hospitals, and thus may not correspond to those found in Philadelphia or any other region. We did, however, explore the full range of published parameters through simulation and provided estimates of uncertainty to guide decision making. We will also continue to use data that accrue on the local level to inform iterative model revisions. In addition, we plan to validate the model projections presented here to inform hospital planning strategies in the event of future epidemics. Each day, we will update time-varying parameters, such as the number of cases reported by the Pennsylvania Department of Health and the number of infected patients within our health system, to make predictions about future hospital demand at 7-, 14-, 28-, and 56-day time horizons. As we monitor the epidemic progress in real time, including expected changes in the doubling time, we will then assess the performance of these predictions for hospital, ICU bed, and ventilator demand, at each week by using the mean-squared error.
Fourth, the model does not distinguish between patients who have recovered from COVID-19 infection and those who died of it. Although this distinction probably has only a small impact on forecasting short-term hospital needs, it may have considerable importance for forecasting post–acute care needs, future hospital needs, and overall population health. Thus, CHIME should not be used for estimating the latter types of needs. As more data are gathered on the dynamics of the COVID-19 epidemic, it will become more feasible to parameterize increasingly complex models to account for immunity, exposure periods, and death (28–30).
In conclusion, an SIR epidemic model can be quickly parameterized on the basis of early published case series and adapted to local population characteristics to inform hospital planning for epidemic-related surges in need for hospital capacity. Close collaborations between hospital operational leaders and data scientists can yield visualization tools to explore a range of scenarios, balancing tradeoffs between model complexity, interpretability, and actionable interventions. Further work is needed to prospectively validate this model and to further refine analytic approaches that inform planning strategies for future epidemics.
Biography
Acknowledgment: The authors thank Barry Fuchs, MD, MS, and Jack Gutsche, MD, for their insights into critical care operations and resources at our health system, and to all of the open source contributions to the CHIME tool from members of Code for Philly (https://github.com/CodeForPhilly/chime/graphs/contributors).
Disclosures: Dr. Anesi reports pending payment for authoring chapter “Coronavirus Disease 2019 (COVID-19): Critical Care Issues” for UpToDate outside the submitted work. Dr. Christie reports grants from the National Institutes of Health during the conduct of the study, and grants from the National Institutes of Health, GlaxoSmithKline, and Bristol-Myers Squibb and personal fees from Onspira and Magnolia outside the submitted work. Authors not named here have disclosed no conflicts of interest. Disclosures can also be viewed at www.acponline.org/authors/icmje/ConflictOfInterestForms.do?msNum=M20-1260.
Editors' Disclosures: Christine Laine, MD, MPH, Editor in Chief, reports that her spouse has stock options/holdings with Targeted Diagnostics and Therapeutics. Darren B. Taichman, MD, PhD, Executive Editor, reports that he has no financial relationships or interests to disclose. Cynthia D. Mulrow, MD, MSc, Senior Deputy Editor, reports that she has no relationships or interests to disclose. Jaya K. Rao, MD, MHS, Deputy Editor, reports that she has stock holdings/options in Eli Lilly and Pfizer. Christina C. Wee, MD, MPH, Deputy Editor, reports employment with Beth Israel Deaconess Medical Center. Sankey V. Williams, MD, Deputy Editor, reports that he has no financial relationships or interests to disclose. Yu-Xiao Yang, MD, MSCE, Deputy Editor, reports that he has no financial relationships or interest to disclose.
Reproducible Research Statement: Study protocol, statistical code, and data set: All of the code for CHIME is publicly available under an open source license (https://github.com/CodeForPhilly/chime/).
Corresponding Author: Gary E. Weissman, MD, MSHP, Perelman School of Medicine, University of Pennsylvania, 306 Blockley Hall, 423 Guardian Drive, Philadelphia, PA 19104-6021; e-mail, gary.weissman@pennmedicine.upenn.edu.
Current Author Addresses: Dr. Weissman: Perelman School of Medicine, University of Pennsylvania, 306 Blockley Hall, 423 Guardian Drive, Philadelphia, PA 19104-6021.
Dr. Crane-Droesch: Palliative and Advanced Illness Research Center, Perelman School of Medicine, University of Pennsylvania, 300 Blockley Hall, 423 Guardian Drive, Philadelphia, Pennsylvania 19104.
Drs. Chivers and Luong, Mr. Draugelis, Mr. Hanish, Mr. Lubken, and Mr. Becker: Penn Medicine Predictive Healthcare, 3930 Chestnut Street, Philadelphia, PA 19104.
Dr. Levy: Department of Biostatistics, Epidemiology, and Informatics, Perelman School of Medicine, University of Pennsylvania, 714 Blockley Hall, 423 Guardian Drive, Philadelphia, PA 19104-6021.
Drs. Anesi, Christie, Mikkelsen, and Halpern: Division of Pulmonary, Allergy, and Critical Care Medicine, Department of Medicine, Perelman School of Medicine, University of Pennsylvania, 8 Gates Building, 3400 Spruce Street, Philadelphia, PA 19104.
Dr. Brennan: Division of Infectious Diseases, Department of Medicine, Perelman School of Medicine, University of Pennsylvania, Perelman Center for Advanced Medicine, 3400 Civic Center Boulevard, Suite 5A, Philadelphia, PA 19104.
Dr. Hanson: Department of Anesthesiology and Critical Care, Perelman School of Medicine, University of Pennsylvania, Hospital of the University of Pennsylvania, 6 Dulles, 3400 Spruce Street, Philadelphia, PA 19104.
Author Contributions: Conception and design: G.E. Weissman, A. Crane-Droesch, C. Chivers, T. Luong, M.D. Becker, G.L. Anesi, P.J. Brennan, J.D. Christie, C.W. Hanson, M.E. Mikkelsen,
Analysis and interpretation of the data: G.E. Weissman, A. Crane-Droesch, C. Chivers, T. Luong, A. Hanish, M.E. Draugelis, G.L. Anesi, P.J. Brennan, J.D. Christie, ME. Mikkelsen, S.D. Halpern.
Drafting of the article: G.E. Weissman, A. Crane-Droesch, C. Chivers, T. Luong, M.E. Draugelis, G.L. Anesi, C.W. Hanson, M.E. Mikkelsen.
Critical revision for important intellectual content: G.E. Weissman, A. Crane-Droesch, C. Chivers, M.E. Draugelis, G.L. Anesi, J.D. Christie, M.Z. Levy, M.E. Mikkelsen, S.D. Halpern.
Final approval of the article: G.E. Weissman, A. Crane-Droesch, C. Chivers, T. Luong, A. Hanish, J. Lubken, M.D. Becker, M.E. Draugelis, G.L. Anesi, P.J. Brennan, J.D. Christie, S.D. Halpern, C.W. Hanson, M.Z. Levy, M.E. Mikkelsen.
Provision of study materials or patients: C. Chivers.
Statistical expertise: A. Crane-Droesch, C. Chivers, M.Z. Levy.
Obtaining of funding: P.J. Brennan, S.D. Halpern.
Administrative, technical, or logistic support: C. Chivers, T. Luong, A. Hanish, J. Lubken, M.D. Becker, M.E. Draugelis, Mark E. Mikkelsen, S.D. Halpern.
Collection and assembly of data: G.E. Weissman, A. Crane-Droesch, C. Chivers, T. Luong, M.E. Draugelis, G.L. Anesi, M.E. Mikkelsen, S.D. Halpern.
Footnotes
This article was published at Annals.org on 7 April 2020.
References
- 1. doi: 10.1097/MCC.0b013e32834c7a53. Halpern SD. ICU capacity strain and the quality and allocation of critical care. Curr Opin Crit Care. 2011;17:648-57. [PMID: 21986461] doi:10.1097/MCC.0b013e32834c7a53. [DOI] [PubMed]
- 2. doi: 10.1164/rccm.201406-1127LE. Brown SE, Rey MM, Pardo D, et al. The allocation of intensivists' rounding time under conditions of intensive care unit capacity strain [Letter]. Am J Respir Crit Care Med. 2014;190:831-4. [PMID: 25271748] doi:10.1164/rccm.201406-1127LE. [DOI] [PMC free article] [PubMed]
- 3. doi: 10.1007/s00134-016-4240-8. Hua M, Halpern SD, Gabler NB, et al. Effect of ICU strain on timing of limitations in life-sustaining therapy and on death. Intensive Care Med. 2016;42:987-94. [PMID: 26862018] doi:10.1007/s00134-016-4240-8. [DOI] [PMC free article] [PubMed]
- 4. doi: 10.1164/rccm.201304-0622OC. Gabler NB, Ratcliffe SJ, Wagner J, et al. Mortality among patients admitted to strained intensive care units. Am J Respir Crit Care Med. 2013;188:800-6. [PMID: 23992449] doi:10.1164/rccm.201304-0622OC. [DOI] [PMC free article] [PubMed]
- 5. doi: 10.7326/0003-4819-159-7-201310010-00004. Wagner J, Gabler NB, Ratcliffe SJ, et al. Outcomes among patients discharged from busy intensive care units. Ann Intern Med. 2013;159:447-55. [PMID: 24081285] doi:10.7326/0003-4819-159-7-201310010-00004. [DOI] [PMC free article] [PubMed]
- 6. doi: 10.1016/j.jcrc.2015.08.015. Weissman GE, Gabler NB, Brown SE, et al. Intensive care unit capacity strain and adherence to prophylaxis guidelines. J Crit Care. 2015;30:1303-9. [PMID: 26376062] doi:10.1016/j.jcrc.2015.08.015. [DOI] [PMC free article] [PubMed]
- 7. doi: 10.1513/AnnalsATS.201804-241OC. Anesi GL, Liu VX, Gabler NB, et al. Associations of intensive care unit capacity strain with disposition and outcomes of patients with sepsis presenting to the emergency department. Ann Am Thorac Soc. 2018;15:1328-1335. [PMID: 30113865] doi:10.1513/AnnalsATS.201804-241OC. [DOI] [PMC free article] [PubMed]
- 8. doi: 10.1007/s11606-018-4564-x. Kohn R, Harhay MO, Bayes B, et al. Ward capacity strain: a novel predictor of 30-day hospital readmissions [Letter]. J Gen Intern Med. 2018;33:1851-1853. [PMID: 30022410] doi:10.1007/s11606-018-4564-x. [DOI] [PMC free article] [PubMed]
- 9. doi: 10.1513/AnnalsATS.201809-621RL. Kohn R, Harhay MO, Weissman GE, et al. Ward capacity strain: a novel predictor of delays in intensive care unit survivor throughput [Letter]. Ann Am Thorac Soc. 2019;16:387-390. [PMID: 30407847] doi:10.1513/AnnalsATS.201809-621RL. [DOI] [PMC free article] [PubMed]
- 10.www.imperial.ac.uk/media/imperial-college/medicine/sph/ide/gida-fellowships/Imperial-College-COVID19-NPI-modelling-16-03-2020.pdf. doi: 10.25561/77482. Ferguson NM, Laydon D, Nedjati-Gilani G, et al. Impact of non-pharmaceutical interventions (NPIs) to reduce COVID-19 mortality and healthcare demand. Imperial College COVID-19 Response Team. 2020. Accessed at www.imperial.ac.uk/media/imperial-college/medicine/sph/ide/gida-fellowships/Imperial-College-COVID19-NPI-modelling-16-03-2020.pdf . DOI: . DOI: https://doi.org/10.25561/77482 on 23 March 2020. [DOI]
- 11. Eichner M, Brockmann S, Schwehm M. CovidSIM: pandemic preparedness planning for COVID-19. Accessed at covidsim.eu on 23 March 2020.
- 12. Hill A. Modeling COVID-19 spread vs healthcare capacity. Accessed at https://alhill.shinyapps.io/COVID19seir/ on 23 March 2020.
- 13. Goh G. Epidemic calculator. Accessed at http://gabgoh.github.io/COVID/index.html. on 23 March 2020.
- 14. doi: 10.1007/BF02464423. Kermack WO, McKendrick AG. Contributions to the mathematical theory of epidemics—I. 1927. Bull Math Biol. 1991;53:33-55. [PMID: 2059741] [DOI] [PubMed]
- 15. doi: 10.1016/j.ijid.2020.01.050. Zhao S, Lin Q, Ran J, et al. Preliminary estimation of the basic reproduction number of novel coronavirus (2019-nCoV) in China, from 2019 to 2020: a data-driven analysis in the early phase of the outbreak. Int J Infect Dis. 2020;92:214-217. [PMID: 32007643] doi:10.1016/j.ijid.2020.01.050. [DOI] [PMC free article] [PubMed]
- 16. doi: 10.1016/S0140-6736(20)30566-3. Zhou F, Yu T, Du R, et al. Clinical course and risk factors for mortality of adult inpatients with COVID-19 in Wuhan, China: a retrospective cohort study. Lancet. 2020;395:1054-1062. [PMID: 32171076] doi:10.1016/S0140-6736(20)30566-3. [DOI] [PMC free article] [PubMed]
- 17. doi: 10.1056/NEJMoa2002032. Guan WJ, Ni ZY, Hu Y, et al; China Medical Treatment Expert Group for Covid-19. Clinical characteristics of coronavirus disease 2019 in China. N Engl J Med. 2020. [PMID: 32109013] doi:10.1056/NEJMoa2002032. [DOI] [PMC free article] [PubMed]
- 18. doi: 10.1001/jama.2020.4031. Grasselli G, Pesenti A, Cecconi M. Critical care utilization for the COVID-19 outbreak in Lombardy, Italy: early experience and forecast during an emergency response. JAMA. 2020. [PMID: 32167538] doi:10.1001/jama.2020.4031. [DOI] [PubMed]
- 19. doi: 10.1056/NEJMoa2001316. Li Q, Guan X, Wu P, et al. Early transmission dynamics in Wuhan, China, of novel coronavirus-infected pneumonia. N Engl J Med. 2020;382:1199-1207. [PMID: 31995857] doi:10.1056/NEJMoa2001316. [DOI] [PMC free article] [PubMed]
- 20. Van Rossum G, Drake FL. Python 3 reference manual. Scotts Valley, CA: CreateSpace; 2009.
- 21. R Core Team. R: a language and environment for statistical computing [Internet]. Vienna, Austria: R Foundation for Statistical Computing; 2019. Accessed at https://www.R-project.org .
- 22. Hébert-Dufresne L, Althouse BM, Scarpino SV, Allard A. Beyond R_0: the importance of contact tracing when predicting epidemics. 2020. Accessed at http://arxiv.org/abs/2002.04004. on 23 March 2020.
- 23. doi: 10.1098/rsif.2007.1100. Bansal S, Grenfell BT, Meyers LA. When individual behaviour matters: homogeneous and network models in epidemiology. J R Soc Interface. 2007;4:879-91. [PMID: 17640863] [DOI] [PMC free article] [PubMed]
- 24. doi: 10.1371/journal.pone.0136704. Gallos LK, Fefferman NH. The effect of disease-induced mortality on structural network properties. PLoS One. 2015;10:e0136704. [PMID: 26313926] doi:10.1371/journal.pone.0136704. [DOI] [PMC free article] [PubMed]
- 25. doi: 10.1111/j.1541-0420.2012.01809.x. Porter AT, Oleson JJ. A path-specific SEIR model for use with general latent and infectious time distributions. Biometrics. 2013;69:101-8. [PMID: 23323602] doi:10.1111/j.1541-0420.2012.01809.x. [DOI] [PMC free article] [PubMed]
- 26. doi: 10.1007/s00285-019-01374-z. Mummert A, Otunuga OM. Parameter identification for a stochastic SEIRS epidemic model: case study influenza. J Math Biol. 2019;79:705-729. [PMID: 31062075] doi:10.1007/s00285-019-01374-z. [DOI] [PMC free article] [PubMed]
- 27. U.S. Census Bureau. County population by characteristics: 2010-2018. Accessed at www.census.gov/data/tables/time-series/demo/popest/2010s-counties-detail.html. on 20 March 2020.
- 28. Pennsylvania Department of Health. COVID-19 testing in Pennsylvania. Accessed at https://www.health.pa.gov:443/topics/disease/coronavirus/Pages/Cases.aspx. on 20 March 2020.
- 29.www.medrxiv.org/content/10.1101/2020.03.09.20033357v1 doi: 10.1101/2020.03.09.20033357. Verity R, Okell LC, Dorigatti I, et al. Estimates of the severity of COVID-19 disease. medRxiv. 13 March 2020. doi: https://doi.org/10.1101/2020.03.09.20033357 . Accessed at . . Accessed at www.medrxiv.org/content/10.1101/2020.03.09.20033357v1 on 20 March 2020. [DOI]
- 30. doi: 10.7326/M20-0504. Lauer SA, Grantz KH, Bi Q, et al. The incubation period of coronavirus disease 2019 (COVID-19) from publicly reported confirmed cases: estimation and application. Ann Intern Med. 2020. [PMID: 32150748] doi:10.7326/M20-0504. [DOI] [PMC free article] [PubMed]
Associated Data
This section collects any data citations, data availability statements, or supplementary materials included in this article.