

Abstract
Background and Purpose
The quantification of spinal cord (SC) atrophy by MRI has assumed an important role in assessment of neuroinflammatory/neurodegenerative diseases and traumatic SC injury. Recent technical advances make possible the quantification of gray matter (GM) and white matter tissues in clinical settings. However, the goal of a reliable diagnostic, prognostic or predictive marker is still elusive, in part due to large inter-subject variability of SC areas. Here, we investigated the sources of this variability and explored effective strategies to reduce it.
Methods
129 healthy subjects (mean age: 41.0±15.9) underwent MRI on a Siemens 3T Skyra scanner. 2D PSIR at the C2-C3 vertebral level and a sagittal 1mm3 3D T1-weighted brain acquisition extended to the upper cervical cord were acquired. Total cross-sectional area and GM area were measured at C2-C3, as well as measures of the vertebra, spinal canal and the skull. Correlations between the different metrics were explored using Pearson product-moment coefficients. The most promising metrics were used to normalize cord areas using multiple regression analyses.
Results
The most effective normalization metrics were the V-scale (from SienaX) and the product of the C2-C3 spinal canal diameters. Normalization methods based on these metrics reduced the inter-subject variability of cord areas of up to 17.74%. The measured cord areas had a statistically significant sex difference, while the effect of age was moderate.
Conclusions
The present work explored in a large cohort of healthy subjects the source of inter-subject variability of SC areas and proposes effective normalization methods for its reduction.
Keywords: Spinal cord, magnetic resonance imaging, morphometry, inter-subject variability, normalization strategies
INTRODUCTION
A variety of neuroinflammatory and neurodegenerative diseases, including multiple sclerosis (MS), motor neuron diseases (MND), amyotrophic lateral sclerosis (ALS) and adrenomyeloneuropathy (AMN), extensively affect the spinal cord (SC), causing demyelination, neuronal and/or axonal loss, and, consequently, cord atrophy.1–9
In MS, it has been shown that spinal cord and brain atrophy moderately correlates with focal cord and brain lesion burden, and the presence of different pathophysiologic processes that could involve both white and gray matter has been suggested.1,10–12
Spinal cord gray matter atrophy has been described at disease onset in patients with clinically isolated syndrome, a harbinger of MS, and is more pronounced in primary progressive compared to relapsing MS patients.13–16 Several studies have highlighted the correlation between physical disability and cord and brain atrophy,10,17,18 and recently a strong relationship between disability and SC gray matter (GM) atrophy has been shown.12,19 Spinal cord atrophy has also been proposed as a prognostic biomarker for clinical outcomes in patients with traumatic spinal cord injury.20
Recent technological advances have facilitated the widespread use of spinal cord MRI. In particular T2*-weighted and phase sensitive inversion recovery (PSIR) sequences have for the first time enabled the discrimination and volumetric/area measurement of spinal cord GM and white matter (WM).12,21–27 Several automatic segmentation tools including surface- and atlas-based techniques have been reported for the measurement of total cross-sectional cord area (TCA) and, more recently, GM area (GMA).28–34 Despite demonstrating high reliability in single-center studies, further validation in large multi-site studies is warranted.30,35 Therefore, semi-automatic or manual segmentation algorithms are still widely used for cord volumetric/area assessment. However, due to considerable inter- and intra-subject variability their utility as potential biomarkers remains limited. Biological differences have been described as a source of inter-subject variability, including sex and, to a lesser extent, age.36–39 Earlier studies in MS patients sought to reduce variability due to biological differences by applying normalization strategies based on correlations between TCA and brain/skull size in healthy subjects (e.g. total intracranial volume, TICV),40–44 between cord volume/TCA and lumbar enlargement cord area (LECA) and volume/TCA and number of slices/length of the spinal cord.36,37,41,45 However, results remain conflicting, in part due to small sample size.
We previously compared several normalization methods using PSIR images performed on 32 healthy controls.38 The aim of this study was to 1) revalidate the normalization methods reported in our previous work, 2) extend the explored structures to include the spinal canal, and 3) better assess the inter-individual variability due to anatomical/biological differences on a significantly larger dataset of 129 healthy controls.
METHODS
Subjects and Image Acquisition
129 healthy subjects with no history of psychiatric, neurological or cognitive disease (46 men: mean age 40.8±14.0; 83 women: mean age 41.1± 16.9; total cohort: age 19–79; median age 38; mean age 41.0±15.9) underwent MRI scanning on a Siemens 3T Skyra scanner using either a 20- or 64-channel head-neck coil and a 32-channel spine coil.38 The Committee on Human Research at the University of California, San Francisco (UCSF) approved the study protocol and written informed consent was obtained from all participants.
A standard high resolution T1-weighted acquisition of the brain (sagittal 3D-MPRAGE, 1 mm3 resolution, acquisition time ~5:30 min) with a large FOV extended to include the upper cervical cord and a single slice 2D PSIR acquisition with an optimized protocol (axial in-plane resolution 0.78*0.78 mm2, slice thickness 5 mm, matrix 256×256, TR/TE/TI = 4000/3.22/400 ms, angle = 10°, 3 averages, acquisition time: 1:50 min, magnitude and phase-sensitive images reconstructed) were acquired for each participant. The 2D PSIR protocol was acquired at the C2-C3 disc level.27,38 Standard T2-weighted sagittal acquisitions of the whole spinal cord were also acquired to exclude cord pathology. Total acquisition time for these three protocols was about 12 minutes.
Image Analyses
All spinal cord measurements were performed using Jim software (version 7.0, Xinapse Systems Ltd, West Bergholt, United Kingdom; http://www.xinapse.com).
Cord Area, Vertebra-based and Brain Metrics Measurement
TCA and GMA were obtained from the phase-sensitive reconstructed C2-C3 PSIR images. TCA was measured semi-automatically using the Jim “cord finder” toolkit with fixed settings (nominal cord diameter 8 mm, number of shape coefficients 24, order of longitudinal variation 12) after manual marker placement at the cord center. GMA was manually segmented by a single operator (CA, a radiologist with neuroimaging expertise, trained on datasets reported in previous studies).27,38 The GM segmentation was repeated three times to reduce the intra-operator variability and to improve the precision of the measurement. The average GMA was then calculated.27,38 The WM area (WMA) was calculated as the difference between the TCA and the average GMA. Examples of the semi-automatic segmentation of the TCA and manual segmentation of GMA are shown in Figure 1A.
Figure 1.
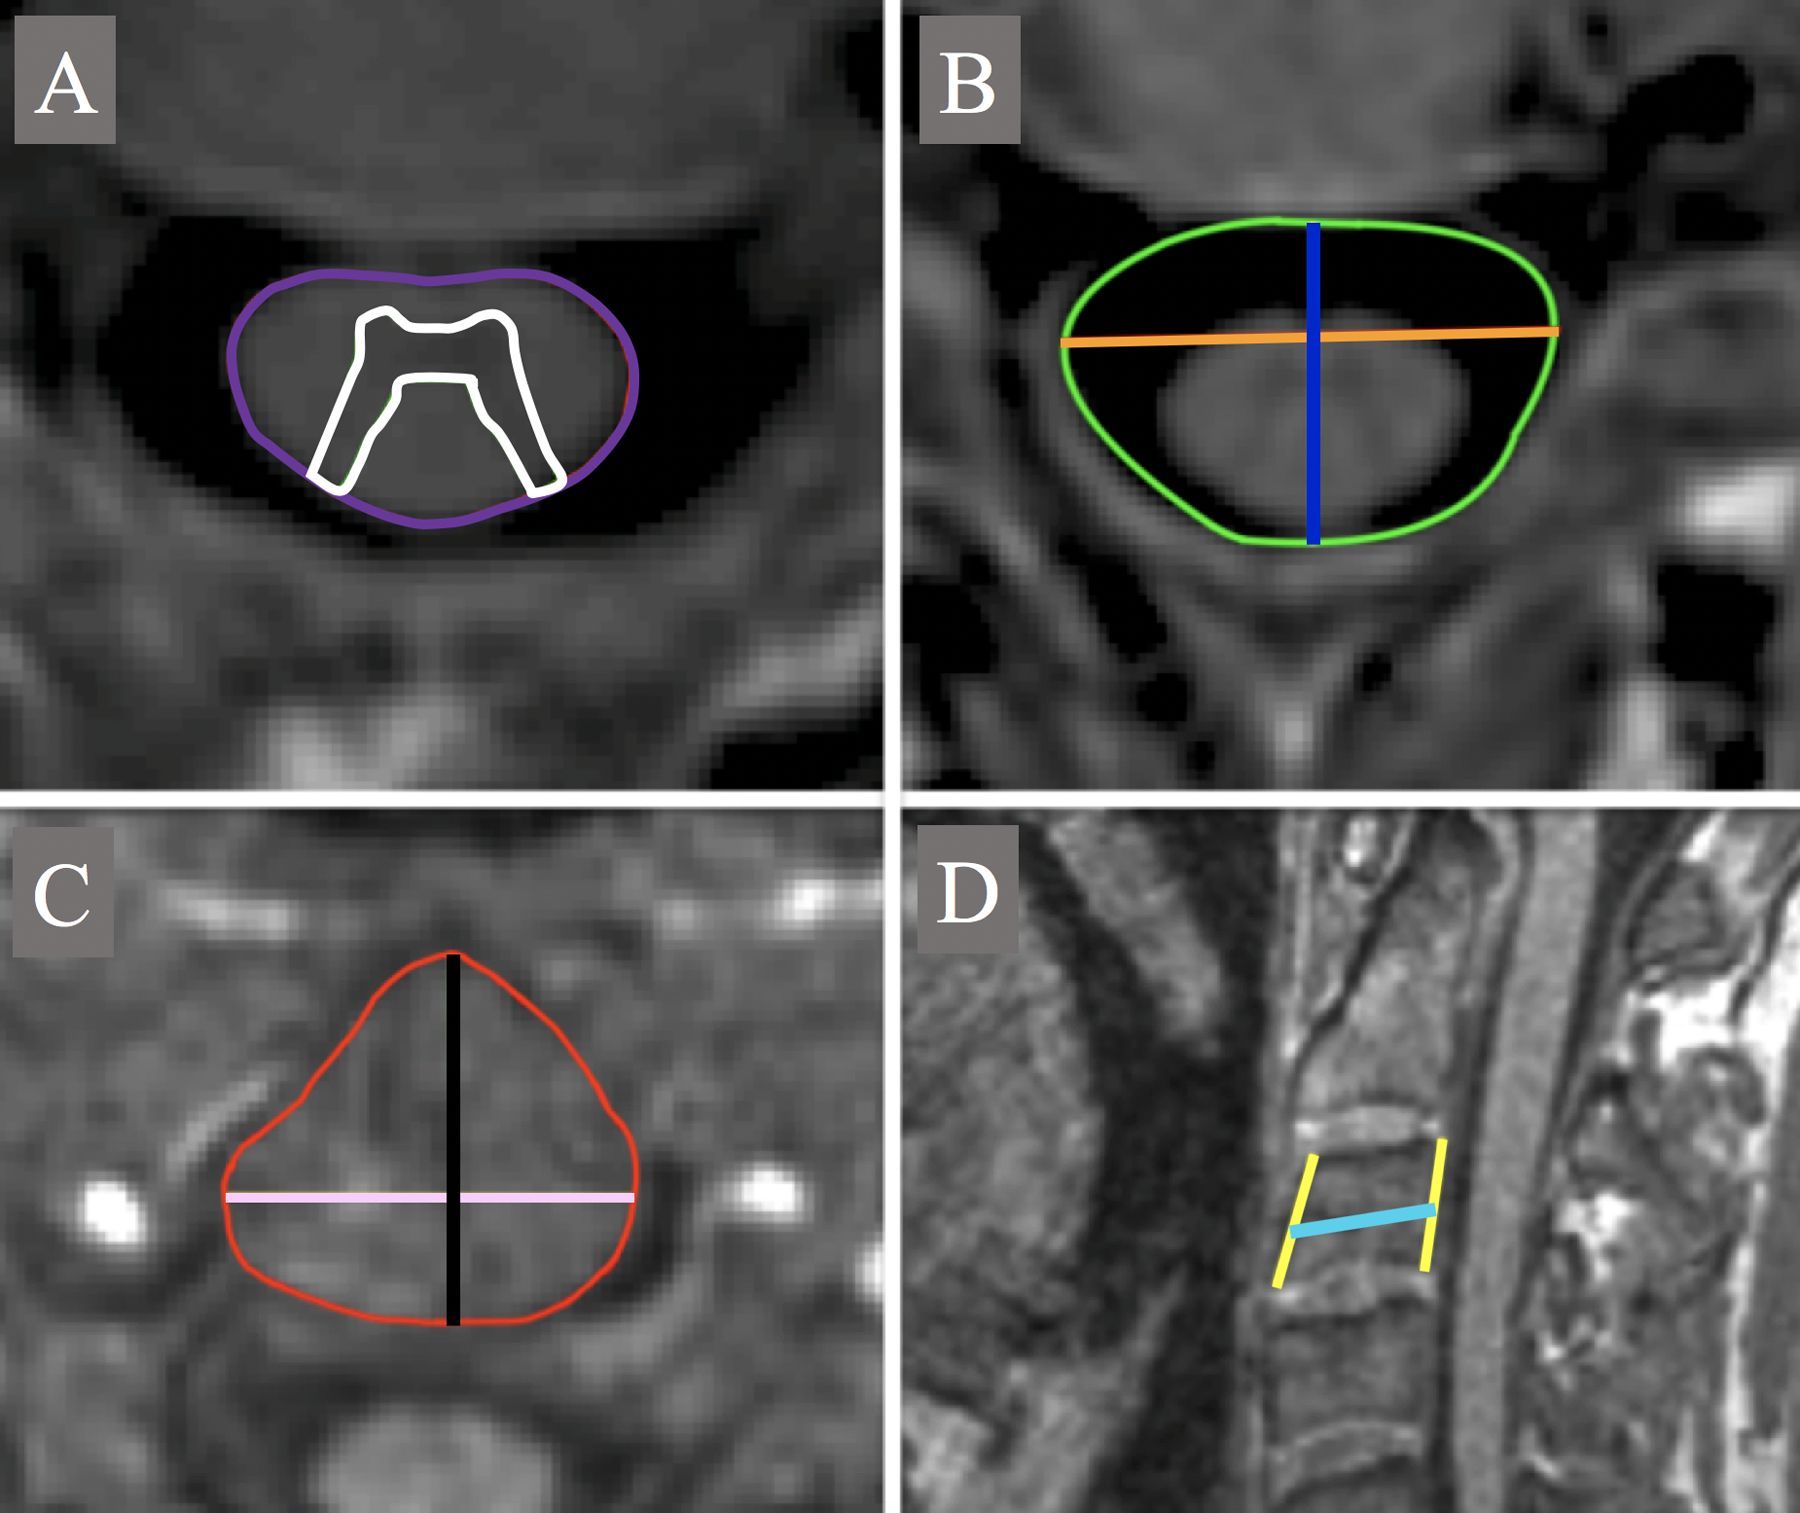
Segmentation examples of A: TCA (purple) and GMA (white); B: axial_canal_area (green), ap_canal_diameter (blue) and lat_canal_diameter (orange); C: axial_vertebra_area (red), ap_vertebra_axial (black) and lat_vertebra_axial (pink) and D: height of the anterior (AH) and posterior (PH) vertebral walls (yellow) and ap_vertebra_diameter (cyan). ap: anterior-posterior; lat: lateral.
On the PSIR images at C2-C3 vertebral level, the operator manually measured the maximum anterior-posterior diameter (ap_canal_diameter) and lateral diameter (lat_canal_diameter) of the spinal canal and the area of the canal (axial_canal_area). To perform the latter measurement, an ROI was drawn following the cortical bone of the vertebra, excluding the lateral recess and the intracanal portion of the intervertebral foramen. The product of ap_canal_diameter and lat_canal_diameter was computed as a surrogate measure of the area canal (axial_canal_product).
On the sagittal MPRAGE other SC skeletal-based metrics were measured. All measurements were carried out at the C3 vertebra body in the mid-sagittal plane defined by the falx cerebri, as previously described.38
Specifically, the metrics computed were:
the height of the anterior (AH) and posterior (PH) vertebral walls, from the superior intervertebral surface to the inferior; we selected only subjects without severe degenerative changes at C2-C3, such as osteophytes and syndesmophytes, which could have increased the length measured by the operator.
the anterior-posterior vertebral body diameter (ap_vertebra_diameter) measured at the mid portion of the vertebra from the anterior margin to the posterior, drawing a line parallel to the edge of the intervertebral surfaces.
the average of AH and PH was computed (mean_vertebra_height) and sagittal_vertebra_area calculated as the product of mean_vertebra_height and ap_vertebra_diameter.
The MPRAGE was also resampled in an axial plane using the origin of the lateral processes as reference for the vertebral body center. We then performed the following measurements in the axial plane:
the maximum antero-posterior diameter (ap_vertebra_axial) and lateral diameter (lat_vertebra_axial) of the vertebra;
the area of the vertebra (axial_vertebra_area), manually drawing an ROI following the profile of the vertebra, remaining within the inner cortical bone profile of the vertebra and not including the eventual origin of the transverse processes.
the product of ap_vertebra_axial and lat_vertebra_axial was also computed as surrogate measure of the vertebral area (axial_vertebra_product).
Examples of the segmentation/measurement of TCA, GMA, canal- and vertebra-based metrics are presented in Figure 1.
SienaX was used to segment the MPRAGE structural brain acquisitions in order to obtain the cortical volume, total GM volume, WM volume, total brain volume (TBV) and V-scale.
SienaX is part of FSL and allows the estimation of brain tissue volumes, normalized for head size.46–48 SienaX starts by extracting brain and skull images from the single whole-head input data.49 The brain image is then affine-registered to MNI152 space (using the skull image to determine the registration scaling);50,51 this was performed to obtain the volumetric scaling factor (V-scale) that was used for normalization due to differences in head size.
Instead of measuring TICV with Freesurfer, we have decided to use in the present study the V-scale derived with SienaX, but, despite the chosen software, the two measurements are conceptually equivalent. Measurements of canal diameters and area that were not previously performed were added in the presented study.
Intra- and inter-rater reliability of Cord and Vertebra-based Metric Measurement
To estimate the intra- and inter-rater reliability of manual measurements of the axial_canal_product and axial_vertebra_product, 20 subjects were selected from the cohort. On this subgroup of subjects two additional operators (AB and EC) performed the measurements, and CA repeated them a second time (about a month after the first time). For reliability analyses, we computed intra-class correlation coefficients (ICC) (two-way mixed-effects model/single rater for intra-rater reliability and two-way random-effects model/single rater for inter-rater reliability).52
Statistical Analyses
All statistical analyses were performed using JMP Pro 14 (https://www.jmp.com/en_ph/software/new-release/new-in-jmp-and-jmp-pro.html).
Correlations between cord areas and canal, vertebra-derived and brain/skull metrics
Pearson product-moment coefficients to assess the correlations among TCA, GMA and the skull- and vertebra-derived metrics were calculated.
Effects of age and sex on cord area
The sex differences of the cord measures performed on the PSIR (TCA, GMA and WMA) were assessed using least squares regression analyses, adjusted for age. Linear and quadratic fits versus age for the total and GM volumes of the brain, and for the SC TCA and GMA were evaluated separately for each sex, and for the data altogether. The r2 and Akaike information criterion (AIC) for the fits were computed.
Correlations between cord areas and height of subjects
Pearson product-moment coefficients were calculated to assess the correlations between TCA/GMA and height. To test whether sex was a confounder for correlations between spinal cord areas and height, we also explored the effect of height, age and sex on the spinal cord areas using a least squares regression analysis.
Comparison of different normalization methods
Multiple regression analyses (standard least squares) were used to explore the effect of age and sex on TCA and GMA, in combination with the metrics calculated above that had the highest Pearson correlations, using the following equation:27,39,42,53
| Eq.1 |
where Aimeas is the measured SC area in a given subject i, Aipred is the resulting normalized area, a,b,c, … are the regression coefficients derived from the fits, X mean, Y mean, Z mean, … are the mean values of the skull/cord metrics of the 129 subjects group and Xi meas, Yi meas, Zi meas, … are their measured values in the subject i.
The variables non-significantly contributing to a model in an exploratory analysis were excluded, and the effect of the normalization by a particular selected model was evaluated by comparing the relative standard deviations (ratios of the group standard deviation and the respective means, %RSD) between the measured data and the values generated by the respective correction formulas.38,39
Sample size calculations
To inform the design of research protocols for clinical trials using spinal cord areas as an outcome measure, we performed sample size calculations for two distinct clinical trial scenarios. Sample size calculations (with 90% power at 0.05 statistical significance) were made for the raw cord area values and for the values normalized with the best model, using a two-sided test.
In a first cross-sectional scenario we determined the total number of MS patients that would need to be enrolled in a study to separate a relapsing remitting (RMS) and a progressive (PMS) patient group based on differences in cord areas. For this calculation we used the TCA and GMA values obtained with the same PSIR protocol from a previous study,12 and the group standard deviation of TCA and GMA from the present study.
In a second longitudinal scenario we determined the total number of MS patients necessary to detect a 30% effect of a hypothetic treatment aimed at slowing the annual rate of total cord atrophy. For this calculation we used the pooled annual ratio of total cord atrophy for MS patients reported in the meta-analysis published by Casserly and coauthors,54 and the group standard deviation of the annual reductions assuming a linear trend derived from the present study.
RESULTS
Cord Area, Vertebra-based and Brain Metrics Measurement
The quality of the PSIR and MPRAGE images of all subjects were judged as acceptable for the aims of this study (visual qualitative assessment of CA, NP and EC in agreement). The quality of the PSIR was consistently good in all subjects demonstrating high contrast between the GM and WM, and allowed the operator to complete the measurements for all metrics.
Intra- and inter-rater reliability of Cord and Vertebra-based Metric Measurement
The ICC for intra- and inter-rater reliability of manual measurements for axial_canal_product was 0.967 and 0.819, respectively, and 0.917 and 0.749 for axial_vertebra_product, respectively. According to Koo and coauthors reliabilities were all in the good/excellent range, except for the inter-rater reliability of axial_vertebra_product that was at the top of the moderate range.52
Correlations between cord areas and canal, vertebra-derived and brain/skull metrics
Results of correlation analyses among TCA/GMA and the other metrics is reported in Table 1. Notice in particular the very high correlations between SC TCA and GMA (Pearson’s r=0.900), between axial_canal_product and axial_canal_area (0.936) and between axial_vertebra_product and axial_vertebra_area (0.914). Also notice how the strongest correlations found for TCA and GMA were with V-scale and canal areas (axial_canal_area and axial_canal_product).
Table 1.
Correlations among TCA, GMA, brain and SC bone metrics.
| TCA | GMA | V-scale | axial_canal_area | axial_canal_product | sagittal_vertebra_area | axial_vertebra_area | axial_vertebra_product | |
|---|---|---|---|---|---|---|---|---|
| TCA | 1 | 0.900*** | −0.440*** | 0.490*** | 0.492*** | 0.210* | 0.190* | 0.197* |
| GMA | 1 | −0.395*** | 0.407*** | 0.418*** | 0.147 | 0.127 | 0.146 | |
| V-scale | 1 | −0.326*** | −0.349*** | −0.557*** | −0.337*** | −0.349*** | ||
| axial_canal_area | 1 | 0.936*** | 0.125 | 0.023 | 0.046 | |||
| axial_canal_product | 1 | 0.105 | −0.038 | −0.014 | ||||
| sagittal_vertebra_area | 1 | 0.710*** | 0.720*** | |||||
| axial_vertebra_area | 1 | 0.914*** | ||||||
| axial_vertebra_product | 1 |
Pearson’s r coefficients are reported with asterisks beside representing the p-value:
0.01 < p < 0.05,
0.001 < p < 0.01,
p < 0.001.
TCA plotted in function of V-scale and axial_canal_product is reported in Figure 2.
Figure 2.

TCA plotted in function of V-scale (left) and axial_canal_product (right). Linear regression fit lines and 95% confidence intervals are reported in red.
Influence of age and sex on cord areas
The average SC metrics corrected for age using a multiple regression analysis with sex are reported in Table 2. Figure 3 reports the age trends (stratified by sex) for total brain and GM volume, and SC TCA and GMA. Linear and quadratic fits (with relative r2) are superimposed on the raw data in the figure, respectively in the left and right subfigure.
Table 2.
Sex influence on spinal cord areas.
| Measure | Sex | Adjusted Mean | Standard Deviation | p-value |
|---|---|---|---|---|
| TCA (mm2) | M | 83.44 | 12.05 | 0.0002 |
| F | 78.32 | 8.97 | ||
| WMA (mm2) | M | 63.09 | 8.77 | 0.0004 |
| F | 59.59 | 6.53 | ||
| GMA (mm2) | M | 20.35 | 3.91 | 0.0003 |
| F | 18.74 | 2.91 |
M: males; F: females.
Figure 3.


Total brain and GM volumes, SC TCA and GMA as a function of age (stratified by sex: women (blue), men (red)). A: linear fit of data; B: quadratic fit. The r2 for the fits (men and women together) are reported in the graph.
The total brain and GM volume reduction per year assuming a linear behavior was about 0.23% and 0.26%, respectively (in line with55), while for TCA and GMA it was about 0.06% and 0.07%, respectively. For the data altogether, the AIC for linear/quadratic fits was: 892.8/884.0 for TCA; 601.4/596.3 for GMA; 3370.6/3367.4 for brain total volume and 3173.3/3172.9 for brain GM volume. The r2 are reported in Figure 3 close to each graph.
Notice how with a quadratic fit, the TCA and GMA in the spinal cord, in contrast to brain total and GM volume, seem to reach a maximum around 45 years of age.
Correlations between cord areas and height of subjects
The height was available for 120 of the 129 subjects. The correlations between cord areas and the height of subjects was modest (Pearson’s r=0.257 for TCA and 0.229 for GMA). In the least squares regression analysis using height, age and sex as covariates, only sex contributed significantly to the variance of cord areas (p=0.024 for TCA, p=0.013 for GMA).
Comparison of normalization methods
From the Pearson correlation analyses, V-scale and axial_canal_product were chosen for the multiple regression models with age and sex as covariates. The axial_canal_product was preferred over axial_canal_area as it showed similar correlations with TCA and GMA, but is easier to measure.
For both TCA and GMA, when using V-scale alone or V-scale and axial_canal_product combined, age and sex were not significant in the model. When using axial_canal_product alone, sex (but not age) became significant. The best models chosen were therefore: V-scale alone (Model1), axial_canal_product and sex (Model2) and V-scale and axial_canal_product (Model3). The coefficients that were obtained for TCA and GMA with Eq.1 and the effect size of normalization strategies (as ratio of the group standard deviation and the respective means, %RSD) are reported in Table 3.
Table 3.
Multi-linear regression analysis of C2-C3 TCA and GMA.
| TCA | V-scale | axial_canal_product | sex | %RSD | %RSDmeas |
|---|---|---|---|---|---|
| Model1 | −24.15 | - | - | 8.50% (10.24%) | 9.47% |
| Model2 | - | 0.0807 | 3.1936 | 8.00% (15.52%) | |
| Model3 | −16.76 | 0.0715 | - | 7.79% (17.74%) | |
| GMA | V-scale | axial_canal_product | sex | %RSD | %RSDmeas |
| Model1 | −7.00 | - | - | 11.63% (8.28%) | 12.68% |
| Model2 | - | 0.0214 | 1.1025 | 11.14% (12.15%) | |
| Model3 | −5.03 | 0.0191 | - | 11.02% (13.09%) |
Normalization coefficients derived by multi-linear regression analysis with C2-C3 total cross-sectional area (TCA, top) and C2-C3 gray matter area (GMA, bottom) as outcome variables and sex, V-scale and axial_canal_product as independent variables (see Eq.1 in the text). The %RSD (ratios of the group standard deviation and the respective means) for the calculated values with each model are reported. %RSDmeas refers to the non-normalized measured data. In the second last column, in parenthesis, the relative %RSD reduction obtained going from measured to normalized data is reported (in percentage) for each model.
Mean values of the independent variables on the total cohort of subjects:
Xmean = V-scalemean = 1.346
Ymean = axial_canal_productmean = 261.16 mm2
When using Model3, shown to be the most effective normalization strategy, the equations to best describe the age trends were the following:
- Using a quadratic fit:
andEq.2 Eq.3 - Using a linear fit:
andEq.4 Eq.5
Sample size calculations
In our previous study we reported a mean TCA difference of 7.77 mm2 between RMS and PMS patients using the same PSIR protocol.12 The group standard deviation for TCA measured in the present study was 7.59 mm2. This value was reduced to 6.24 mm2 when normalizing data using V-scale and axial_canal_product (Model3). A power calculation suggests that 43 MS patients would be necessary to detect differences between RMS and PMS patients with 90% power using the unnormalized data, while 30 using the normalized data.
In the same study we detected a mean GMA difference of 4.38 mm2 between RMS and PMS patients.12 The group standard deviation for GMA measured in the present study was 2.45 mm2. This value was reduced to 2.13 mm2 when normalizing data using Model3. A power calculation suggests that 16 MS patients would be necessary to detect differences with 90% power between RMS and PMS patients using the unnormalized data, while 13 using the normalized data.
In the longitudinal study scenario, we would aim at detecting a 30% treatment effect in reducing the pooled average total cord atrophy of 1.78%/year in MS patients as reported in Casserly et al.54 For the calculation we neglected the very small mean annual reduction of TCA expected in HC. The group standard deviation of annual TCA reduction assuming a linear trend found in the present study was 0.58% in the unnormalized data and 0.48% when using the normalization with Model 3. 52 MS patients would therefore be necessary to detect a 30% treatment effect in such a study using unnormalized TCA data. This number would be reduced to 36 when using TCA normalized with V-scale and axial_canal_product.
DISCUSSION
We have recently reported the usefulness of PSIR images for the discrimination of spinal cord gray and white matter at C2-C3 level in patients with multiple sclerosis and motor neuron disease.5,12 Little is known, however, of the distribution of these measures in the healthy population. Here, we studied the variability of spinal cord areas with age and sex in 129 healthy controls. Furthermore, we expanded our previous work on normalization strategies to reduce the variability of these measures due to anatomical/biological differences.38
The first thing to be noticed is that the TCA, GMA and WMA values adjusted for age were very similar to previously published estimates. This finding is a confirmation of the reliability of our 2D PSIR-based acquisition/measurement method.
Different acquisition/segmentation methods can bias the measured values. TCA values obtained using standard 1mm3 3D T1-w protocols are very similar to values obtained with the 2D PSIR protocol used here, while GMA obtained with other acquisition/segmentation methods could show substantial differences.26
In the present study we found clear sex differences for TCA, GMA and WMA.
The influence of age on SC areas, however, is less evident in the present study compared with our earlier work.38 It is interesting to note that reductions with age of TCA and GMA in the SC are less than a third of those observed for total and GM brain volumes of the same cohort, when assuming a linear trend. This finding together with previous work suggest that the magnitude of differences in physiological versus pathological atrophy rates in multiple sclerosis could be much greater for the spinal cord than the brain. Brain atrophy rates in healthy controls have been reported to range between 0.1–0.3%/year (in line with 0.23%/year we found in this study) and between 0.5–1.0%/year in MS.55 In contrast, the physiological total cord atrophy rate in our study was 0.06%/year compared to 1.78%/year reported in MS.54 This suggests that smaller sample sizes are needed to detect a significant effect in clinical trials when using spinal cord atrophy rate as the primary outcome, assuming that brain and spinal cord are affected in analogous ways by disease and treatment. Alternatively, when assuming a quadratic trend (fit giving a higher r2 and lower AIC), the SC areas increase until about 45 years of age and then begin to decrease, a phenomenon not usually reported for the brain. Even though this finding needs to be confirmed by other studies, it raises interesting questions with respect to possible differences in the development, aging and pathological processes between the SC and the brain.
The current findings confirm previously reported observations of an age-related decline of TCA in the cervical segments observed in healthy controls56–58 and of an impact of sex on total cord volume,58 and extend the findings also to GM and WM areas. Very interestingly, in the Ishikawa et al work,56 an increase of cord area up to the third/fourth decade of life can be observed in the Figures.
Another important finding is the strong correlation observed between TCA and GMA across the entire study population. This was less clearly present in the previous study, likely due to a relatively small sample size. Interestingly, this correlation was also observed in a small cohort of motor neuron disease patients with severe cord atrophy.5
We also show for the first time that the measurement of the spinal canal area performed on spinal cord scans can significantly reduce inter-subject variability of SC areas, particularly when accounting for sex (TCA %RSD reduction by 15.52%, 12.15% for GMA). This finding is in contrast to a recent study performed at the lumbar level of the SC that showed no improvement of TCA inter-subject variability after normalization by spinal canal area,39 which might be explained by the higher inter-subject variability of cord and spinal canal anatomy at the lumbar compared to the cervical level. Normalizing for head size using the SienaX-derived V-scale also reduced inter-subject variability, but to a lesser extent (10.24% for TCA, 8.28% for GMA). Combining both metrics – axial_canal_product and V-scale - appears to provide the most precise estimate for comparison of spinal cord areas (TCA %RSD reduction by 17.74%, 13.09% for GMA). Our data confirm previous studies using analogous measures of head size including TICV for normalization of TCA, which is useful particularly when TCA measurements are performed using brain images, or when brain images are also available.36,37,40,59
The reference equations for normalized TCA and GMA as a function of age could be useful in future clinical studies to compare cord area measurements obtained from other populations with the healthy control population reported in this study.
The correlation of cord areas with the height of subjects was found to be moderate, and mostly driven by the sex differences in the height of subjects. In the studies of Oh et al. and Healy et al. height was suggested as an effective normalization method to improve the detection of differences between MS phenotypes or MS patients and healthy controls;36–37 nevertheless, in these two studies spinal cord volume rather than cross-sectional area was measured. This might explain the stronger correlations with height found in these two studies compared to the present study.
In contrast to our previous study, the sagittal vertebral area did not prove to be useful for normalization in this extended cohort. The vertebral and spinal canal areas, as measured from MPRAGE and PSIR images, respectively, were strongly correlated when their areas were derived by delineating the anatomical boundaries and the product of their two main diameters. Intra- and inter-rater reliability of the axial_canal_product measurement used in Models 2 and 3 of our study were good/excellent. We therefore recommend this measurement based on canal diameters for normalization approaches, as it is effective, reliable, simple and fast to perform.
In this cross-sectional study we presented SC area measurements at the C2-C3 vertebral level using a 2D PSIR protocol on 129 healthy controls. We found a wide range of SC area values with a strong dependence on sex but only a moderate dependence on age. We presented a series of normalization strategies to reduce the inter-individual variability resulting from anatomical/biological differences. This could facilitate the comparison of SC areas between individuals and thereby improve the usefulness of SC areas as diagnostic, prognostic or predictive markers in neuroinflammatory/neurodegenerative diseases and traumatic SC injury.
Acknowledgements and Disclosure:
The authors want to thank Jennifer Arjona, Amber Alexander and Gina Kirkish for their help.
Dr. Hauser serves on the scientific advisory boards for Alector, Annexon, Bionure, Molecular Stethoscope, and Symbiotix; is on the board of trustees for Neurona Therapeutics; has received travel reimbursement and writing assistance from F. Hoffmann-La Roche Ltd for CD20-related meetings and presentations.
Support for this study was provided by NIH/NINDS: R35NS111644 and NMSS: RR 2005-A-3.
Footnotes
The other authors have no competing interest related to the study.
REFERENCES
- 1.Bakshi R, Dandamudi VS, Neema M, De C, Bermel RA. Measurement of brain and spinal cord atrophy by magnetic resonance imaging as a tool to monitor multiple sclerosis. J Neuroimaging 2005;15:30s–45s. [DOI] [PubMed] [Google Scholar]
- 2.Furby J, Hayton T, Anderson V, et al. Magnetic resonance imaging measures of brain and spinal cord atrophy correlate with clinical impairment in secondary progressive multiple sclerosis. Mult Scler 2008;14:1068–75. [DOI] [PubMed] [Google Scholar]
- 3.Kearney H, Miszkiel KA, Yiannakas MC, Ciccarelli O, Miller DH. A pilot MRI study of white and grey matter involvement by multiple sclerosis spinal cord lesions. Mult Scler Relat Disord 2013;2:103–8. [DOI] [PubMed] [Google Scholar]
- 4.Kearney H, Schneider T, Yiannakas MC, et al. Spinal cord grey matter abnormalities are associated with secondary progression and physical disability in multiple sclerosis. J Neurol Neurosurg Psychiatry 2015;86:608–14. [DOI] [PubMed] [Google Scholar]
- 5.Olney NT, Bischof A, Rosen H, et al. Measurement of spinal cord atrophy using phase sensitive inversion recovery (PSIR) imaging in motor neuron disease. PLoS One 2018;13:e0208255. [DOI] [PMC free article] [PubMed] [Google Scholar]
- 6.El Mendili MM, Cohen-Adad J, Pelegrini-Issac M, et al. Multi-parametric spinal cord MRI as potential progression marker in amyotrophic lateral sclerosis. PLoS One 2014;9:e95516. [DOI] [PMC free article] [PubMed] [Google Scholar]
- 7.Castellano A, Papinutto N, Cadioli M, et al. Quantitative MRI of the spinal cord and brain in adrenomyeloneuropathy: in vivo assessment of structural changes. Brain 2016;139:1735–46. [DOI] [PubMed] [Google Scholar]
- 8.Israel H, Ostendorf F, Stiepani H, Ploner CJ. Spinal cord atrophy in adrenomyeloneuropathy. Arch Neurol 2005;62:1157. [DOI] [PubMed] [Google Scholar]
- 9.Powers JM, DeCiero DP, Ito M, Moser AB, Moser HW. Adrenomyeloneuropathy: a neuropathologic review featuring its noninflammatory myelopathy. J Neuropathol Exp Neurol 2000;59:89–102. [DOI] [PubMed] [Google Scholar]
- 10.Cohen AB, Neema M, Arora A, et al. The relationships among MRI-defined spinal cord involvement, brain involvement, and disability in multiple sclerosis. J Neuroimaging 2012;22:122–8. [DOI] [PMC free article] [PubMed] [Google Scholar]
- 11.Evangelou N, DeLuca GC, Owens T, Esiri MM. Pathological study of spinal cord atrophy in multiple sclerosis suggests limited role of local lesions. Brain 2005;128:29–34. [DOI] [PubMed] [Google Scholar]
- 12.Schlaeger R, Papinutto N, Panara V, et al. Spinal cord gray matter atrophy correlates with multiple sclerosis disability. Ann Neurol 2014;76:568–80. [DOI] [PMC free article] [PubMed] [Google Scholar]
- 13.Rocca MA, Horsfield MA, Sala S, et al. A multicenter assessment of cervical cord atrophy among MS clinical phenotypes. Neurology 2011;76:2096–102. [DOI] [PubMed] [Google Scholar]
- 14.Rocca MA, Valsasina P, Damjanovic D, et al. Voxel-wise mapping of cervical cord damage in multiple sclerosis patients with different clinical phenotypes. J Neurol Neurosurg Psychiatry 2013;84:35–41. [DOI] [PubMed] [Google Scholar]
- 15.Schlaeger R, Papinutto N, Zhu A, et al. Atrophy of spinal cord gray matter is detectable at an early stage of multiple sclerosis. Neurology 2017;88 (16 Supplement):S2.003. [Google Scholar]
- 16.Zeydan B, Gu X, Atkinson EJ, et al. Cervical spinal cord atrophy: an early marker of progressive MS onset. Neurol Neuroimmunol Neuroinflamm 2018;5:e435. [DOI] [PMC free article] [PubMed] [Google Scholar]
- 17.Kearney H, Rocca MA, Valsasina P, et al. Magnetic resonance imaging correlates of physical disability in relapse onset multiple sclerosis of long disease duration. Mult Scler 2014;20:72–80. [DOI] [PMC free article] [PubMed] [Google Scholar]
- 18.Lundell H, Svolgaard O, Dogonowski AM, et al. Spinal cord atrophy in anterior-posterior direction reflects impairment in multiple sclerosis. Acta Neurol Scand 2017;136:330–7. [DOI] [PubMed] [Google Scholar]
- 19.Schlaeger R, Papinutto N, Zhu AH, et al. Association between thoracic spinal cord gray matter atrophy and disability in multiple sclerosis. JAMA Neurol 2015;72:897–904. [DOI] [PMC free article] [PubMed] [Google Scholar]
- 20.Ziegler G, Grabher P, Thompson A, et al. Progressive neurodegeneration following spinal cord injury: implications for clinical trials. Neurology 2018;90:e1257–66. [DOI] [PMC free article] [PubMed] [Google Scholar]
- 21.Fradet L, Arnoux PJ, Ranjeva JP, Petit Y, Callot V. Morphometrics of the entire human spinal cord and spinal canal measured from in vivo high-resolution anatomical magnetic resonance imaging. Spine (Phila Pa 1976) 2014;39:E262–9. [DOI] [PubMed] [Google Scholar]
- 22.Taso M, Le Troter A, Sdika M, et al. Construction of an in vivo human spinal cord atlas based on high-resolution MR images at cervical and thoracic levels: preliminary results. MAGMA 2014;27:257–67. [DOI] [PubMed] [Google Scholar]
- 23.Yiannakas MC, Kakar P, Hoy LR, Miller DH, Wheeler-Kingshott CA. The use of the lumbosacral enlargement as an intrinsic imaging biomarker: feasibility of grey matter and white matter cross-sectional area measurements using MRI at 3T. PLoS One 2014;9:e105544. [DOI] [PMC free article] [PubMed] [Google Scholar]
- 24.Yiannakas MC, Kearney H, Samson RS, et al. Feasibility of grey matter and white matter segmentation of the upper cervical cord in vivo: a pilot study with application to magnetisation transfer measurements. Neuroimage 2012;63:1054–9. [DOI] [PubMed] [Google Scholar]
- 25.Kearney H, Yiannakas MC, Abdel-Aziz K, et al. Improved MRI quantification of spinal cord atrophy in multiple sclerosis. J Magn Reson Imaging 2014;39:617–23. [DOI] [PubMed] [Google Scholar]
- 26.Papinutto N, Henry RG. Evaluation of intra- and interscanner reliability of MRI protocols for spinal cord gray matter and total cross-sectional area measurements. J Magn Reson Imaging 2019;49:1078–90. [DOI] [PMC free article] [PubMed] [Google Scholar]
- 27.Papinutto N, Schlaeger R, Panara V, et al. 2D phase-sensitive inversion recovery imaging to measure in vivo spinal cord gray and white matter areas in clinically feasible acquisition times. J Magn Reson Imaging 2015;42:698–708. [DOI] [PMC free article] [PubMed] [Google Scholar]
- 28.Prados F, Ashburner J, Blaiotta C, et al. Spinal cord grey matter segmentation challenge. Neuroimage 2017;152:312–29. [DOI] [PMC free article] [PubMed] [Google Scholar]
- 29.De Leener B, Cohen-Adad J, Kadoury S. Automatic segmentation of the spinal cord and spinal canal coupled with vertebral labeling. IEEE Trans Med Imaging 2015;34:1705–18. [DOI] [PubMed] [Google Scholar]
- 30.Gros C, De Leener B, Badji A, et al. Automatic segmentation of the spinal cord and intramedullary multiple sclerosis lesions with convolutional neural networks. Neuroimage 2019;184:901–15. [DOI] [PMC free article] [PubMed] [Google Scholar]
- 31.Koh J, Kim T, Chaudhary V, Dhillon G. Automatic segmentation of the spinal cord and the dural sac in lumbar MR images using gradient vector flow field. Conf Proc IEEE Eng Med Biol Soc 2010;2010:3117–20. [DOI] [PubMed] [Google Scholar]
- 32.Carbonell-Caballero J, Manjon JV, Marti-Bonmati L, et al. Accurate quantification methods to evaluate cervical cord atrophy in multiple sclerosis patients. MAGMA 2006;19:237–46. [DOI] [PubMed] [Google Scholar]
- 33.Chen M, Carass A, Oh J, et al. Automatic magnetic resonance spinal cord segmentation with topology constraints for variable fields of view. Neuroimage 2013;83:1051–62. [DOI] [PMC free article] [PubMed] [Google Scholar]
- 34.Tang L, Wen Y, Zhou Z, von Deneen KM, Huang D, Ma L. Reduced field-of-view DTI segmentation of cervical spine tissue. Magn Reson Imaging 2013;31:1507–14. [DOI] [PubMed] [Google Scholar]
- 35.De Leener B, Taso M, Cohen-Adad J, Callot V. Segmentation of the human spinal cord. MAGMA 2016;29:125–53. [DOI] [PubMed] [Google Scholar]
- 36.Healy BC, Arora A, Hayden DL, et al. Approaches to normalization of spinal cord volume: application to multiple sclerosis. J Neuroimaging 2012;22:e12–9. [DOI] [PMC free article] [PubMed] [Google Scholar]
- 37.Oh J, Seigo M, Saidha S, et al. Spinal cord normalization in multiple sclerosis. J Neuroimaging 2014;24:577–84. [DOI] [PMC free article] [PubMed] [Google Scholar]
- 38.Papinutto N, Schlaeger R, Panara V, et al. Age, gender and normalization covariates for spinal cord gray matter and total cross-sectional areas at cervical and thoracic levels: a 2D phase sensitive inversion recovery imaging study. PLoS One 2015;10:e0118576. [DOI] [PMC free article] [PubMed] [Google Scholar]
- 39.Yiannakas MC, Liechti MD, Budtarad N, et al. Gray vs. white matter segmentation of the conus medullaris: reliability and variability in healthy volunteers. J Neuroimaging 2019;29:410–7. [DOI] [PubMed] [Google Scholar]
- 40.Engl C, Schmidt P, Arsic M, et al. Brain size and white matter content of cerebrospinal tracts determine the upper cervical cord area: evidence from structural brain MRI. Neuroradiology 2013;55:963–70. [DOI] [PubMed] [Google Scholar]
- 41.Klein JP, Arora A, Neema M, et al. A 3T MR imaging investigation of the topography of whole spinal cord atrophy in multiple sclerosis. AJNR Am J Neuroradiol 2011;32:1138–42. [DOI] [PMC free article] [PubMed] [Google Scholar]
- 42.Mann RS, Constantinescu CS, Tench CR. Upper cervical spinal cord cross-sectional area in relapsing remitting multiple sclerosis: application of a new technique for measuring cross-sectional area on magnetic resonance images. J Magn Reson Imaging 2007;26:61–5. [DOI] [PubMed] [Google Scholar]
- 43.Rashid W, Davies GR, Chard DT, et al. Upper cervical cord area in early relapsing-remitting multiple sclerosis: cross-sectional study of factors influencing cord size. J Magn Reson Imaging 2006;23:473–6. [DOI] [PubMed] [Google Scholar]
- 44.Zivadinov R, Banas AC, Yella V, Abdelrahman N, Weinstock-Guttman B, Dwyer MG. Comparison of three different methods for measurement of cervical cord atrophy in multiple sclerosis. AJNR Am J Neuroradiol 2008;29:319–25. [DOI] [PMC free article] [PubMed] [Google Scholar]
- 45.Song F, Huan Y, Yin H, et al. Normalized upper cervical spinal cord atrophy in multiple sclerosis. J Neuroimaging 2008;18:320–7. [DOI] [PubMed] [Google Scholar]
- 46.Smith SM, Jenkinson M, Woolrich MW, et al. Advances in functional and structural MR image analysis and implementation as FSL. Neuroimage 2004;23(Suppl 1):S208–19. [DOI] [PubMed] [Google Scholar]
- 47.Smith SM, De Stefano N, Jenkinson M, Matthews PM. Normalized accurate measurement of longitudinal brain change. J Comput Assist Tomogr 2001;25:466–75. [DOI] [PubMed] [Google Scholar]
- 48.Smith SM, Zhang Y, Jenkinson M, et al. Accurate, robust, and automated longitudinal and cross-sectional brain change analysis. Neuroimage 2002;17:479–89. [DOI] [PubMed] [Google Scholar]
- 49.Smith SM. Fast robust automated brain extraction. Hum Brain Mapp 2002;17:143–55. [DOI] [PMC free article] [PubMed] [Google Scholar]
- 50.Jenkinson M, Bannister P, Brady M, Smith S. Improved optimization for the robust and accurate linear registration and motion correction of brain images. Neuroimage 2002;17:825–41. [DOI] [PubMed] [Google Scholar]
- 51.Jenkinson M, Smith S. A global optimisation method for robust affine registration of brain images. Med Image Anal 2001;5:143–56. [DOI] [PubMed] [Google Scholar]
- 52.Koo TK, Li MY. A guideline of selecting and reporting intraclass correlation coefficients for reliability research. Journal of chiropractic medicine 2016;15:155–63. [DOI] [PMC free article] [PubMed] [Google Scholar]
- 53.Sanfilipo MP, Benedict RH, Zivadinov R, Bakshi R. Correction for intracranial volume in analysis of whole brain atrophy in multiple sclerosis: the proportion vs. residual method. Neuroimage 2004;22:1732–43. [DOI] [PubMed] [Google Scholar]
- 54.Casserly C, Seyman EE, Alcaide-Leon P, et al. Spinal cord atrophy in multiple sclerosis: a systematic review and meta-analysis. Journal of neuroimaging : official journal of the American Society of Neuroimaging 2018;28:556–86. [DOI] [PubMed] [Google Scholar]
- 55.De Stefano N, Battaglini M, Smith SM. Measuring brain atrophy in multiple sclerosis. J Neuroimaging;17(Suppl 1):10s–15s. [DOI] [PubMed] [Google Scholar]
- 56.Ishikawa M, Matsumoto M, Fujimura Y, Chiba K, Toyama Y. Changes of cervical spinal cord and cervical spinal canal with age in asymptomatic subjects. Spinal Cord 2003;41:159–63. [DOI] [PubMed] [Google Scholar]
- 57.Kato F, Yukawa Y, Suda K, Yamagata M, Ueta T. Normal morphology, age-related changes and abnormal findings of the cervical spine. Part II: magnetic resonance imaging of over 1,200 asymptomatic subjects. Eur Spine J 2012;21:1499–507. [DOI] [PMC free article] [PubMed] [Google Scholar]
- 58.Yanase M, Matsuyama Y, Hirose K, et al. Measurement of the cervical spinal cord volume on MRI. J Spinal Disord Tech 2006;19:125–9. [DOI] [PubMed] [Google Scholar]
- 59.Valsasina P, Rocca MA, Horsfield MA, Copetti M, Filippi M. A longitudinal MRI study of cervical cord atrophy in multiple sclerosis. J Neurol 2015;262:1622–8. [DOI] [PubMed] [Google Scholar]