

Abstract
Inactivation is the process by which ion channels terminate ion flux through their pores while opening stimulus is still present1. In neurons, inactivation of both sodium and potassium channels is crucial for action potential generation and regulation of firing frequency1,2. It has been proposed that a cytoplasmic domain of either the channel or an accessory subunit plugs the open pore to inactivate the channel via a “ball-and-chain” mechanism3–7, but no structural evidence of this has been observed to date. Here, we used cryo-electron microscopy to determine the molecular gating mechanism in calcium-activated potassium channels by obtaining structures of a purely calcium-gated and inactivating channel in a lipid environment. In the absence of Ca2+ we obtained one structure in closed state, shown by atomistic simulations to be highly flexible in lipid bilayers at ambient temperature, with large rocking motions of the gating ring and bending of pore-lining helices. In Ca2+-bound conditions, we obtained several structures including multiple open-inactivated conformations, further indication of a very dynamic protein. These different channel conformations are distinguished by rocking of the gating rings with respect to the transmembrane region, indicating symmetry breakage across the channel. Furthermore, in all conformations displaying open channel pores, the N-terminus of one subunit of the channel tetramer sticks into the pore and plugs it, a strong interaction as shown by free energy simulations. Deletion of this N-terminus leads to functionally non-inactivating channels and structures of open states without pore-plug, indicating that this previously unresolved N-terminal peptide is responsible for a ball-and-chain type inactivation mechanism.
Introduction
Calcium ions (Ca2+) regulate a variety of cellular processes as diverse as synaptic transmission, cell motility, gene transcription, muscle contraction, and exocytosis8,9. These processes are regulated by Ca2+ binding directly to effectors such as Ca2+-gated ion channels. Within this class of ion channels, eukaryotic large-conductance Ca2+-activated K+ (BK) channels serve as key regulators of Ca2+-dependent cellular processes by coupling intracellular Ca2+-concentration to membrane excitability10–12. Despite recent progress from single-particle cryo-EM structures of aplysia BK (aBK) channel in the presence and absence of Ca2+ , the structural correlates of BK channel gating are still unclear13,14. Although experimental conditions (plus/minus Ca2+) were selected to favor open and closed states, respectively, the structures are similar in the pore region despite the fact that functional and biophysical measurements suggested significant structural changes between open and closed pores15–18. A possible explanation is that the aBK structure in the absence of Ca2+ still represents an open state, perhaps due to the positioning of the voltage sensors in the absence of voltage. Here, we investigate the gating of the MthK channel from M. thermoautotrophicum, a voltage sensor-less prokaryotic BK channel homolog19,20, with structural and functional approaches. In the absence of voltage sensors, a solely calcium-activated channel such as MthK should display closed states in the absence of Ca2+ and open conformations in the presence of Ca2+, and allow the full Ca2+ gating cycle of this channel to be investigated without the interplay of other domains.
MthK and BK channels have very similar tetrameric architectures, with potassium-selective pores and high sequence homology (Extended Data Fig.1), including a signature sequence for potassium selectivity, and cytoplasmic gating rings made of 8 RCK domains that specifically bind calcium19,20. The differences, in addition to the absence of voltage sensor domains in MthK, are in the sequence and composition of the RCK domain, which lead to different Ca2+-binding sites between the two homologs15. Nevertheless, comparisons of crystal structures of RCK domains from MthK and BK indicate structurally similar gating rings, which undergo similar Ca2+-dependent conformational rearrangements21–22. MthK is thus a good proxy to study Ca2+-gating in the BK channel family although the additional layer of complexity that the voltage sensors add to Ca2+-gating in BK13,23–25 will not be captured here.
A presumably open MthK channel has been determined with X-ray crystallography in the presence of Ca2+, where a mutation eliminates the production of the soluble RCK and the octameric RCK ring is formed by two channels assembling back to back20. This structure had similar intracellular pore opening diameter as Ca2+-bound aBK, indicating that it represented an open state. MthK and BK channels have large single-channel conductances and the open probabilities are increased upon raising intracellular Ca2+ 26,27–29. BK channels can inactivate through a ball-and-chain type mechanism from associated β-subunits30. In MthK, inactivation was proposed to depend on the N-terminal MthK tail (the first 17 residues)31. Inactivation was also observed in stopped-flow fluorometric functional assays, while single-channel recordings of purified MthK in lipid bilayers consistently displayed no inactivation28,29,32,33. Currently, there are no structural correlates for this phenomenon and no explanation for the discrepancies found when using different techniques.
Results
Structure of closed MthK in the absence of Ca2+
The cryo-EM structure of closed MthK was obtained by reconstituting channels in lipid nanodiscs in the absence of Ca2+ with added EDTA20,28 (Extended Data Fig.2). 3D classification analysis showed classes with minor differences in the tilt between the transmembrane (TM) domain and the gating ring. Since the tilt angles were small (less than 4 degrees), we combined all particles yielded a density map at 3.6 Å resolution (Fig. 1a, Supplementary Video 1, Extended Data Fig.2). The resulting structure has 2 TM helical segments (Fig. 1b), where TM2 lines the pore, and a potassium selectivity filter similar to that observed for previous K+ channel structures34,35. However, there are major differences between our closed structure and the open crystal structures of MthK with bound calcium20.
Figure 1|. MthK structure in the closed state in the absence of Ca2+.
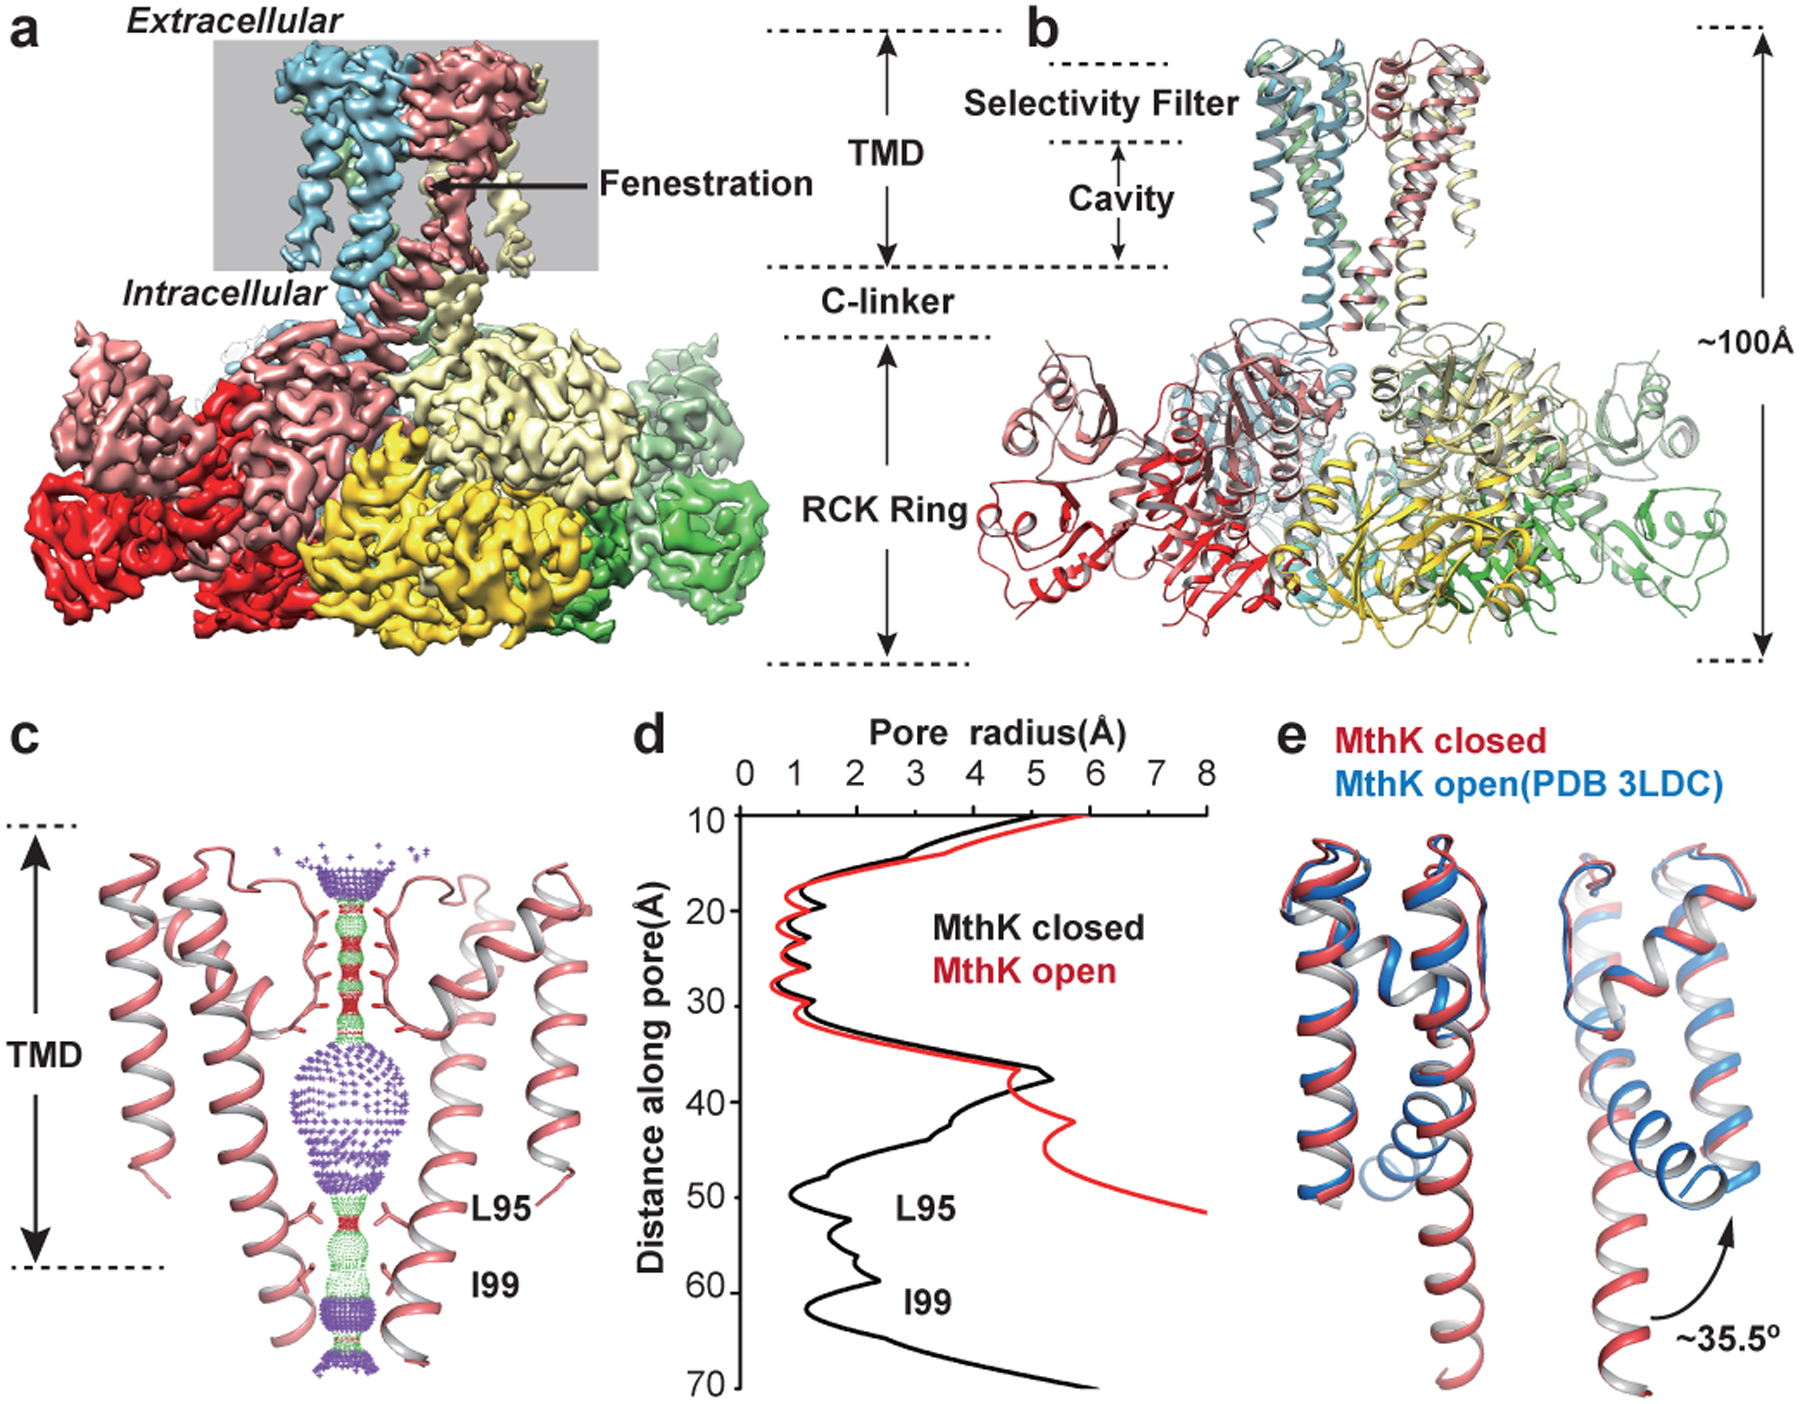
a, Cryo-EM map of closed state MthK viewed parallel to the membrane. Each subunit is in a different color. b, Atomic model of closed MthK in the absence of Ca2+. Same orientation and colors as in (a). c, Selectivity filter and bundle crossing gate radii calculated with HOLE. Only two opposing subunits are shown. d, Pore radii as a function of the distance along the pore, plotted to scale with the pore position in panel c, calculated with HOLE. e, Comparison of the intracellular gate of MthK closed state (red) with open state (blue, PDB 3LDC). Open state TM2 is tilted by ~35.5 degrees compared with closed state.
The closed MthK TM2s are straight, 2 helical turns longer than in the open structure, forming a bundle crossing at the intracellular side, in contrast to the wide, splayed open, bent TM2 helices in open MthK (Fig.1c–e, Supplementary Video 2). The intracellular entryway of closed MthK is constricted at the intracellular side (I99, L95), and appears impermeant to ions (Fig.1c–d). The quality of the map is not sufficient to model carbonyl groups in the selectivity filter, thus it is unclear whether the selectivity filter is conductive or partially collapsed35. The straightening of the TM2 helices in the closed MthK structure led to the appearance of fenestrations between TM2 helices, located a third of the way through the membrane from the inside, with a diameter of ~12Å (Fig.1a, Extended Data Fig.3a). These fenestrations may allow entry of lipids or membrane soluble compounds into the pore cavity, which could inhibit ion conduction. No such fenestrations are visible in the open MthK structure (Extended Data Fig.3b).
The gating ring, formed by 8 RCK domains without Ca2+ bound is identical to the Ca2+-free RCK domain-only crystal structures21. The linker that connects the pore domain to the RCK gating ring is completely resolved in our closed MthK. It consists of a loop that projects radially away from the end of TM2 and lies flat on top of the RCK domain N-lobe, with which it makes several hydrophobic and potential salt bridge interactions (Extended Data Fig.3e,f). In contrast, in the open MthK crystal structure, the last two alpha helical turns of the TM2 and the entire linker are disordered.
A dynamic closed state with gating ring-rocking
We performed molecular dynamics (MD) simulations of the closed MthK structure in planar lipid membranes at ambient temperatures. Ten independent fully atomistic simulations (totaling 2.6 μs) were performed in fully hydrated bilayers. The closed MthK conformation was highly flexible and frequently underwent large domain motions (Fig. 2a, Supplementary Video 3). The most striking was the gating ring rocking from side to side during the simulations, tilting relative to membrane normal by up to ∼19° (Fig. 2a–b, Extended Data Fig.4a), which led to noticeable and reversible interactions of the RCK domains with the membrane, inducing membrane curvature (Fig.2a, Extended Data Fig.4h). These interactions may not occur in the lipid nanodiscs used for the structure determination due to the smaller membrane area. The gating ring tilt was also associated with bending of the TM2 helices (Fig. 2a–b, Extended Data Fig. 4b,c). Analysis of the time-lagged cross-correlation of all 10 simulations indicated immediate communication between the RCK gating ring and the intracellular gate (Extended Data Fig.4d), evidencing the likely pathway for allosteric coupling. The flexibility around the TM2-C-linker bend, captured dynamically in the simulations is consistent with our finding of the several 3D-classes within the Ca2+-free MthK dataset displaying small tilts of the gating ring.
Figure 2 |. Atomistic simulations of closed MthK.

a, Sample system with MthK embedded in a hydrated POPE:POPG (3:1) lipid bilayer. Gating ring tilts (blue dashed arrows; seen in all 10 simulations), RCK domain and C-linker interactions with membrane, inducing curvature (dashed line on inner bilayer), are indicated. TM2 bends (black dotted line). Inset shows five lipid tails (yellow) entering through fenestrations. b, Gating ring rocking appears correlated to the bend of TM2, illustrated here for RCK subunit A and C tilt against TM2 subunit A bend. c, Sample time series of gate size at positions L95, I99 and Q103 on TM2 during this simulation (early changes in Extended Data Fig.4j). 10 independent simulations were performed showing large variations and correlations in tilt and bend and gate size.
The rigid-body tumbling of the tetramer seen in the simulations is made possible by the bending of the TM2s and the flexible C-linkers, which alternate between interacting with the N-lobe and with the phospholipid head groups (Extended Data Fig.4i). The internal structures of the RCKs were mostly maintained (Extended Data Fig.4e–g). The RCKs interact with both PE and anionic PG headgroups, leading to the embedding of both acidic and basic side chains from the C-linker, C-lobe and N-lobe into the membrane (Extended Data Fig.4h). The C-linker-membrane interaction occurs rapidly (in the first few nanoseconds) in every simulation, leading to an increase in lower pore radius due to radial displacements of the lower TM2 helices at residue Q103 (Extended Data Fig.4j; Supplementary Video 4). Although the pore ultimately remains closed (unchanged diameter at L95 and I99 (Fig. 2c, Extended Data Fig.4j)), the large protein motions in regions involved in gating, hint at the conformational changes that the channel may experience during opening.
Multiple cryo-EM structures of Ca2+-bound MthK
We determined next the cryo-EM structure of Ca2+-bound MthK in presence of 5 mM Ca2+. 3D-classification led to several different classes which were refined separately (Extended Data Fig.5,6). When classified based on the TM domain, two major conformations were observed. One conformation (~7% of particles) is almost identical to the closed Ca2+-free MthK, is fourfold symmetric, and has straight TM2 helices and pore constriction at the intracellular side (Fig. 3d,h,Extended Data Fig.12a). Despite Ca2+ being bound (Extended Data Fig.12c,d), the RCK domains were in the same conformation as the Ca2+-free MthK gating ring, suggesting that this conformation is a closed, Ca2+-bound MthK.
Figure 3 |. Multiple MthK structures in the presence of Ca2+.

a-d, Cryo-EM maps of MthK in 5 mM Ca2+. Each subunit is colored as in Fig. 1. The soluble RCK densities are shown in stronger shades. The nanodisc density is shown in white transparent. a-c are the open-inactivated states and d is the closed state. e-h, Corresponding atomic models. Colors are the same as in a-d.
The second, major conformation (~80% of particles), is drastically different from the closed structure: its TM domain aligns well with the open MthK crystal structure where the TM2 helices are wide open at the intracellular entryway (Fig.3a–c). Within this major category, the particles display different tilts of the gating ring with respect to the membrane normal, as seen in the MD simulation of the closed channel (Fig.2). Three subcategories were defined based on the degree of tilt (~20, 8, 4 degrees tilt, respectively) (Extended Data Fig.6). While 3D-classes of many more gating ring-tilts exist, we discuss (and deposited) only representative structure from these three subcategories, since the differences between them are small (Fig. 3a–c). Unlike the MthK crystal structure, none of these structures are four-fold symmetric and all the maps were reconstructed without symmetry. Nevertheless, the transmembrane domains of the structures from all three subcategories are similar to each other and the crystal structure, with a wide-open pore (Fig. 3a–c). Thus, the pore domain maintains a quasi 4-fold symmetry, despite the large asymmetric movements of the gating ring.
The highest map quality open structure (MthK Ca2+ state 1) comes from the subcategory with the largest tilt of the gating ring (Fig. 3a, e, Extended Data Fig.7). In this structure, the last two helical turns of TM2 and the C-linker are ordered in only one of the subunits, which brings the corresponding RCK closer to the TM domain than in the other three subunits, where no C-linker density is visible (Supplementary Videos 5,8). The structures where the gating ring displays intermediate (MthK Ca2+ state 2) and low (MthK Ca2+ state 3) tilt lack density for the C-linkers and the last 2 helical turns of TM2 for all 4 subunits (Fig. 3), similar to the Ca2+-bound MthK crystal structure20.
N-type inactivation in Ca2+-bound MthK
In contrast to the crystal structure, all three of our Ca2+-bound MthK cryo-EM structures display a strong elongated density inside the pore, which is connected to TM1 in both the high-tilt and medium-tilt structures (Fig. 4a, Extended Data Fig.11g). In the low-tilt structure, the connection is not visible, although the density in the pore is strong. We assigned this density to the N-terminal 17 amino-acid peptide, that so far escaped structural analysis and was shown to be involved in inactivation31. Density for the N-terminal peptide is absent in the other three subunits of the open-inactivated state as well as in our closed MthK structure, suggesting that it is highly mobile if not bound in the pore. Clearly resolved continuous density between TM1 of one of the four subunits and the pore-plug makes the assignment unambiguous.
Figure 4 |. MthK inactivates via N-terminus plugging the open state pore.

a, TM domains of MthK Ca2+ state 1. Density map (gray mesh) from 2 subunits with overlaid model in blue and yellow cartoon. N-terminal plug is in dark blue. b-c, Overlay between MthK crystal structure (PDB 3LDC, beige) and MthK Ca2+ open-inactivated state 1 with only subunits A and C (b) or only subunits B and D (c). Subunits are colored differently. d, TM domains of MthK Δ2–17 state 1. Colors as in (a). No density is observed inside the pore. e, Stopped-flow flux assays indicating MthK Δ2–17 no longer inactivates (red symbols). Blue symbols display flux rates in WT MthK (blue dash line is an exponential fit with τ=1.9±0.2 sec). LUVs composed of DOPC:POPG 3:1. Three independent experiments were performed for each construct. Symbols represent mean±s.d. (n=3). f, Free energy profile from atomistic umbrella sampling simulations of the N-terminus plugging the pore. The z axis indicates the position of the N-terminus inside the pore relative to the channel axis, calibrated as indicated in the inset and detailed in methods. Umbrella sampling trajectories were divided into n=4 blocks and error bars represented by ± 1 s.e.m. (Methods).
We tested if the N-terminus is responsible for inactivation by stopped-flow fluorometry32 of MthK wild type (WT) and a construct missing the 17 N-terminal residues (MthK Δ2–17). Upon 5 mM Ca2+ application, WT activates rapidly (within ms) and inactivates after a few seconds, as reported31,32 (Fig. 4e, Extended Data Fig.9c). MthK Δ2–17 also activates within milliseconds, similar to WT, but no longer inactivates, indicating that inactivation is due to the N-terminal peptide (Fig. 4e, Extended Data Fig.9a–d). Single-particle cryo-EM analysis of MthK Δ2–17 shows three different conformations, all in open states with different tilts of the gating ring, similar to WT (Fig. 4d, Extended Data Fig.10). The TM domains densities are well fit by the open state MthK crystal structure20. The gating ring is also similar to WT (Extended Data Fig.10). Unlike MthK WT though, no density was found inside the pore in any of the MthK Δ2–17 conformations (Fig. 4d, Extended Data Fig.11h).
MD simulations of the inactivation domain in the MthK pore
We investigated whether the binding of the N-terminus inside the pore, as observed in our MthK structures, is energetically favorable. We performed steered MD to pull the N-terminal peptide from its location in the pore, and then carried out equilibrium umbrella sampling simulations to compute the free energy of plugging the pore (Supplementary Video 6). The simulations show a deep ~17.9±0.5 kcal/mol free energy minimum when the peptide is bound deep in the pore (relative to outside the pore at the lowest position, −18 Å, sampled; Fig.4f). These simulations do not capture the dissociated (and likely disordered) state of the N-terminal peptide in the open state and thus cannot estimate the free energy change. However, this result suggests not only that the peptide would be stable in the open pore as an α-helix, but that the binding is optimal at the position observed in the structure (within 1 Å). Favorable interactions between the peptide and the pore during this simulation are between the two rings of glutamates at the bottom of the inner helices (E92 and E96) and the charged residues at the base of the inactivating peptide (R9, K10, R14, K17) (Extended Data Fig.9e). We also observe hydrophobic interactions between residues on the N-terminal peptide (V4, I5, I7, I8) and the bottom of TM2 (I84, F87, V91, L95) in three of the four subunits, creating a dewetted pocket in the pore (Extended Data Fig.9f).
MthK gating ring in the Ca2+-bound structures
The MthK gating ring has 8 RCK domains, where four are part of the full-length channel tetramer and the others are soluble RCK domains produced using a secondary start (M107) within the MthK gene19,20. Each channel subunit contains an RCK dimer (one intrinsic and one extrinsic). The RCK dimers from each subunit interact with adjacent subunit dimers via the “assembly interface”, and form a fourfold symmetric tetramer in the crystal structures of MthK and soluble RCK domains20,21. The gating ring structure of our Ca2+-bound closed is the same as our Ca2+-free closed MthK and is fourfold symmetric (Extended Data Fig.12). Ca2+ binds at only two out of the 6 binding site locations (sites 1a,b) previously described20,21,36 (Extended Data Fig.12c,d). The absence of Ca2+ ions bound at the other 2 sites suggest lower affinity for Ca2+ in the closed conformation, which is expected for the affinity of the closed state for ligand within an allosteric gating model where Ca2+-binding leads to channel opening37.
The gating ring of our Ca2+-bound open MthK did not form the same octameric structure observed in the crystal packing20, and is 2-fold symmetric (Extended Data Fig.11). This break from fourfold symmetry comes from packing differences at the assembly interfaces between adjacent RCK dimers (Extended Data Fig.11e,f). Data processing of the gating rings alone yielded 2 different structures, where the RCK dimers have slightly different shifts at the assembly interfaces, but overall very similar (Extended Data Figs.8,6c). The RCK dimer structure in the Ca2+-bound open state is nevertheless almost identical with that of the crystal structure38 (Extended Data Fig.12f). There are densities for Ca2+ at all 6 binding sites in the RCK dimer20,38 (Extended Data Fig.12g–m), suggesting that the open state has higher Ca2+ binding affinity than the closed state, expected for the affinity of the open state for ligand within an allosteric gating model where Ca2+-binding leads to channel opening37
Discussion
We report here the key functional states in the Ca2+-gating cycle of MthK (Fig. 5), a member of the BK channel family. Unlike Ca2+-free aBK, the Ca2+-free MthK structure we report is different from the open state from both the crystal structure20 and our open cryo-EM structures, and is consistent with a closed channel: the pore-lining helices straighten at the hinge glycine19 and sterically seal shut the permeation pathway at the bundle-crossing. This constriction remained during MD simulations. This is in apparent contrast with experiments on both BK and MthK where it has been shown that although more restrictive, the closed conformation still allowed entry of certain intracellular compounds into the inner pore cavity16,18,39. One possibility is that such compounds may gain access through the fenestrations that open in the membrane between the TM2 helices when channels close. The diameter of these fenestrations is large enough to accommodate even the larger blockers, and lipids were observed to enter through these fenestrations in the MD simulations, with up to 6 lipid tails partially penetrating inside the pore (Fig.2a, inset). Alternatively, blockers may enter the cavity through the bundle crossing, either via channel breathing motions or during the infrequent times the channel opens in the absence of Ca2+ 32,40,41. More investigations are needed to determine how these molecules access the closed channel cavity.
Figure 5 |. Scheme of Ca2+-gating and inactivation cycle in MthK.

a, MthK structures, and b, cartoons of closed, open, and open-inactivated conformations.
Several conformations were determined in the presence of Ca2+. About 7% of all particles were in closed conformation despite having Ca2+ bound to the gating ring, which correlates with the measured single-channel Po (~0.95). The remaining particles (~80%) fall into different groups whose common features are an open pore and RCK dimers in an “activated” Ca2+-bound state. The multiple open structures with different gating ring tilts are quasi-equally distributed among the differently tilted classes, suggesting a flat energy landscape, and indicative of a highly dynamic open state. MD simulations of the closed MthK also indicated a dynamic channel with gating ring rocking, suggesting that this flexibility is an inherent property of the protein, regardless of state, but enhanced by Ca2+-binding. MD revealed how RCK rocking propagated to bending of the gate-forming TM2 helices, implying that the larger motions of the Ca2+-bound gating ring may induce pore opening. RCK dimers where also observed to contact lipids in the membrane, suggesting lipid modulation of MthK gating.
We propose that when Ca2+ binds to the RCK domains, the gating ring undergoes a large conformational change (Supplementary Video 7), which tugs at the C-linker, allowing the TM2 helices to kink open at the hinge glycine (Supplementary Videos 2, 8). This large motion is associated with unfolding of the last two helical turns of TM2 and the C-linker detaching from the RCK domain and becoming disordered. The energy required to break the protein-protein interactions and unfold these domains to open the channel is in part provided by Ca2+-binding to the RCK domains. The channel thus functions like a mechanical machine, translating Ca2+-binding into protein unfolding and mechanical pull on the gates to open the channel.
Similar to other inactivation peptides3,42,6, the MthK inactivation peptide has a mainly hydrophobic tip that fits neatly in the hydrophobic inner pore, and a positively charged base, positioned near the two rings of glutamates that line the permeation pore. Previous studies have shown that disrupting the hydrophobic tip slows inactivation, and that a peptide containing only the first few hydrophobic residues does not block the channel, suggesting that additional interactions of charged residues with the pore are also required3,31,43.
Studies on Shaker K+ channels proposed that the net charge of the inactivation peptide only contributed to the association rate with the channel via long-range electrostatic interactions43,44. In contrast, here, MD simulations showed that the peptide is energetically favored inside the pore, partly due to interactions between the two rings of glutamates at the pore entrance and the positively charged base of the inactivation peptide. Shaker does not possess the two rings of glutamates present in the BK-family, which likely change the nature of the interaction with the inactivation peptide. This is consistent with the lack of precise sequence conservation of inactivation “balls” in different K+ channels, and reports that the inactivation kinetics for a particular inactivation “ball”-channel pair depended on the sequences of both peptide and channel pore2.
A previous study suggested that the ‘ball’ peptide binds in an extended conformation inside the pore7. Other studies indicate that inactivation peptides free in solution display conformational heterogeneity, with some showing ordered structures and α-helical stretches45–48. Although the resolution of our open channels is not sufficient to resolve a helical pitch, we modeled the peptide as a helix inside the pore due to its strong tubular density, structure prediction, the MD results, and the lack of space available in the density if the peptide was extended. The “chain” length had previously been associated with the rate of inactivation, where the shorter the chain the faster the rate3. However, the MthK “ball” peptide does not have a long “chain” and inactivates slowly (seconds)31,32 while the Shaker “ball” is attached to a long “chain” and inactivates in milliseconds3,42, suggesting that the chain length is only one determinant for the inactivation rate. In light of our results, previous studies suggesting that the N-terminus inactivates MthK via an allosteric mechanism31 need to be revisited. Furthermore, we speculate that lipid bilayer properties contribute to the observed differences in the MthK inactivation phenotypes28,31,32,36,40,41, although more experiments are required.
METHODS
MthK expression and purification
The MthK channel gene (both MthK WT and the MthK Δ2–17 construct, which is missing the first N-terminal 16 amino acid residues), cloned in pQE82 vector with a carboxy-terminal hexahistidine tag, was transformed into XL1-Blue cells (Agilent), and grown at 37°C in Luria-Bertani media supplemented with 200 μg/ml ampicillin for selection. The expression of MthK was induced at a cell density (OD600) of 1 by incubating with 400 μM IPTG (US Biological) for 3 h at 37°C.
For purification, cell pellets were resuspended in 50 ml breaking buffer (100 mM KCl, 50 mM Tris pH 7.6 with 1 μM Leupeptin/Pepstatin (Roche) and 0.17 mg/ml PMSF(Roche)) and sonicated with a probe sonicator at 60–75% power. The membranes were extracted for 2 hours at room temperature using 28 mM decyl maltoside (DM; Anatrace), and then centrifuged at 17500g for 45 minutes at room temperature. The supernatant was applied to a Co2+ column (GE Healthcare) pre-equilibrated in buffer B (100 mM KCl, 20 mM Tris, 5 mM DM, pH 7.6). The column was washed with buffer B with 20 mM imidazole (pH 7.6). The channel was subsequently eluted from the column using buffer B with 400 mM imidazole (pH 7.6). The His-tag was cleaved immediately after the protein was eluted by adding 1 U thrombin (Roche) per 6 mg of protein, and incubating for 3 h at room temperature. MthK was further purified on a Superdex-200 (GE Healthcare) gel filtration column in buffer B. The protein was concentrated to 10 mg/ml using 50,000 MWCO Amicon concentrators (Millipore).
Nanodisc reconstitution
To reconstitute MthK into nanodiscs, lipid mixtures composed of 3:1 1-palmitoyl-2-oleoyl phosphatidylethanolamine (POPE):phosphatidylglycerol (POPG) were prepared from chloroform stock solutions (Avanti Polar Lipids). Lipids were dried under constant nitrogen stream, rinsed with pentane to remove residual chloroform, and dried again to form a lipid film. The lipid film was then dissolved in 20 mM HEPES pH 7.5 (or 8.5 for the sample where Ca2+ was added after the purification), 100 mM KCl, 2% w/v CHAPS by sonication to achieve the final concentration of 20 mM.
Purified MthK was mixed with MSP1E3 (expressed from the plasmid #20064 from Addgene) and the lipid mixtures in the molar ratios 1:2:85 (MthK(monomer) : MSP1E3 : POPE,POPG). After incubating for 1 h at room temperature, bio-beads SM-2 (Bio Rad, 20 mg per 100 μl mixture) were added to remove the detergent and initiate reconstitution. The bio-beads were removed after 3 h of gentle shaking at room temperature, and the same amount of bio-beads was added again to the solution for an additional 12 h of continuous shaking at room temperature. Supernatant was collected and filtered through a 0.22 μm Spin-X centrifugation tube filter (Costar) before applying to a Superose 6 (GE Lifesciences) equilibrated with 20 mM HEPES pH 7.5 (or 8.5 for the sample where Ca2+ was added after the purification), 100 mM KCl at room temperature. The peak fraction corresponding to MthK in lipid nanodiscs (Extended Data Fig.2) was collected and concentrated using a 100 kDa cut-off Amicon concentrator (Millipore).
Grid preparation and EM data collection
To obtain MthK closed state, MthK-containing nanodiscs concentrated to 7 mg/ml (1 Abs = 1 mg/ml) were supplemented with 5 mM EDTA and 3 mM fluorinated Fos-choline-8 (Fos8-F, Anatrace) right before freezing. For both WT MthK and MthK Δ2–17 in the presence of Ca2+, MthK nanodisc (~10mg/ml) was supplemented with 5 mM CaCl2 and 3mM Fos8-F right before freezing. The same freezing procedure was used for both samples as follows: 3.5 μl of sample was applied to a glow-discharged gold grid (UltrAUfoil R1.2/1.3, 300 mesh, Quantifoil). After incubating for 10 s at 22 °C and 100% humidity, excessive liquid was removed by blotting for 2 s (blot force 0) and the grid was plunge frozen in liquid ethane using a Vitrobot Mark IV (FEI, Thermo Fischer Scientific).
The frozen grids with the EDTA-MthK sample were imaged on a Titan Krios (FEI, Thermo Fischer Scientific) operated at 300 kV equipped with a GIF Quantum Imaging Filter (no slit inserted) and a K2 direct electron detector (Gatan) using SerialEM49. 3961 micrographs were acquired in super-resolution mode at a calibrated pixel size of 1.05878 Å/pixel (0.52939 Å/pixel super-resolution) with 35 frames and 7 s exposure time at a total dose of 49.32 e−/Å2 (dose per frame 1.409 e−/Å2/frame). The estimated defocus range was −0.5 to −3 μm.
The dataset for the MthK with Ca2+ sample was collected on a Titan Krios equipped with a K2 summit direct electron detector and Cs corrector using Leginon50. A total dose of 52 e−/Å2 was accumulated over 40 frames (1.3 e−/Å2/frame) and a total exposure time of 8 s (200 ms/frame). The defocus range was −1.6 to −2.4 μm.
The dataset for the MthK Δ2–17 with Ca2+ sample was collected on a Titan Krios equipped with a K2 summit direct electron detector using Leginon50. A total dose of 57 e−/Å2 was accumulated over 40 frames (1.425 e−/Å2/frame) and a total exposure time of 8 s (200 ms/frame). The defocus range was −1.4 to −2.4 μm.
Image processing
For the EDTA-MthK sample, all processing steps were done in Relion 3.051,52 and cryoSPARC53. 3961 super-resolution movies stack were motion corrected, dose-weighted and binned by 2 using MotionCor254. The contrast transfer functions (CTF) on the resulting dose-weighted micrographs were determined by CTFFIND455. Particle coordinates were obtained by template-based auto-picking in Relion and the particles extracted were two-times binned. After two rounds of 2D classification the resulting 360,273 particles were 3D classified without symmetry into 20 classes using an initial map from cryoSPARC53, lowpass filtered to 40 Å as a reference. 288,133 particles from eight classes were selected and further classified in 3D into 10 classes using the same reference. The best 5 classes showing the TM2-RCK-linker had small differences in the degree if tilt between the TM domain and the gating ring. However, since the tilt angles were small (less than 4 degrees), we combined all particles. These selected 229,618 particles from these classes were re-extracted, unbinned, and subjected to 3D refinement with C4 symmetry using the same cryoSPARC reference, lowpass-filtered to 40 Å, resulting in a 3.6 Å resolution map. From this point on, all processing steps were done with C4 symmetry. To improve the reconstruction, beamtilt and per particle CTF value estimation were performed using CTF refinement. Bayesian polishing was then used for a per-particle motion correction resulting in a 3.3 Å resolution map by 3D refinement using a mask around the protein excluding the nanodisc. Subsequent 3D classification without alignment allowed to further separate particles into different classes of which only one class with 80904 particles showed a resolved transmembrane domain after refinement resulting in a 3.57 Å resolution map. All mentioned resolutions were estimated by Relion3 postprocessing using the 0.143 FSC cut-off criterion. All masks for postprocessing excluded the nanodisc.
The MthK with Ca2+ dataset was processed with both Relion 3.0 and cryoSPARC 2.051,45,53. After motion correction and manual check, 4545 good images were retained.1,426,050 particles were picked by Relion3 autopicking. After 2D classification, 909,563 particles were further classified into 16 classes using Relion, using the MthK EDTA map lowpass-filtered to 40 Å as a reference. The classes were then refined by cryoSPARC253 non-uniform refinement, and the classes without transmembrane domain density and those with a dumbbell shape were discarded. The particles from each remaining classes were transformed to star files using csparc2star.py (https://github.com/asarnow/pyem/blob/master/csparc2star.py), and further 3D classified without alignment into 8 classes in Relion, with a mask surrounding the transmembrane domain only. The classes with resolved transmembrane domain were saved and used for signal subtraction to remove nanodisc density. The signal subtracted particles from each class were further refined in Relion3. This procedure yielded 10 final classes, with one class identical with the closed state determined in the EDTA conditions, and the other 9 with the TM2s in an “open-like” conformation (Extended Data Fig.5–6).
In order to obtain the open RCK domain-only structure, all particles with the TMD domains in the open conformation from the initial 3D classification were pooled. The particles were used for refinement in Relion 3 with a mask surrounding the RCK domain, then signal subtracted to exclude all signals except the RCK domain. The signal subtracted particles were used for further refinement in Relion3 with and without imposed C2 symmetry. Two different classes were obtained in Relion3 using 3D classification without alignment, and T=12. The two classes have slight differences, and each class was refined with and without C2 symmetry. There are no differences between the structures refined with and without C2 symmetry, indicating that the RCK domains indeed adopt the C2 symmetry. We discussed and deposited the structure refined with C2 symmetry due to their higher resolution.
Data processing for MthK Δ2–17 with Ca2+ was the same as for MthK WT with minor differences. Using Relion 3.051,52, we removed junk particles via 2D classification, 922556 particles were used for 3D classification in 16 classes. The classes were selected and refined with cryoSPARC253 non-uniform refinement53, and the classes without TMD density and those with a dumbbell shape were discarded. No closed state was detected in the dataset, and the particles fall into 3 groups of open states according to the tilting between TMD and gating ring. The particles from classes in each group were combined, refined and focused classification performed on TMD without alignment with Relion 3.0. The classes with good TMD density were used for signal subtraction to remove signal from the nanodisc. The signal subtracted particles in each group were used for final refinement in Relion 3.0. For the RCK domain-only structures, all particles from the initial 3D classification were combined and 3D refinement was run in Relion 3.0, then signal subtracted to keep only the gating ring. The signal-subtracted particles were further refined and classified using the same procedure as for the MthK WT dataset.
Model building
Model building for the Ca2+-free MthK density was started with one subunit. PDBs for a Ca2+-free RCK dimer (PDB 2FY8) and the transmembrane domain (PDB 3LDC, residues 19–79) were docked into the density map using UCSF Chimera56. The fit into the density map was further improved by jigglefit57. Residue Asn184 in both RCKs was mutated to Asp184 to resemble the wildtype and missing residues 80–114 (TM2 and TM2-RCK-linker) were de-novo build following the density using COOT58. The resulting monomer model was refined in real space using PHENIX59. The tetramer was generated by placing four monomers in the density map in UCSF Chimera. The model was further subjected to real space refinement including morphing and simulated annealing while applying secondary structure constrains and non-crystallographic symmetry. Rotamer outliers were fixed and validation of the final structures were done by Molprobity and EMRinger60. Furthermore, all atoms of the model were randomly displaced by 0.5 Å and the resulting structure was refined against the first half map. To test for overfitting, Fourier shell correlations of the refined model against the sum of both half-maps was calculated. To avoid any influence from the nanodisc density, the summed map was masked using the same mask as for postprocessing.
The open state Ca2+-bound RCK domain model was started by rigid fitting of the Ca2+ bound RCK dimer(PDB 4L73) into the density using UCSF Chimera56. The model was further refined in real space using PHENIX59 and manually adjusted in Coot58. Rotamer outliers were fixed and validation of the final structures were done by Molprobity and EMRinger60.
For the full length MthK Ca2+ bound closed state, the model of MthK with EDTA was rigid fitted into the density using UCSF Chimera56. The model was checked in Coot and Ca2+ ions were added according to density58. The resulting model was further refined in real space using PHENIX59.
For the full length MthK Ca2+ bound open-inactivated state 1, the models of open state RCK domain and crystal structure of TM domain(PDB 3LDC) were rigid-fitted into the density using UCSF Chimera56, the missing residues of N-terminal and C-linker were manually build in Coot58. The resulting model were used for refinement in Rosetta61. Due to the relatively low overall resolution maps of the Ca2+-bound open states, the RCK domains were kept unchanged during refinement. Because there are no obvious side chain densities in the map, we truncated the side chains of the residues to generate a poly-alanine model.
For the full length MthK Ca2+ bound open-inactivated state 2, the TM domain from open-inactivated state 1 and the open state RCK domain were rigid-fitted into the density using UCSF Chimera56. The fitting was manually checked in Coot58 and all the TM helices fit the density (Extended Data Fig.11g). Due to the low resolution of the density map, no further refinement was conducted. The side chains of the residues were truncated to generate a poly-alanine model.
For the full length MthK Ca2+ bound open-inactivated state 3, the crystal structure of TM domain (PDB 3LDC) and the open state RCK domain were rigid-fitted into the density using UCSF Chimera56. The fitting was manually checked in Coot58 and all the TM helices fit into the density (Extended Data Fig.11g). Due to the low resolution of the density map, no further refinement was conducted. The side chains of the residues were truncated to generate a poly-alanine model.
For the full length MthK Δ2–17 states, the crystal structures of TM domain (PDB 3LDC) and the open state RCK domain were rigid-fitted into the density using UCSF Chimera56. The fitting was manually checked in Coot58 and all the TM helices fit into the density (Extended Data Fig 11h). Due to the low resolution of the density map, no further refinement was conducted. The side chains of the residues were truncated to generate a poly-alanine model. For the RCK domain of MthK Δ2–17, the wildtype RCK domain were fitted into the density by UCSF Chimera56. The structures were further refined by PHENIX59 and manually adjusted in Coot58.
All structure figures and movies were rendered using UCSF Chimera56, Pymol62, and the pore radius was calculated with the program HOLE63. The Secondary structure prediction was done by PSIPRED server64.
Single-channel recording using planar lipid bilayers and data analysis
Single-channel recording was performed using a horizontal lipid bilayer setup as previously described65. The decane-solubilized POPE:POPG (3:1) mixture was used to form lipid bilayers, which were monitored electrically with a pulse protocol in Clampex (Axon Instruments). MthK WT or Δ2–17-containing liposomes applied to the cis-chamber fused with the existing bilayer and MthK currents were recorded in response to applied voltage in symmetrical 200 mM K+ solution (190 mM KCl, 10 mM KOH, 10mM HEPES, pH 8.5) with an Axopatch 200 amplifier (Axon Instruments) sampled at 10 kHz and low-pass filtered at 2–5 kHz. The trans (intracellular) solution contained 0 or 5 mM Ca2+. Single-channel data were analyzed using Clampfit 9.0 (Axon Instruments) as previously described66.
MthK reconstitution into ANTS-loaded LUVs
MthK WT and Δ2–17 reconstitution into LUVs for stopped-flow assays was performed as described66. 15 mg of the POPE:POPG mixture (3:1 ratio) was dried under nitrogen gas, and kept in a desiccator under vacuum overnight to remove any remaining chloroform. The lipid mixture was solubilized in 1 ml reconstitution buffer (100 mM KNO3, 10 mM HEPES, pH 7.0) by adding 35 mM CHAPS, and sonicating to clarity with an Avanti Sonicator (Avanti Polar Lipids).
Purified MthK WT or MthK Δ2–17was added to the solubilized lipids at the ratio of 30 μg protein per mg lipid, and incubated at room temperature for 30 min, following by adding 1 ml of 100 mM KNO3, 10 mM HEPES (pH 7.0), 75 mM 8-aminonaphthalene-1,3,6-trisulfonic acid disodium salt (ANTS, Life Technologies). LUVs were formed by detergent removal by adding 1 g of BioBeads in an additional 2 ml of reconstitution buffer and rotating in a glass tube for 2h at room temperature. The resulting vesicles were sonicated for 20 s in the Avanti sonicator, and extruded through a 100-nm-pore polycarbonate filter (Avanti Mini-Extruder). The excessive ANTS was removed from the extravesicular solution using PD-10 desalting columns (GE Healthcare) and LUVs were eluted with assay buffer (140 mM KNO3 and 10 mM HEPES, pH 7.0).
Stopped-flow Tl+ flux assay and data analysis
Channel activity was estimated as described67,68 from the initial rate of fluorescence quenching following rapid mixing of the ANTS-loaded LUVs with a Tl+-containing buffer using a sequential mixing protocol on a SX-20 stopped-flow spectrofluorometer (Applied Photophysics). The channels were activated with either 5 or 17 mM Ca2+. The solutions used included a premix solution (140 mM KNO3 and 10 mM HEPES, 2X [channel activator], pH 8.5 with Ca2+ as a channel activator), a control solution with no quencher (140 mM KNO3, 10 mM HEPES, 1X [activator], pH 8.5), and a quench solution (94 mM KNO3, 50 mM TlNO3, 10 mM HEPES, 1X [activator], pH 8.5).
To assay channel activity, liposomes containing MthK channels (WT or Δ2–17) were mixed with the premix solution in a 1:1 ratio in the delay loop where the mixture was incubated for defined times. The sample was then mixed 1:1 with either the control solution or the quench solution in the optical cell to record ANTS fluorescence. Each sample-experiment combination was performed six to ten times. The data analysis for the stopped-flow Tl+ flux experiments was performed using Origin 6.0 (OriginLab). The fluorescence quenched data were internally normalized to the maximum activity from experimental controls, and then fitted a stretched exponential function to the first 100 ms of the quench trace. The τ0 and β values from the fits were subsequently used to calculate the relative fluorescence quench (Tl+ flux) rates at 2 ms67,68. Protein-free liposomes were used as an additional control. Three independent proteoliposome preparations were assayed, and the reported results denote mean±s.d.
MD Simulation
Molecular dynamics simulations were performed starting with the closed conformation of the MthK closed channel embedded in lipid bilayers containing 1032 lipids (POPE:POPG in ratio 3:1; to match that used in the cryo EM nanodiscs), hydrated by ~90,470 explicit TIP3P water molecules and 150 mM KCl solution (containing 623 K+ and 245 Cl− ions, to ensure a charge neutral system), with each system containing ∼435,500 atoms. The systems were built with CHARMM69, equilibrated for 4–6 ns using NAMD 2.1370, prior to being simulated on the purpose-built supercomputer Anton 271. The CHARMM36 lipid72 and CHARMM22 protein force fields73 with CMAP corrections74 were used, assuming standard protonation states for titratable residues. Corrections to non-bonded interactions were applied between K+ ions and backbone carbonyls (depth 0.102 kcal/mol and position 3.64 Å of minimum) to better match experimental free energies of ion solvation in liquid amides, N-methylacetamide75. Ten independent simulations were performed, with two simulated for 500 ns and eight for 200 ns, totaling 2.6 μs. The NPT ensemble was imposed by using a Langevin piston76,77 in NAMD (Martyna-Tobias-Klein barostat on Anton 278) to maintain a pressure of 1 atm, and a Nosé-Hoover thermostat79,80 to maintain a temperature of 303 K. Bonds to hydrogen atoms were maintained with the RATTLE algorithm81 and electrostatic interactions calculated with Particle Mesh Ewald82 with a grid spacing of 1.5 Å and 6th order B-spline mesh interpolation in NAMD (default parameter optimization71 was used on Anton 2).
Gating ring tilt was computed from the angle between the membrane plane (normal vector approximated by that passing through the center of mass (COM) of the upper pore domain (residues 30–80) and the COM of the lower pore domain (residues 1–29 and 81–102) and the vector connecting the COMs of opposing RCK subunit C-lobes (residues 260–340), giving angles that are largely invariant to membrane fluctuations for best comparison to the Cryo-EM structures. The bend of the TM2 helix was calculated from two vectors, vupper connecting the COM of resides 71–74 to residues 94–97, and vlower connecting COM of residues 94–97 to 103–106; calculated as the difference in angles between each vector and the membrane normal, yielding positive/negative deflection when bent away/towards the membrane normal. To reveal the extent of correlation between changes in RCK and TM2 variables, we analyzed cross-correlations over a total simulation time T spanning all 10 simulations. The time-lagged cross-correlation (C12(τ)) between gating ring tilt (θ1; with mean and standard deviation ) and TM2 bend (θ2; with mean and standard deviation ) was computed as , allowing for a range of time lags (τ) between changes in each angle, with the central value, C12(0), representing the instantaneous correlation coefficient. Gate size at residues L95, I99 and Q103 in the TM2 helices (Fig. 2c and Extended Data Fig.4j) was computed as the distance of the residue’s Cα to the COM of the residues from all four subunits.
Vertical movement of each subunit’s N-lobe (residues 110 to 230) and C-lobe (260 to 340) was measured as the z-component of that segment’s COM relative to the mean z-position of lipid P atoms in the lower leaflet (within 15 Å of a point directly above the N- or C-lobe; Extended Data Fig.4i). The number of N- and C-lobe – lipid contacts was computed as the number of lipid heavy atoms in contact with that protein segment; within a cut off of 5 Å (to allow for different atom types; Extended Data Fig.4i). Vertical movement of the RCK K114 side chain NZ atom relative to the membrane (Extended Data Fig.4j) was calculated relative to the cryo EM structure. Root mean square displacement (RMSD) in RCK domains, shown in Extended Data Fig.4e–g, were computed as an overall value when aligning the tetramer of RCK dimers to the original cryo EM structure, or of each RCK dimer subunit when aligning to the tetramer (to represent deviations from rigid body rotation), based on the second half of the simulation. Individual measures for soluble RCK domains, as well as internal to the RCK subunits (by aligning to each subunit separately) are also reported.
The number of lipids in the pore cavity was evaluated from the occupancy inside a 7 Å radius sphere (encompassing the pore region where atoms were seen to enter), centered 6 Å below the COM of the pore domain. This was calculated either as the number of different lipid chains with any C atoms in this region, or the total number of methyl/methylene carbons in this region, after removing the first 50 ns of the simulation. Error bars represent the standard error of means from 10 independent simulations in all data.
Equilibrium umbrella sampling simulations of the N-terminal peptide exiting/entering the pore through the intracellular gate were performed on the pore-only MthK construct (residues 4 to 99). The peptide was first pulled from its bound starting position to an unbound state in 1 Å windows using steered MD at a rate of 1 ns per window with force constant 20 kcal/mol/Å. 19 windows were used, spanning from 0 to −18 Å, where the z position is defined as the center of mass of backbone of the outermost two helical turns of the N-terminal peptide (residues 4 to 11) relative to the COM of the backbone of the gate (residue 95 to 99), offset by −4 Å to set the zero at the initial bound position (Fig. 4f). The force constant was progressively decreased during 2 ns simulations for each window. During the umbrella sampling, harmonic constraints with force constant 2.57 kcal/mol/Å were used to constrain the z position in each window. A flat-bottomed harmonic constraint with force constant 10 kcal/mol/Å2 was applied to constrain the xy position of the peptide in a cylinder of a diameter 10 Å to ensure good lateral sampling as the peptide exited the pore. Each window was simulated for 40 ns, with the first 23 ns removed as equilibration (based on a convergence to within 1 kcal/mol was used) for calculation of the free energy profile of pore blocking in Fig. 4f. Error bars (standard error of means) were calculated by dividing the trajectory into four equal parts.
Extended Data
Extended Data Fig. 1. Sequence alignments.

a, Sequence alignment of MthK with human Slo1 and Aplysia californica (Ac) Slo1. Secondary structures of closed state MthK are labeled on top. b, Sequence alignment of MthK RCK domain with human Slo1 RCK1 and RCK2 domain. Blue regions indicate similarity and dark blue regions indicate identity. c, Sequence alignment shows inactivation N-terminal from MthK(accession number CEP 36137), Shaker B(accession number CAA 29917), Kv-β1.1(accession number CAA 50000), BK-β3a(accession number NP_741979), BK-β2a(accession number NP_001265840). d, Secondary structure prediction (PSIPRED server(see method)) indicates that the N-terminal 17 residues of MthK form a helix.
Extended Data Fig. 2 |. Single particle cryo-EM characterization of closed MthK in the absence of Ca2+.

a, Size exclusion chromatography (SEC) of MthK reconstituted in nanodiscs composed of 3:1 POPE:POPG lipids with MSP1E3. The main (highest amplitude) peak from SEC was separated using SDS-PAGE (inset), showing the components of MthK nanodiscs (indicated). b, Representative micrograph of the MthK-nanodisc sample in 0 Ca2+ and 5 mM EDTA (left). Selected 2D class averages (right). c, Final cryo-EM map of closed MthK colored by local resolution. d, Fourier shell correlation (FSC) curves between the two independently-refined half-maps after masking (black curve) and from cross validation between the atomic model, refined against half-map 1, against masked sum of both half-maps (red). e, Angular distribution of particles used in the reconstitution. f, Density of MthK EDTA closed state. Segmented cryo-EM density maps (grey mesh) of closed MthK in the absence of Ca2+. The fitted corresponding atomic model is in cyan.
Extended Data Fig. 3 |. Fenestrations and C-linker in closed MthK.

a-b, Surface representation of MthK closed (a) and open (pdb 3ldc) (b) state TM domains, colored by amino acid hydrophobicity. The membrane boundaries are indicated. No fenestration was observed in the open state. c-d, A tunnel drawn with HOLE, shows how fenestrations (drawn through only two opposing subunits) connect the lipid bilayer with the inside of the cavity (grey). e, The resolved C-linker domain and two extra helical turns of TM2 (blue) shown in one MthK subunit. f, Zoomed-in dashed square in e, showing direct interactions between residues in C-linker (blue) and the RCK N-lobe (green). The neighboring subunit is in beige. The residues that may contribute to C-linker stabilization via hydrophobic and electrostatic interactions are indicated.
Extended Data Fig. 4 |. Summary of RCK tilt, TM2 bend, conformational changes and lipid interactions from simulations.

a, Snapshot from one (out of the 10) representative simulation showing the maximum RCK tilt. Membrane deformations are indicated by the displacements of lipid phosphates (white spheres). Black dotted line highlights the bend of the front TM2 helix. b, Graphs showing variations in RCK tilt and TM2 bend shown for each of the 10 simulations where a positive/negative value represents tilting towards the subunit with TM2 located at the front/back. c, Detail showing the bend of TM2 helices. d, The mean time-lagged cross-correlation of RCK tilt and TM2 bend obtained from analysis of all 10 simulations shows how the correlation occurs instantaneously (zero lag) with a value of 0.25±0.05. Error bars are represented by ± 1 standard error of means based on n=10 independent simulations. e, Alignment on all four RCK domains. RCK dimers rotated upward (red arrows) within the gating-ring. f, Timeseries of RMSD of each subunit reveals slow relaxation over 300 ns, increasing due to the vertical rotations of the subunits as membrane interactions are formed, with asymmetric fluctuations seen during the simulation. g, RMSD time series of individual RCK dimers, revealing some maintained asymmetry. These changes occur due to changes in loops, although overall the structure is preserved, with lower RMSD values. All RMSD errors are between 0.01 and 0.04 Å, not shown. h, Channel structure at the end of a 500 ns simulation showing membrane interactions, indicating acidic and basic residues involved. i, Vertical movements of the C-lobe relative to the membrane (top panel) are well-correlated with tilting movements, and they lead to increased number of contacts between C-lobes and lipids (bottom panel), with similar results for N-lobes (not shown). j, There is little change in gate size at L95 (orange) and I99 (purple) during the simulation (top panel), however, the gate grows rapidly during the first several nanoseconds at Q103 (green). This growth is preceded by the upwards movement of K114 sidechain, positioned on the C-linker (bottom panel). This figure shows representative time series from 1 of the 10 independent simulations performed. See Supplementary Video 4.
Extended Data Fig. 5 |. Cryo-EM data processing workflow for the MthK Ca2+ dataset.

After refinement, the classes without clear TM density were discarded and marked by X. The classes were classified into 4 groups according to the tilting degree and colored according to the class name. Red for highly tilted classes, blue for medium tilted classes, green for mildly tilted classes and yellow for the closed state.
Extended Data Fig. 6 |. Overview of all the structures obtained from the MthK Ca2+ dataset.

a, The structures with clear TM density were kept, they were classified into 4 groups according to the tilt angle between the nanodisc (TMD) and RCK ring: highly tilted (red), medium tilted (blue), mildly tilted (green) and closed state (yellow). Finally, there are nine structures in total: three different structures in the highly tilted group (MthK Ca2+ states 1, 1.2, and 1.3), two different structures in the medium tilted group (MthK Ca2+ state 2, and 2.2), three different structures in the mildly tilted group (MthK Ca2+ state 3, 3.2, and 3.3), and one closed state. b, Cryo-EM data processing workflow for only the gating ring structures of the MthK Ca2+ dataset, excluding the closed state. Two different structures were identified by Relion 3D classification (named RCK state 1 and RCK state 2). c, Overlay of RCK states 1 and 2. Slight differences are observed between the 2 structures.
Extended Data Fig. 7 |. Single-particle cryo-EM characterization of MthK Ca2+-bound states.

a-d, MthK Ca2+ state 1 (highly-tilted) a, Final cryo-EM map colored by local resolution. b, FSC curve between two independently refined half-maps, after masking. c, Selected 2D class averages. d, Angular distribution of particles used in the reconstitution. e-h, MthK Ca2+ state 2 (medium-tilted) e,Final cryo-EM map colored by local resolution. f, FSC curve between two independently refined half-maps, after masking. g, Selected 2D class averages. h, Angular distribution of particles used in the reconstitution. i-l, MthK Ca2+ state 3 (mildly-tilted) i, Final cryo-EM map colored by local resolution. j, FSC curve between two independently refined half-maps, after masking. k, Selected 2D class averages. l, Angular distribution of particles used in the reconstitution. m-p, Ca2+-bound closed MthK. m, Final cryo-EM map colored by local resolution. n, FSC curve between two independently refined half-maps, after masking. o, Selected 2D class averages from particles. p, Angular distribution of particles used in the reconstitution.
Extended Data Fig.8 |. Single particle cryo-EM characterization of the gating ring structures in the MthK Ca2+ dataset.

a, Final cryo-EM map of RCK state 1 colored by local resolution. b, FSC curves between the two independently-refined half-maps of MthK Ca2+ RCK state 1 (black), and from cross validation between the atomic model refined against the final cryo-EM map (red). c, Angular distribution of particles used in the reconstitution of RCK state 1. d, Final cryo-EM map of RCK state 2 colored by local resolution. e, FSC curves between the two independently-refined half-maps of MthK Ca2+ RCK state 2 (black), and from cross validation between the atomic model refined against the final cryo-EM map (red). f, Angular distribution of particles used in the reconstitution of RCK state 2. g, Segmented cryo-EM density maps (grey mesh) of RCK state2. The fitted corresponding atomic model is in cyan.
Extended Data Fig. 9 |. Functional characteristics of MthK.

a, Single-channel characteristics of MthK Δ2–17 are similar to WT. Top, representative single-channel recording traces from MthK Δ2–17 in horizontal lipid bilayers made of POPE:POPG (3:1) liposomes in decane at +100 mV without and with 5 mM Ca2+. Traces are filtered at 200 Hz for display. Single-channel current-voltage curves (bottom left) and Po as a function of voltage (bottom right) for MthKΔ2–17 (red symbols) compared to WT (dashed black lines). For MthK WT, the symbols are mean ± s.e.m. of five measurements for all membrane potentials except at −100, 75, and 100 mV, which contained six measurements. For MthK Δ2–17, the symbols are mean ± s.e.m. of five (−50 mV), six (−75, 50, 125 mV), seven (−125 mV), eight (−25, 75 mV), and nine (25, 100 mV) measurements. Each measurement is from a separate bilayer. b, Relative Tl+ flux rates as a function of incubation time of MthK WT (blue) and MthK Δ2–17 (red)-containing POPE:POPG (3:1) liposomes with 5 mM Ca2+. Symbols are the mean ± s.d. from three independent experiments. c, Fluorescence quench curves for MthK WT-containing DOPC:POPG (3:1) liposomes after 1 or 10 s (dark and light blue, respectively) incubation with 5 mM Ca2+. Control fluorescence is in the absence of Tl+ (black). A small leak of Tl+ into liposomes was observed in the absence of Ca2+ (light grey) and in the MthK-free liposomes (dark grey). 3 times of experiments were done with similar results. d, Fluorescence quench curves for MthK Δ2–17-containing DOPC:POPG (3:1) liposomes after 1 or 10 s (brown and pink, respectively) incubation with 5 mM Ca2+. The control was performed similarly as that for the experiment with the MthK WT liposomes. Experiments were performed 3 times with similar results. e-f, Simulation snapshots illustrating salt bridges between the basic residues on the N-terminus (blue) and the ring of glutamates at the intracellular pore entrance (e), and hydrophobic interactions between the N-terminus (blue) and hydrophobic residues lining the pore cavity (f). Only three subunits of the MthK TMD are shown for clarity. The residues in stick representation are colored the same as the individual subunits. The calibration bar indicates the position of the COM of the peptide parallel to the channel pore axis (see Methods). g, Convergence of the free energy profile from umbrella sampling simulations for the N-termini peptide plugging the MthK pore (Fig. 4f). Convergence to within 1 kcal/mol was achieved in 23 ns.
Extended Data Fig. 10 |. Single-particle cryo-EM characterization of MthK Δ2–17 in the presence of Ca2+.

a-c,Cryo-EM map colored by local resolution, FSC curve between two independently-refined half-maps and angular distribution of particles for state 1. d-f,Cryo-EM map colored by local resolution, FSC curve between two independently-refined half-maps and angular distribution of particles for state 2. g-i,Cryo-EM map colored by local resolution, FSC curve between two independently-refined half-maps and angular distribution of particles for state 3. j-l, Cryo-EM map colored by local resolution, FSC curve between two independently-refined half-maps and angular distribution of particles for RCK state 1. m-o, Cryo-EM map colored by local resolution, FSC curve between two independently-refined half-maps and angular distribution of particles for RCK state 2.
Extended Data Fig. 11 |. Gating ring assembly in the open MthK structures and pore densities.

Cryo-EM density map top (a) and side (c) views, and b, atomic model of the gating ring structure. Interfaces and Ca2+ binding sites are indicated. The UP RCK dimers are in red-blue and the DOWN RCK dimers are in green-yellow. d, Cartoon illustrating the RCK dimer packing within the gating ring of the MthK crystal structure (pdb 1lnq, left, 4-fold symmetry) and our MthK open state (right, 2-fold symmetry). Illustrations of the assembly interface 1 (e) and assembly interface 2 (f), where the MthK gating ring from the crystal structure is in beige (pdb 1lnq), and from the cryo-EM open structure in green, blue, yellow, and red. The structures are aligned by blue subunit in (e) and red subunit in (f). g, TM domains of MthK open state 2, and open state 3. Density maps (gray mesh) from only 2 subunits are shown with overlaid model in blue and yellow cartoon. The N-terminal plug is in dark blue. h, TM domains of MthK Δ2–17 state 2 and state 3. Colors as in g.
Extended Data Fig. 12 |. The Ca2+ binding sites in the Ca2+-bound closed MthK and RCK state 2 gating ring structures.

a, Overlay of Ca2+ bound closed MthK (red) and Ca2+-free closed MthK (EDTA structure, blue). The two structures are very similar. b, Ca2+ binding sites in the Ca2+-bound closed MthK. Site 1a and 1b are indicated. Density map of Ca2+ binding site 1a (c) and 1b (d). Ca2+ is in orange. The water near the Ca2+ is in red. e, Overview of RCK state 2 structure. Color scheme is the same as in Fig 5. The RCK dimer is indicated and shown in detail in (f). f, Overlay of the RCK dimer from RCK state 2 detailed in e with the crystal structure of the Ca2+-bound RCK dimer (PDB 4L73, beige). g, The RCK dimer from RCK state 2 with the 6 Ca2+ binding sites indicated. Density map of Ca2+ binding site 1a (h), 1b (i), 2a (j), 2b (k), 3a (l), 3b (m). Ca2+ is colored in orange. The water close to Ca2+ is colored red. Residues forming the binding sites (indicated) are rendered in pink and blue sticks as they originate from adjacent subunits.
Extended Data Table 1 |.
Cryo-EM data collection, refinement and validation statistics of MthK WT Ca2+ bound states 1–3, MthK WT Ca2+ bound closed state, and RCK states 1–2.
| MthK Ca2+ state 1 (EMDB-20662) (PDB 6U6S) |
MthK Ca2+ state2 (EMDB-20664) (PDB 6U6E) |
MthK Ca2+ state3 (EMDB-20665) (PDB 6U6H) |
MthK Ca2+ closed (EMDB-20653) (PDB 6U5R) |
RCK state 1 (EMDB-20652) (PDB 6U5P) |
RCK state2 (EMDB-20650) (PDB 6U5N) |
|
|---|---|---|---|---|---|---|
| Data collection and processing | ||||||
| Magnification | 22500 | 22500 | 22500 | 22500 | 22500 | 22500 |
| Voltage (kV) | 300 | 300 | 300 | 300 | 300 | 300 |
| Electron exposure (e-/Å2) | 52 | 52 | 52 | 52 | 52 | 52 |
| Defocus range (urn) | −1.6 to-2.4 | −1.6 to-2.4 | −1.6 to-2.4 | −1.6 to−2.4 | −1.6 to−2.4 | −1.6 to−2.4 |
| Pixel size (Å) | 1.096 | 1.096 | 1.096 | 1.096 | 1.096 | 1.096 |
| Symmetry imposed | Cl | Cl | Cl | C4 | C2 | C2 |
| Initial particle images | 1,426,050 | 1,426,050 | 1,426,050 | 1,426,050 | 1,426,050 | 1,426,050 |
| Final particle images | 29,448 | 14,483 | 15,144 | 22,677 | 150,542 | 113,103 |
| Map resolution (Å) | 4.5 | 6.3 | 5 | 3.6 | 3.3 | 3.2 |
| FSC threshold | 0.143 | 0.143 | 0.143 | 0.143 | 0.143 | 0.143 |
| Map resolution range (Å) | 4.5‒6.5 | 6‒7.5 | 4.5‒6.5 | 3.5‒5.5 | 2.8‒3.4 | 2.6‒3.2 |
| Refinement | * | * | * | |||
| Initial model used (PDB code) | 3LDC | 3LDC | 3LDC | 2FY8 | 4L73 | 4L73 |
| Model resolution (Å) | 6.2 | 6.7 | 6.4 | 3.7 | 3.3 | 3.2 |
| FSC threshold | 0.5 | 0.5 | 0.5 | 0.5 | 0.5 | 0.5 |
| Model resolution range (Å) | 4.5−6.5 | 6−7.5 | 4.5−6.5 | 3.5−5.5 | 2.8−3.4 | 2.6−3.2 |
| Map sharpening B factor (A2) | −96 | −186 | −146 | −124 | −102 | −97 |
| Model composition | ||||||
| Non-hydrogen | 10489 | 10422 | 10352 | 16516 | 13308 | 13262 |
| atoms | 2133 | 2118 | 2104 | 2156 | 1776 | 1776 |
| Protein residues | 0 | 0 | 0 | 8 | 24 | 24 |
| Ligands B factors (Å2) | 40 | 44 | 44 | 61 | 48 | 34 |
| Protein | ||||||
| Ligand | - | - | - | 120 | 48 | 34 |
| R.m.s. deviations | 0.006 | 0.006 | 0.005 | 0.011 | 0.006 | 0.006 |
| Bond lengths (Å) | ||||||
| Bond angles (°) | 0.895 | 0.932 | 0.762 | 0.948 | 0.733 | 0.743 |
| Validation | ||||||
| MolProbity score | 0.79 | 0.62 | 0.57 | 1.68 | 1.5 | 1.39 |
| Clashscore | 0.46 | 0.07 | 0 | 5.12 | 4.07 | 2.73 |
| Poor rotamers (%) | 0 | 0 | 0 | 0 | 0 | 0 |
| Ramachandran plot | ||||||
| Favored (%) | 97.3 | 97.6 | 97.7 | 93.9 | 95.6 | 95.2 |
| Allowed (%) | 2.6 | 2.5 | 2.3 | 6.1 | 4.4 | 4.8 |
| Disallowed (%) | 0 | 0 | 0 | 0 | 0 | 0 |
indicates a poly-alanine model with side chains truncated and ligands removed.
Extended Data Table 2 |.
Cryo-EM data collection, refinement and validation statistics of MthK WT Ca2+ bound states 1–3, MthK WT Ca2+ bound closed state, and RCK states 1–2.
| MthK EDTA (EMDB-20663 (PDB 6U6D) |
MthK Ca2+ Δ2–17 state 1 (EMDB-20930) (PDB 6UX7) |
MthK Ca2+ Δ2–17 state2 (EMDB-20931) (PDB 6UXA) |
MthK Ca2+ Δ2–17 state3 (EMDB-20932) (PDB 6UXB) |
Δ2–17 Ca2+ RCK state 1 (EMDB-20925) (PDB 6UWN) |
Δ2–17 Ca2+ RCK state 1 (EMDB-20929) (PDB 6UX4) |
|
|---|---|---|---|---|---|---|
| Data collection and processing | ||||||
| Magnification | 130000 | 22500 | 22500 | 22500 | 22500 | 22500 |
| Voltage (kV) | 300 | 300 | 300 | 300 | 300 | 300 |
| Electron exposure (e-/Å2) | 49.32 | 57 | 57 | 57 | 57 | 57 |
| Defocus range (urn) | −0.5 to −3 | −1.4 to−2.4 | −1.4 to−2.4 | −1.4 to−2.4 | −1.4 to−2.4 | −1.4 to−2.4 |
| Pixel size (Å) | 1.05878 | 1.07 | 1.07 | 1.07 | 1.07 | 1.07 |
| Symmetry imposed | C4 | Cl | Cl | Cl | C2 | C2 |
| Initial particle images | 360,273 | 1,356,600 | 1,356,600 | 1,356,600 | 1,356,600 | 1,356,600 |
| Final particle images | 80,904 | 40,536 | 96,834 | 68,286 | 175,149 | 273,492 |
| Map resolution (Å) | 3.6 | 6.7 | 4.5 | 4.9 | 3.5 | 3.5 |
| FSC threshold | 0.143 | 0.143 | 0.143 | 0.143 | 0.143 | 0.143 |
| Map resolution range (Å) | 2.8–3.8 | 5–7 | 5–7 | 5–7 | 3.2–3.6 | 3.2–3.6 |
| Refinement | * | * | * | |||
| Initial model used (PDB code) | 2FY8 | 3LDC | 3LDC | 3LDC | 4L73 | 4L73 |
| Model resolution (Å) | 3.7 | 7 | 6.5 | 6.3 | 3.5 | 3.4 |
| FSC threshold | 0.5 | 0.5 | 0.5 | 0.5 | 0.5 | 0.5 |
| Model resolution range (Å) | 2.8–3.8 | 5–7 | 5–7 | 5–7 | 3.2–3.6 | 3.2–3.6 |
| Map sharpening B | −110 | −100 | −100 | −100 | −159 | −174 |
| factor (Å2) | ||||||
| Model composition | ||||||
| Non-hydrogen | 16770 | 10344 | 10344 | 10344 | 13258 | 13258 |
| atoms | 2156 | 2104 | 2104 | 2104 | 1776 | 1776 |
| Protein residues | 2 | 0 | 0 | 0 | 24 | 24 |
| Ligands | 50 | 45 | 45 | 45 | 72 | 58 |
| B factors (Å2) | ||||||
| Protein | ||||||
| Ligand | 50 | - | - | - | 47 | 33 |
| R.m.s. deviations | ||||||
| Bond lengths (Å) | 0.002 | 0.005 | 0.005 | 0.005 | 0.007 | 0.011 |
| Bond angles (°) | 0.487 | 0.774 | 0.775 | 0.775 | 0.711 | 0.816 |
| Validation | ||||||
| MolProbity score | 1.58 | 0.75 | 0.75 | 0.75 | 1.35 | 1.4 |
| Clashscore | 6.53 | 0 | 0 | 0 | 3.49 | 3.37 |
| Poor rotamers | 0.0 | 0 | 0 | 0 | 0.15 | 0.29 |
| (%) | ||||||
| Ramachandran plot | ||||||
| Favored (%) | 96.6 | 96.2 | 96.2 | 96.2 | 96.7 | 96 |
| Allowed (%) | 3.4 | 3.8 | 3.8 | 3.8 | 3.3 | 4 |
| Disallowed (%) | 0.0 | 0 | 0 | 0 | 0 | 0 |
indicates a poly-alanine model with side chains truncated and ligands removed.
Supplementary Material
ACKNOWLEDGEMENTS
All EM screening and the data collection for the Ca2+-bound MthK WT and Δ2-17 structures was performed at the Simons Electron Microscopy Center and National Resource for Automated Molecular Microscopy located at the New York Structural Biology Center, supported by grants from the Simons Foundation (349247), NYSTAR, and the NIH National Institute of General Medical Sciences (GM103310). We would like to specifically thank D. Bobe and L. Yen for their technical support during grid screening and L. Yen, M. Kopylov and E. Eng for their support during data collection. The data collection for the apo MthK structure was performed at the CryoEM core facility at UMass. Special thanks to C. Xu and K. Song for their support. Initial negative stain screening was performed at the Weill Cornell Microscopy and Image Analysis Core Facility, with the help of L. Cohen-Gould. We would like to thank B. Chanda and Y. Jiang for the generous gift of the non-inactivating MthK plasmid. We thank S. Scheuring and A. Accardi for critically reading the manuscript and D. Acehan and C. Boiteux for helpful discussions. This work was supported in part by a National Institutes of Health grant (R01GM088352) to CMN, and by the National Institutes of Health (U01- HL126273), National Health and Medical Research Council (APP1104259 and APP1141974), Australian Research Council (DP170101732), DE Shaw Anton 2 (PSCA17045P via NIH RC2GM093307), National Computational Initiative, and the Medical Advances Without Animals Trust to TWA.
Footnotes
COMPETING INTERESTS
The authors declare no competing interests.
DATA AVAILABILITY
The map of calcium-free and the 4 maps for calcium-bound MthK have been deposited with Electron Microscopy Data Bank (EMDB) with accession codes 20663, 20662, 20664, 20665 and 20653, respectively. The maps for the two calcium-bound RCK gating rings have been deposited with EMDB with accession codes 20652 and 20650. The maps for calcium-bound MthK Δ2–17 full length states and RCK gating ring states have been deposited with accession codes 20930, 20931, 20932, 20925, 20929. Atomic coordinates for the calcium free MthK, calcium-bound MthK, and the two calcium-bound RCK gating rings have been deposited with the Protein Data Bank with accession codes 6U6D, 6U68, 6U6E, 6U6H, 6U5R, 6U5P, 6U5N, respectively. Atomic coordinates for calcium-bound MthK Δ2–17 full length states and RCK gating ring states have been deposited with accession codes 6UX7, 6UXA, 6UXB, 6UWN, 6UX4. Extended Data Fig.9 contains raw single-channel and stopped-flow fluorescence decay data, which are available from the corresponding author upon request.
REFERENCES
- 1.Hille B Ion Channels of Excitable Membranes. 3rd edn, (Sinauer Associates, Inc., 2001). [Google Scholar]
- 2.Yellen G The moving parts of voltage-gated ion channels. Q Rev Biophys 31, 239–295 (1998). [DOI] [PubMed] [Google Scholar]
- 3.Hoshi T, Zagotta WN & Aldrich RW Biophysical and molecular mechanisms of Shaker potassium channel inactivation. Science (New York, N.Y.) 250, 533–538 (1990). [DOI] [PubMed] [Google Scholar]
- 4.Armstrong CM, Bezanilla F & Rojas E Destruction of sodium conductance inactivation in squid axons perfused with pronase. J Gen Physiol 62, 375–391, doi: 10.1085/jgp.62.4.375 (1973). [DOI] [PMC free article] [PubMed] [Google Scholar]
- 5.Bezanilla F & Armstrong CM Inactivation of the sodium channel. I. Sodium current experiments. J Gen Physiol 70, 549–566, doi: 10.1085/jgp.70.5.549 (1977). [DOI] [PMC free article] [PubMed] [Google Scholar]
- 6.Wallner M, Meera P & Toro L Molecular basis of fast inactivation in voltage and Ca2+-activated K+ channels: a transmembrane beta-subunit homolog. Proc Natl Acad Sci U S A 96, 4137–4142, doi: 10.1073/pnas.96.7.4137 (1999). [DOI] [PMC free article] [PubMed] [Google Scholar]
- 7.Zhou M, Morais-Cabral JH, Mann S & MacKinnon R Potassium channel receptor site for the inactivation gate and quaternary amine inhibitors. Nature 411, 657–661 (2001). [DOI] [PubMed] [Google Scholar]
- 8.Berridge MJ, Bootman MD & Roderick HL Calcium signalling: dynamics, homeostasis and remodelling. Nat Rev Mol Cell Biol 4, 517–529, doi: 10.1038/nrm1155 (2003). [DOI] [PubMed] [Google Scholar]
- 9.Sudhof TC Calcium control of neurotransmitter release. Cold Spring Harb Perspect Biol 4, a011353, doi: 10.1101/cshperspect.a011353 (2012). [DOI] [PMC free article] [PubMed] [Google Scholar]
- 10.Yang H, Zhang G & Cui J BK channels: multiple sensors, one activation gate. Front Physiol 6, 29, doi: 10.3389/fphys.2015.00029 (2015). [DOI] [PMC free article] [PubMed] [Google Scholar]
- 11.Geng Y & Magleby KL Single-channel kinetics of BK (Slo1) channels. Front Physiol 5, 532, doi: 10.3389/fphys.2014.00532 (2014). [DOI] [PMC free article] [PubMed] [Google Scholar]
- 12.Vergara C, Latorre R, Marrion NV & Adelman JP Calcium-activated potassium channels. Curr Opin Neurobiol 8, 321–329 (1998). [DOI] [PubMed] [Google Scholar]
- 13.Hite RK, Tao X & MacKinnon R Structural basis for gating the high-conductance Ca(2+)-activated K(+) channel. Nature 541, 52–57, doi: 10.1038/nature20775 (2017). [DOI] [PMC free article] [PubMed] [Google Scholar]
- 14.Tao X, Hite RK & MacKinnon R Cryo-EM structure of the open high-conductance Ca(2+)-activated K(+) channel. Nature 541, 46–51, doi: 10.1038/nature20608 (2017). [DOI] [PMC free article] [PubMed] [Google Scholar]
- 15.Zhou Y, Yang H, Cui J & Lingle CJ Threading the biophysics of mammalian Slo1 channels onto structures of an invertebrate Slo1 channel. J Gen Physiol 149, 985–1007, doi: 10.1085/jgp.201711845 (2017). [DOI] [PMC free article] [PubMed] [Google Scholar]
- 16.Li W & Aldrich RW State-dependent block of BK channels by synthesized shaker ball peptides. J Gen Physiol 128, 423–441 (2006). [DOI] [PMC free article] [PubMed] [Google Scholar]
- 17.Zhou Y, Xia XM & Lingle CJ Cysteine scanning and modification reveal major differences between BK channels and Kv channels in the inner pore region. Proc Natl Acad Sci U S A 108, 12161–12166, doi: 10.1073/pnas.1104150108 (2011). [DOI] [PMC free article] [PubMed] [Google Scholar]
- 18.Tang QY, Zeng XH & Lingle CJ Closed-channel block of BK potassium channels by bbTBA requires partial activation. J Gen Physiol 134, 409–436, doi:jgp.200910251[pii]10.1085/jgp.200910251 (2009). [DOI] [PMC free article] [PubMed] [Google Scholar]
- 19.Jiang Y et al. The open pore conformation of potassium channels. Nature 417, 523–526 (2002). [DOI] [PubMed] [Google Scholar]
- 20.Jiang Y et al. Crystal structure and mechanism of a calcium-gated potassium channel. Nature 417, 515–522 (2002). [DOI] [PubMed] [Google Scholar]
- 21.Ye S, Li Y, Chen L & Jiang Y Crystal structures of a ligand-free MthK gating ring: insights into the ligand gating mechanism of K+ channels. Cell 126, 1161–1173 (2006). [DOI] [PubMed] [Google Scholar]
- 22.Yuan P, Leonetti MD, Hsiung Y & MacKinnon R Open structure of the Ca2+ gating ring in the high-conductance Ca2+-activated K+ channel. Nature 481, 94–97, doi: 10.1038/nature10670 (2011). [DOI] [PMC free article] [PubMed] [Google Scholar]
- 23.Lorenzo-Ceballos Y, Carrasquel-Ursulaez W, Castillo K, Alvarez O & Latorre R Calcium-driven regulation of voltage-sensing domains in BK channels. Elife 8, doi: 10.7554/eLife.44934 (2019). [DOI] [PMC free article] [PubMed] [Google Scholar]
- 24.Miranda P, Holmgren M & Giraldez T Voltage-dependent dynamics of the BK channel cytosolic gating ring are coupled to the membrane-embedded voltage sensor. Elife 7, doi: 10.7554/eLife.40664 (2018). [DOI] [PMC free article] [PubMed] [Google Scholar]
- 25.Zhang G et al. Deletion of cytosolic gating ring decreases gate and voltage sensor coupling in BK channels. J Gen Physiol 149, 373–387, doi: 10.1085/jgp.201611646 (2017). [DOI] [PMC free article] [PubMed] [Google Scholar]
- 26.Barrett JN, Magleby KL & Pallotta BS Properties of single calcium-activated potassium channels in cultured rat muscle. J Physiol 331, 211–230 (1982). [DOI] [PMC free article] [PubMed] [Google Scholar]
- 27.McManus OB & Magleby KL Kinetic states and modes of single large-conductance calcium-activated potassium channels in cultured rat skeletal muscle. J Physiol 402, 79–120 (1988). [DOI] [PMC free article] [PubMed] [Google Scholar]
- 28.Zadek B & Nimigean CM Calcium-dependent gating of MthK, a prokaryotic potassium channel. J Gen Physiol 127, 673–685 (2006). [DOI] [PMC free article] [PubMed] [Google Scholar]
- 29.Li Y, Berke I, Chen L & Jiang Y Gating and inward rectifying properties of the MthK K+ channel with and without the gating ring. J Gen Physiol 129, 109–120 (2007). [DOI] [PMC free article] [PubMed] [Google Scholar]
- 30.Solaro CR & Lingle CJ Trypsin-sensitive, rapid inactivation of a calcium-activated potassium channel. Science 257, 1694–1698, doi: 10.1126/science.1529355 (1992). [DOI] [PubMed] [Google Scholar]
- 31.Kuo MM, Maslennikov I, Molden B & Choe S The desensitization gating of the MthK K+ channel is governed by its cytoplasmic amino terminus. PLoS Biol 6, e223, doi: 10.1371/journal.pbio.0060223 (2008). [DOI] [PMC free article] [PubMed] [Google Scholar]
- 32.Posson DJ, Rusinova R, Andersen OS & Nimigean CM Calcium ions open a selectivity filter gate during activation of the MthK potassium channel. Nat Commun 6, 8342, doi: 10.1038/ncomms9342 (2015). [DOI] [PMC free article] [PubMed] [Google Scholar]
- 33.Thomson AS et al. Initial steps of inactivation at the K+ channel selectivity filter. Proc Natl Acad Sci U S A 111, E1713–1722, doi: 10.1073/pnas.1317573111 (2014). [DOI] [PMC free article] [PubMed] [Google Scholar]
- 34.Doyle D et al. The structure of the potassium channel: molecular basis of K+ conduction and selectivity. Science 280, 69–77 (1998). [DOI] [PubMed] [Google Scholar]
- 35.Zhou Y, Morais-cabral J, Kaufman A & Mackinnon R Chemistry of ion coordination and hydration revealed by a K+ channel-Fab complex at 2 . 0 A resolution. Nature 414, 43–48 (2001). [DOI] [PubMed] [Google Scholar]
- 36.Pau VP et al. Structure and function of multiple Ca2+-binding sites in a K+ channel regulator of K+ conductance (RCK) domain. Proc Natl Acad Sci U S A 108, 17684–17689, doi: 10.1073/pnas.1107229108 (2011). [DOI] [PMC free article] [PubMed] [Google Scholar]
- 37.Colquhoun D Binding, gating, affinity and efficacy: the interpretation of structure-activity relationships for agonists and of the effects of mutating receptors. Br J Pharmacol 125, 924–947 (1998). [DOI] [PMC free article] [PubMed] [Google Scholar]
- 38.Smith FJ, Pau VP, Cingolani G & Rothberg BS Structural basis of allosteric interactions among Ca2+-binding sites in a K+ channel RCK domain. Nat Commun 4, 2621, doi: 10.1038/ncomms3621 (2013). [DOI] [PubMed] [Google Scholar]
- 39.Wilkens CM & Aldrich RW State-independent block of BK channels by an intracellular quaternary ammonium. J Gen Physiol 128, 347–364 (2006). [DOI] [PMC free article] [PubMed] [Google Scholar]
- 40.Posson DJ, McCoy JG & Nimigean CM The voltage-dependent gate in MthK potassium channels is located at the selectivity filter. Nat Struct Mol Biol 20, 159–166, doi:nsmb.2473[pii]10.1038/nsmb.2473 (2013). [DOI] [PMC free article] [PubMed] [Google Scholar]
- 41.Pau VP, Abarca-Heidemann K & Rothberg BS Allosteric mechanism of Ca2+ activation and H+-inhibited gating of the MthK K+ channel. J Gen Physiol 135, 509–526, doi: 10.1085/jgp.200910387 (2010). [DOI] [PMC free article] [PubMed] [Google Scholar]
- 42.Zagotta WN, Hoshi T & Aldrich RW Restoration of inactivation in mutants of Shaker potassium channels by a peptide derived from ShB. Science 250, 568–571 (1990). [DOI] [PubMed] [Google Scholar]
- 43.Murrell-Lagnado RD & Aldrich RW Interactions of amino terminal domains of Shaker K channels with a pore blocking site studied with synthetic peptides. J Gen Physiol 102, 949–975, doi: 10.1085/jgp.102.6.949 (1993). [DOI] [PMC free article] [PubMed] [Google Scholar]
- 44.Murrell-Lagnado RD & Aldrich RW Energetics of Shaker K channels block by inactivation peptides. J Gen Physiol 102, 977–1003, doi: 10.1085/jgp.102.6.977 (1993). [DOI] [PMC free article] [PubMed] [Google Scholar]
- 45.Antz C et al. NMR structure of inactivation gates from mammalian voltage-dependent potassium channels. Nature 385, 272–275, doi: 10.1038/385272a0 (1997). [DOI] [PubMed] [Google Scholar]
- 46.Bentrop D, Beyermann M, Wissmann R & Fakler B NMR structure of the “ball-and-chain” domain of KCNMB2, the beta 2-subunit of large conductance Ca2+- and voltage-activated potassium channels. J Biol Chem 276, 42116–42121, doi: 10.1074/jbc.M107118200 (2001). [DOI] [PubMed] [Google Scholar]
- 47.Schott MK, Antz C, Frank R, Ruppersberg JP & Kalbitzer HR Structure of the inactivating gate from the Shaker voltage gated K+ channel analyzed by NMR spectroscopy. Eur Biophys J 27, 99–104, doi: 10.1007/s002490050115 (1998). [DOI] [PubMed] [Google Scholar]
- 48.Wissmann R et al. NMR structure and functional characteristics of the hydrophilic N terminus of the potassium channel beta-subunit Kvbeta1.1. J Biol Chem 274, 35521–35525, doi: 10.1074/jbc.274.50.35521 (1999). [DOI] [PubMed] [Google Scholar]
- 49.Mastronarde DN SerialEM: A Program for Automated Tilt Series Acquisition on Tecnai Microscopes Using Prediction of Specimen Position. Microscopy and Microanalysis 9, 1182–1183, doi: 10.1017/S1431927603445911 (2003). [DOI] [Google Scholar]
- 50.Suloway C et al. Automated molecular microscopy: the new Leginon system. Journal of structural biology 151, 41–60, doi: 10.1016/j.jsb.2005.03.010 (2005). [DOI] [PubMed] [Google Scholar]
- 51.Zivanov J et al. RELION-3: new tools for automated high-resolution cryo-EM structure determination. bioRxiv, doi: 10.1101/421123 (2018). [DOI] [PMC free article] [PubMed] [Google Scholar]
- 52.Zivanov J, Nakane T & Scheres SHW A Bayesian approach to beam-induced motion correction in cryo-EM single-particle analysis. IUCrJ 6, 5–17, doi: 10.1107/S205225251801463X (2019). [DOI] [PMC free article] [PubMed] [Google Scholar]
- 53.Punjani A, Rubinstein JL, Fleet DJ & Brubaker MA cryoSPARC: algorithms for rapid unsupervised cryo-EM structure determination. Nat Methods 14, 290–296, doi: 10.1038/nmeth.4169 (2017). [DOI] [PubMed] [Google Scholar]
- 54.Zheng SQ et al. MotionCor2: anisotropic correction of beam-induced motion for improved cryo-electron microscopy. Nat Methods 14, 331–332, doi: 10.1038/nmeth.4193 (2017). [DOI] [PMC free article] [PubMed] [Google Scholar]
- 55.Rohou A & Grigorieff N CTFFIND4: Fast and accurate defocus estimation from electron micrographs. J Struct Biol 192, 216–221, doi: 10.1016/j.jsb.2015.08.008 (2015). [DOI] [PMC free article] [PubMed] [Google Scholar]
- 56.Pettersen EF et al. UCSF Chimera--a visualization system for exploratory research and analysis. J Comput Chem 25, 1605–1612, doi: 10.1002/jcc.20084 (2004). [DOI] [PubMed] [Google Scholar]
- 57.Brown A et al. Tools for macromolecular model building and refinement into electron cryo-microscopy reconstructions. Acta Crystallogr D Biol Crystallogr 71, 136–153, doi: 10.1107/S1399004714021683 (2015). [DOI] [PMC free article] [PubMed] [Google Scholar]
- 58.Emsley P, Lohkamp B, Scott WG & Cowtan K Features and development of Coot. Acta Crystallogr D Biol Crystallogr 66, 486–501, doi: 10.1107/S0907444910007493 (2010). [DOI] [PMC free article] [PubMed] [Google Scholar]
- 59.Afonine PV et al. Real-space refinement in PHENIX for cryo-EM and crystallography. Acta Crystallogr D Struct Biol 74, 531–544, doi: 10.1107/S2059798318006551 (2018). [DOI] [PMC free article] [PubMed] [Google Scholar]
- 60.Barad BA et al. EMRinger: side chain-directed model and map validation for 3D cryo-electron microscopy. Nat Methods 12, 943–946, doi: 10.1038/nmeth.3541 (2015). [DOI] [PMC free article] [PubMed] [Google Scholar]
- 61.Wang RY et al. Automated structure refinement of macromolecular assemblies from cryo-EM maps using Rosetta. Elife 5, doi: 10.7554/eLife.17219 (2016). [DOI] [PMC free article] [PubMed] [Google Scholar]
- 62.The PyMOL Molecular Graphics System (DeLano Scientific, Palo Alto, CA, USA., 2002). [Google Scholar]
- 63.Smart OS, Neduvelil JG, Wang X, Wallace BA & Sansom MS HOLE: a program for the analysis of the pore dimensions of ion channel structural models. J Mol Graph 14, 354–360, 376 (1996). [DOI] [PubMed] [Google Scholar]
- 64.Jones DT Protein secondary structure prediction based on position-specific scoring matrices. J Mol Biol 292, 195–202, doi: 10.1006/jmbi.1999.3091 (1999). [DOI] [PubMed] [Google Scholar]
- 65.Zadek B & Nimigean CM Calcium-dependent gating of MthK, a prokaryotic potassium channel. J Gen Physiol 127, 673–685 (2006). [DOI] [PMC free article] [PubMed] [Google Scholar]
- 66.Posson DJ, McCoy JG & Nimigean CM The voltage-dependent gate in MthK potassium channels is located at the selectivity filter. Nat Struct Mol Biol 20, 159–166, doi:nsmb.2473[pii]10.1038/nsmb.2473 (2013). [DOI] [PMC free article] [PubMed] [Google Scholar]
- 67.Posson DJ, Rusinova R, Andersen OS & Nimigean CM Calcium ions open a selectivity filter gate during activation of the MthK potassium channel. Nat Commun 6, 8342, doi: 10.1038/ncomms9342 (2015). [DOI] [PMC free article] [PubMed] [Google Scholar]
- 68.Posson DJ, Rusinova R, Andersen OS & Nimigean CM Stopped-Flow Fluorometric Ion Flux Assay for Ligand-Gated Ion Channel Studies. Methods Mol Biol 1684, 223–235, doi: 10.1007/978-1-4939-7362-0_17 (2018). [DOI] [PMC free article] [PubMed] [Google Scholar]
- 69.Brooks BR et al. CHARMM: the biomolecular simulation program. Journal of computational chemistry 30, 1545–1614 (2009). [DOI] [PMC free article] [PubMed] [Google Scholar]
- 70.Phillips JC et al. Scalable molecular dynamics with NAMD. Journal of computational chemistry 26, 1781–1802 (2005). [DOI] [PMC free article] [PubMed] [Google Scholar]
- 71.Shaw DE et al. in Proceedings of the international conference for high performance computing, networking, storage and analysis. 41–53 (IEEE Press; ). [Google Scholar]
- 72.Klauda JB et al. Update of the CHARMM all-atom additive force field for lipids: validation on six lipid types. The journal of physical chemistry B 114, 7830–7843 (2010). [DOI] [PMC free article] [PubMed] [Google Scholar]
- 73.MacKerell AD Jr et al. All-atom empirical potential for molecular modeling and dynamics studies of proteins. The journal of physical chemistry B 102, 3586–3616 (1998). [DOI] [PubMed] [Google Scholar]
- 74.MacKerell AD, Feig M & Brooks CL Extending the treatment of backbone energetics in protein force fields: Limitations of gas‐phase quantum mechanics in reproducing protein conformational distributions in molecular dynamics simulations. Journal of computational chemistry 25, 1400–1415 (2004). [DOI] [PubMed] [Google Scholar]
- 75.Noskov SY, Berneche S & Roux B Control of ion selectivity in potassium channels by electrostatic and dynamic properties of carbonyl ligands. Nature 431, 830–834 (2004). [DOI] [PubMed] [Google Scholar]
- 76.Andersen HC Molecular dynamics simulations at constant pressure and/or temperature. The Journal of chemical physics 72, 2384–2393 (1980). [Google Scholar]
- 77.Feller SE, Zhang Y, Pastor RW & Brooks BR Constant pressure molecular dynamics simulation: the Langevin piston method. The Journal of chemical physics 103, 4613–4621 (1995). [Google Scholar]
- 78.Martyna GJ, Tobias DJ & Klein ML Constant pressure molecular dynamics algorithms. The Journal of Chemical Physics 101, 4177–4189 (1994). [Google Scholar]
- 79.Nosé S A unified formulation of the constant temperature molecular dynamics methods. The Journal of chemical physics 81, 511–519 (1984). [Google Scholar]
- 80.Hoover WG Canonical dynamics: equilibrium phase-space distributions. Physical review A 31, 1695 (1985). [DOI] [PubMed] [Google Scholar]
- 81.Andersen HC Rattle: A “velocity” version of the shake algorithm for molecular dynamics calculations. Journal of Computational Physics 52, 24–34, doi: 10.1016/0021-9991(83)90014-1 (1983). [DOI] [Google Scholar]
- 82.Darden T, York D & Pedersen L Particle mesh Ewald: An N-log(N) method for Ewald sums in large systems. J Chem Phys 98, 10089 (1993). [Google Scholar]
Associated Data
This section collects any data citations, data availability statements, or supplementary materials included in this article.