Abstract
We examined the photostability of a double-stranded DNA oligomer, covalently labeled with Cy3 or Cy5 on one strand, in the presence of metallic silver island films. In our experimental configuration a minor fraction of the labeled DNA was close to the silver particles and the remainder was distant from the particles. Proximity of the fluorophores to silver island films resulted in increased intensity. Upon continuous illumination we found a fraction of the emission that was resistant to the photobleaching. The emission spectra of the residual fractions were identical to the initial spectra. The frequency-domain lifetime measurements of this fraction revealed greatly shortened decay times. These results are consistent with the photostable fraction being close to the silver particles. This results suggest that the number of photons detected per fluorophore, prior to photobleaching, can be increased 5-fold or more by proximity to silver particles. Localization at an optimal distance from the silver surface may result in larger enhancements.
Keywords: Metal-enhanced fluorescence, DNA, photostability, Cy3, Cy5, silver islands, colloids
INTRODUCTION
Fluorescent detection is widely used in biotechnology, clinical diagnostics and gene expression [1-4]. In many cases the sensitivity of the measurement is limited by the photostability of the fluorophores. For instance, in single molecule detection it is important to detect as many photons per fluorophore as possible. The most photostable fluorophore typically undergo 105 to 106 excitation-deexcitation events prior to bleaching [5-6]. Given the limited collection efficiency of all optical systems, one can observe a maximum of 103 to 104 photons per fluorophore.
In recent publications we described the effects of silver island films on the spectral properties of several fluorophores [7-9]. Silver island films are silver particles deposited on a glass substrate by chemical reduction of silver ions. These particles form an incomplete coverage of the surface and are typically sub-wavelength in size, hundreds of angstroms. We showed that proximity of fluorophores to silver particles can result in increased quantum yields and decreased lifetimes [7-9], an effect consistent with increased rates of radiative decay near the metallic surfaces. Decreased lifetimes are expected to result in increased photostability because the time for reaction while in the excited state is reduced.
In the present report we examined the photostability of Cy3 and Cy5-labeled DNA near silver island films. These fluorophores are widely used in DNA arrays [10,11]. We found increased emission intensity and increased photostability of Cy3 and Cy5-labeled oligomers near the silver film, suggesting the use of silver particles on DNA array substrates for increased sensitivity.
MATERIALS AND METHODS
DNA Oligomers
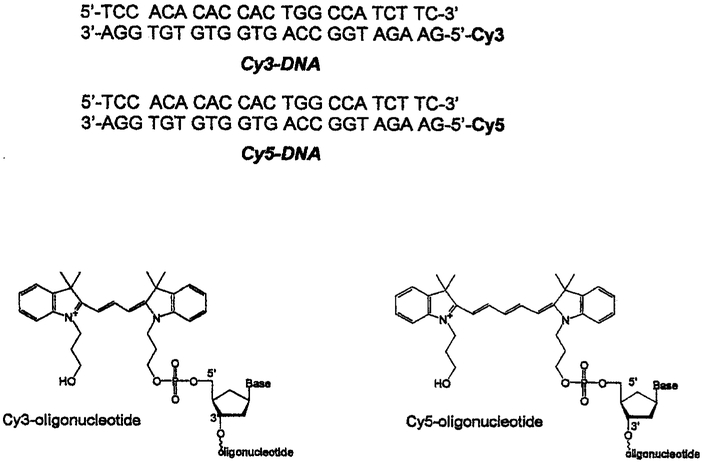
The chemical structures and sequences of the labeled and unlabeled DNA oligomers are shown in Fig. 1. These labeled oligomers were obtained from Synthetic Genetics. San Diego, CA. The labeled oligomers contained N,N′-dispropyl)-tetramethylindocarbocyanine (Cy3) or N,N-(dipropyl)-tetramethylindodicarbocyanine (Cy5) on the 5′ ends. The complementary unlabeled oligonucleotides were obtained from the Biopolymer Core Facility of the University of Maryland School of Medicine.
Fig. 1.
Structures and sequences of the labeled and unlabeled DNA oligomers.
The double-stranded DNA samples (Cy3-DNA or Cy5-DNA) were prepared by mixing the complementary oligonucleotides in 5 mM HEPES, pH 7.5, containing 0.2 M KCl and 0.25 mM EDTA to a final concentration of 20 μM. The samples were then heated to 70°C for 2 min, followed by slow cooling. Concentrations were determined using ε (548 nm) = 150,000 M−1 cm−1 for Cy3 and e (648 nm) = 215,000 M−1 cm−1 for Cy5. The quantum yields were determined using rhodamine B (Q = 0.48) as a reference. The quantum yield of Cy3 and Cy5, in the absence of silver particles were found to be 0.24 and 0.20, respectively.
Silver Island Films
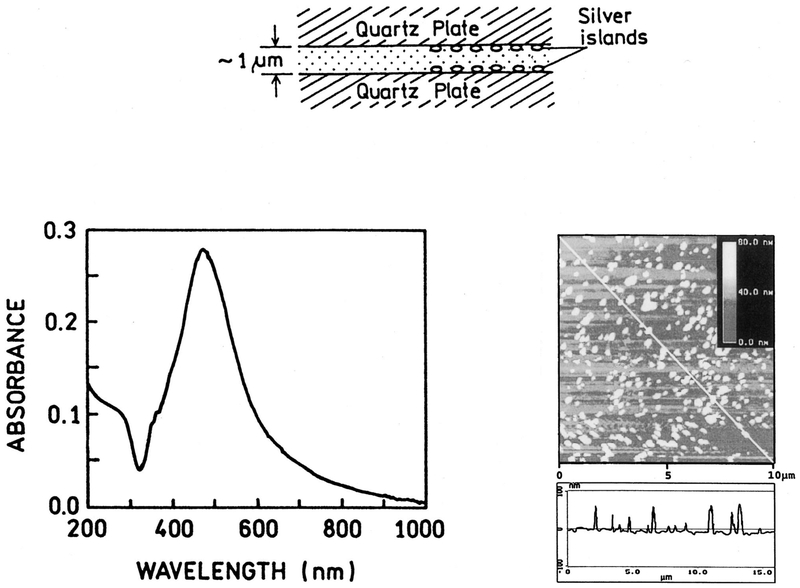
Silver island films were formed on quartz slides (1 cm × 4 cm) as described previously [8,12]. Briefly, the slides are rigorously cleaned. Silver is deposited by reduction of silver nitrate using D-glucose. The particles are typically 100–500 nm across and 70 nm high covering about 20% of the quartz surface. These islands display the typical surface plasmon resonance absorption with a peak near 480 nm.
Fluorescence Measurements
Emission spectra were obtained using a SLM 8000 spectrofluorometer using 514 nm and 605 nm excitation for Cy3 and Cy5, respectively. For the FD measurements of Cy3 the excitation source was a mode-locked argon ion laser, 514 nm, about 76-MHz pulse repetition rate. For Cy5 we used a cavity-dumped R6G dye laser, 605 nm, 3.8-MHz repetition rate. The same laser light sources were used for the steady-state and FD measurements. The FD data were obtained with magic angle polarizer conditions. Emission of Cy3 was observed through a 565 nm interference filter, and Cy5 was observed with a 630 nm long pass filer.
The FD intensity decays were analyzed in terms of the multiexponential model
| (1) |
where αi are the pre-exponential factors and τi the lifetime, using previously described methods [13]. The contribution of each lifetime component to the steady state intensity is given by:
| (2) |
The mean lifetime, representing the average time in the excited state, is given by:
| (3) |
The amplitude-weighted lifetime is given by:
| (4) |
This value represents the time-integrated area under the intensity decay, so this quantity reflects the overall quantum yield. The amplitude-weighted lifetime is sensitive to short timescale components in the intensity decay.
Photostability
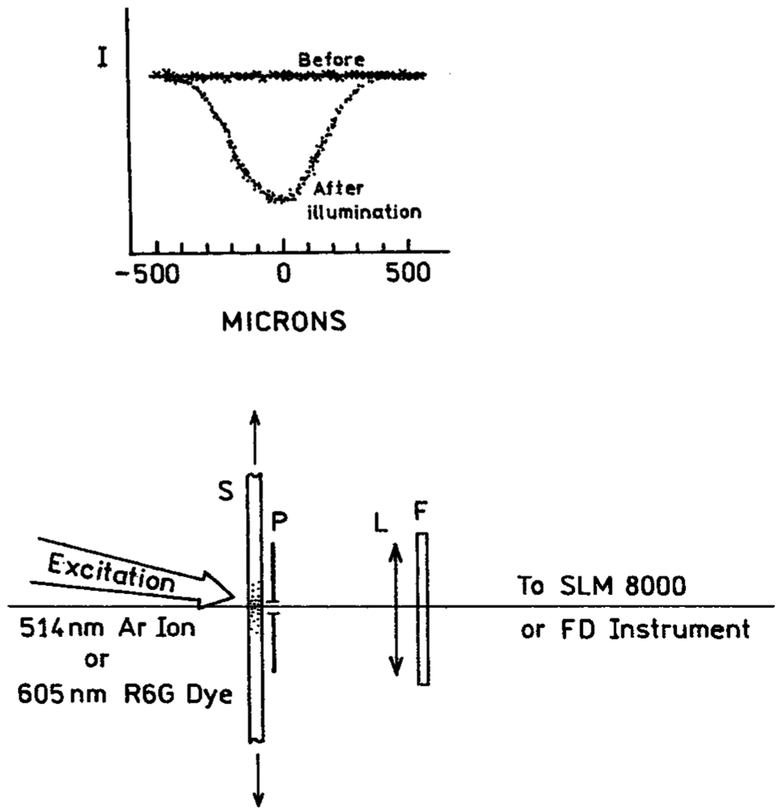
Photostability measurements were accomplished using the configuration shown in Fig. 2. This top section of Fig. 2 shows an intensity profile across the sample (Cy3-DNA on quartz) before and after a illuminated for 400 s with 2 mW at 514 nm, were obtained by translation of a 50-μ pinhole across the sample. The diameter of the illuminated area was about 300 μ. The spatial profiles across sample was measured using low-power illumination (≈0.1 mW) by observation through a 50-μ pinhole. We estimated the photostability of the fluorophores by measuring the integrated area of intensity versus time to 400 seconds for samples between quartz (IQ) or silver islands (IS). In these cases the 50 μ pinhole was placed in the center of the illuminated spot.
Fig. 2.
Experimental configuration for photostability measurements. S = Sample; P = pinhole; L = lens; F = emission filter. The top diagram shows an intensity profile before and after a photostability test measured with low excitation power.
RESULTS
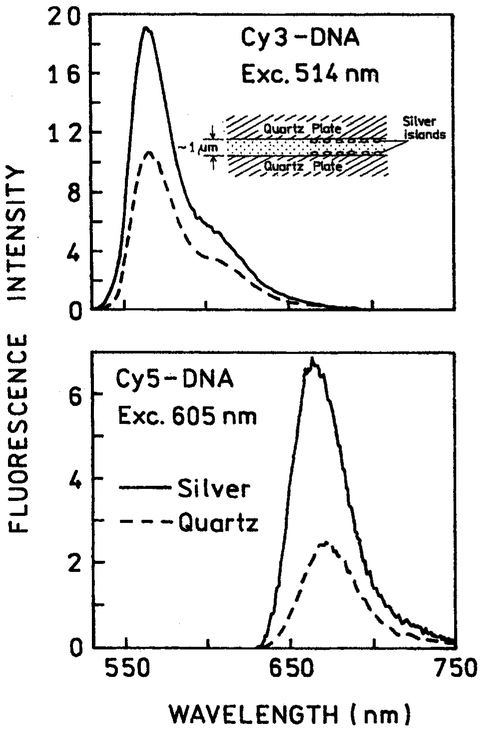
We examined the emission spectral properties of the labeled oligomers using the geometry shown as an insert in Fig. 3. The liquid samples were placed between two unsilvered quartz plates or between two quartz plates coated with silver island films. The thickness of the sample between the plates was about 1 μ. The silver particles are thought to exert only short range interactions over about 200 Å [14-17], which would mean only about 4% of the sample thickness could be affected by the particles. However, our experimental results suggest the active volume to be about 10–20%, suggesting a longer range interaction [8]. In any event, the spectral changes we observed, prior to photobleaching, represent weighted average of molecules affected by the silver particles and unaffected particles more distant from the silver.
Fig. 3.
Emission spectra of Cy3-DNA (top) and Cy5-DNA (bottom) between quart plates without (– – –) and with silver island films (–––). The insert (top) shows the experimental geometry for liquid samples between two silver island films.
Emission spectra of Cy3-DNA and Cy5-DNA are shown in Fig. 3. In both cases the emission intensity is increased 2- to 3-fold between the silver island films as compared between quartz slides. The maximum increase in quantum yield are known to depend on 1/Q, where Q is the unperturbed quantum yield. The slightly larger increase in intensity for Cy5-DNA compared to Cy3-DNA is consistent with this expectation of larger enhancements for low quantum yield fluorophores.
We note that the intensities observed between the silver particles reflect only an apparent quantum yield. This is because the silver particles can both increase the actual quantum yield and increase the rate of excitation by increasing the incident light field intensity near the particles [17]. Our lifetime measurements (below) suggest a subsubstantial if not the majority of the increased intensity seen in Fig. 3 is due to an increase in the actual quantum yield due to an increase in the radiative decay rate.
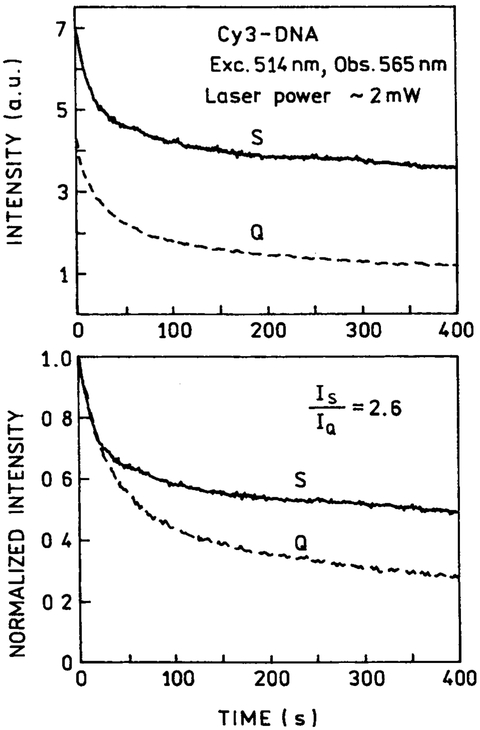
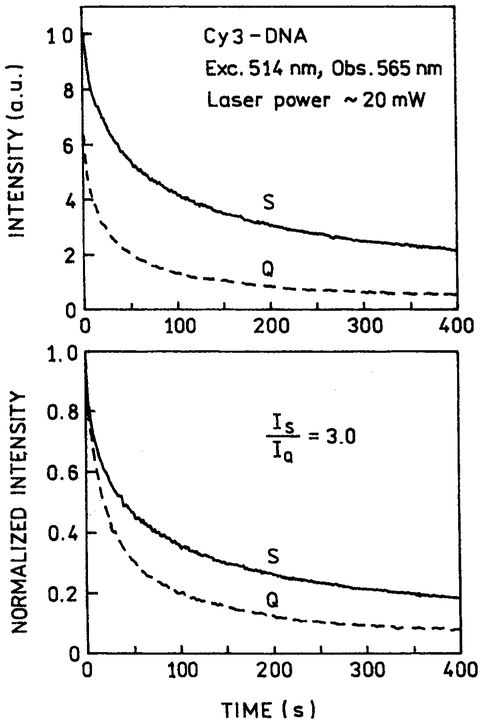
Photostability of the labeled DNA was studied by measuring the emission intensity during continuous illumination at a moderate laser power of 2 mW (Fig. 4) and a higher laser power of 20 mW at 514 nm (Fig. 5). In both cases the intensity initially dropped rapidly, but became more constant at longer illumination times. The extent of photobleaching is greater with 20-mW illumination (Fig. 5) than with 2-mW illumination (Fig. 4). Although not a quantitative result, examination of these curves visually suggests slower photobleaching at longer times in the presence of silver particles compared with quartz slides. The measurable emission prior to photobleaching is proportional to the area under these curves. There is a 2.6–3.0-fold increase in the time-integrated emission (to 400 s) in the presence of silver particles, somewhat larger than the 1.8-fold intensity increase seen for Cy3-DNA in Fig. 3.
Fig. 4.
Photostability of Cy3-DNA between quartz plates without (Q) and with (S) silver island films at a moderate laser power of 2 mW. Top: as measured; bottom; normalized at time = zero.
Fig. 5.
Photostability of Cy3-DNA between quartz plates without (Q) and with (S) silver island film at a higher laser power of 2 mW. Top: as measured; bottom: normalized at time = zero.
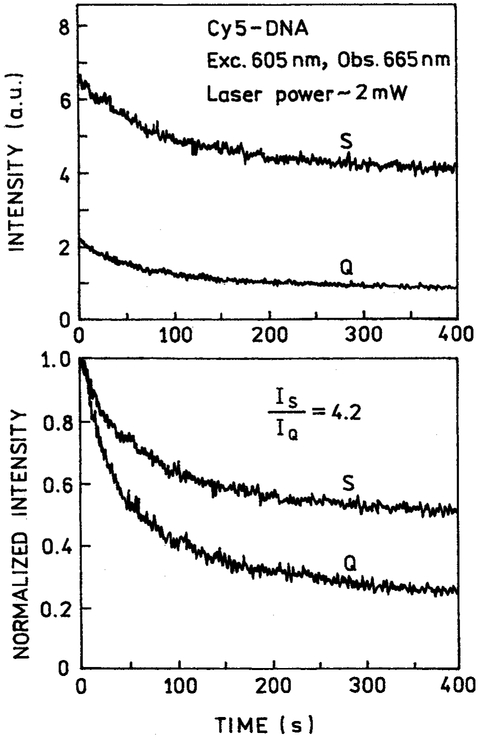
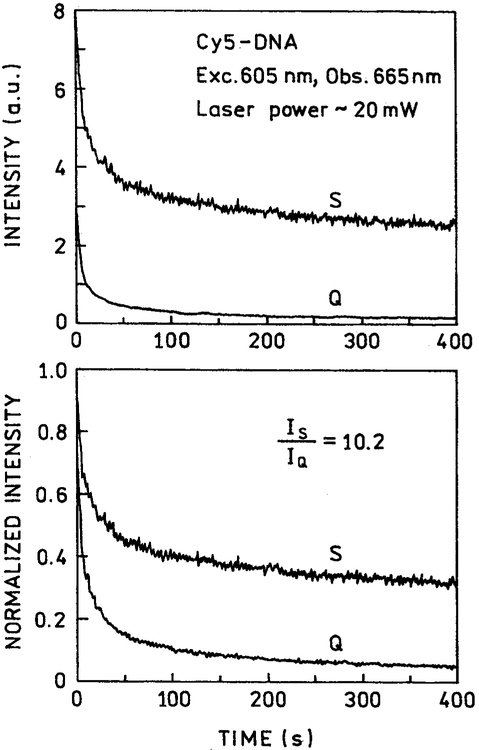
Similar results were seen for Cy5-DNA at 2 mW (Fig. 6) and 20 mW (Fig. 7) for illumination at 605 nm. In this case the difference between the silver and quartz slides was greater for higher-power illumination. The areas under the curves in the presence of silver islands is about 4.2-fold higher for 2-mW illumination and 10.7-fold higher for 20-mW illumination. These ratios are somewhat larger than the 2.8-fold intensity increase seen for Cy5-DNA in Fig. 3.
Fig. 6.
Photostability of Cy5-DNA between quartz plates without (Q) and with (S) silver island films at a moderate laser power of 2 mW. Top: as measured; bottom: normalized at time = zero.
Fig. 7.
Photostability of Cy5-DNA between quartz plates without (Q) and with (S) silver island film at a higher laser power of 20 mW. Top: as measured; bottom: normalized at time = zero.
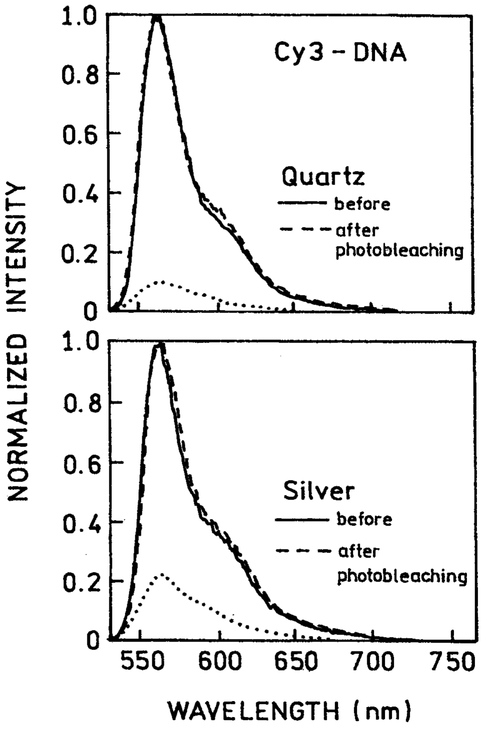
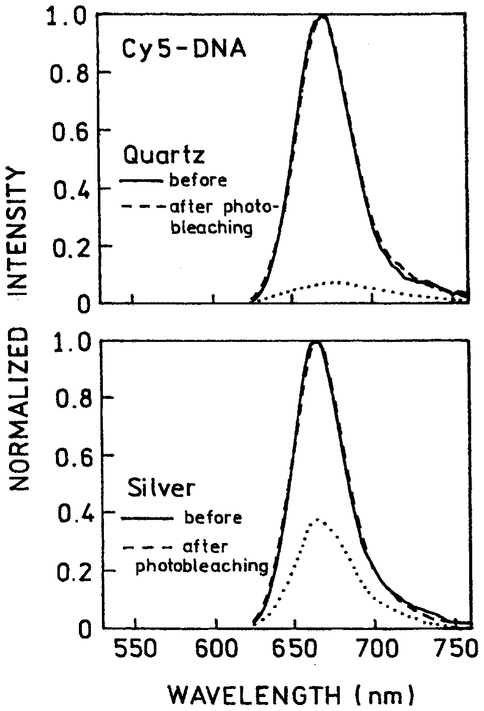
We questioned the nature of the emission remaining after 400 s illumination. The emission spectra of Cy3-DNA (Fig. 8) and Cy5-DNA (Fig. 9) were identical before and after illumination, both in the absence and presence of silver islands. This result indicates that the detected emission, even after intense illumination, is still due to Cy3 and Cy5 and not a photolysis by-product.
Fig. 8.
Normalized emission spectra of Cy3-DNA before and after 400-s illumination, 514 nm, 20 mW. The lower spectra (…..) are not normalized following illumination.
Fig. 9.
Normalized emission spectra of Cy5-DNA before and after 400-s illumination, 605 nm, 20 mW. The lower spectra (…..) are not normalized following illumination.
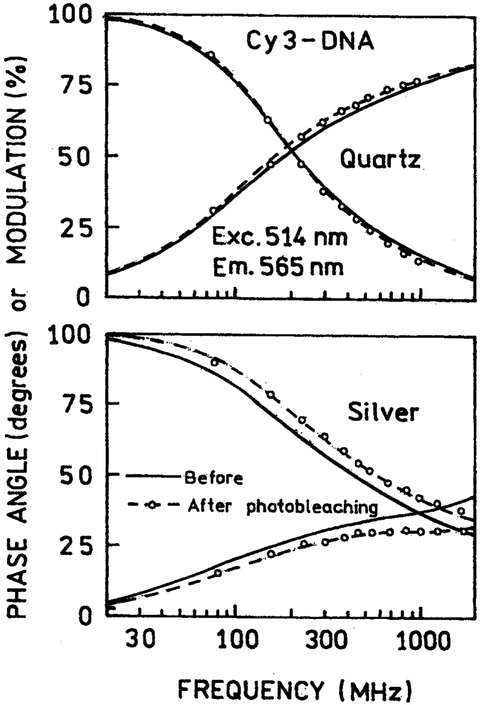
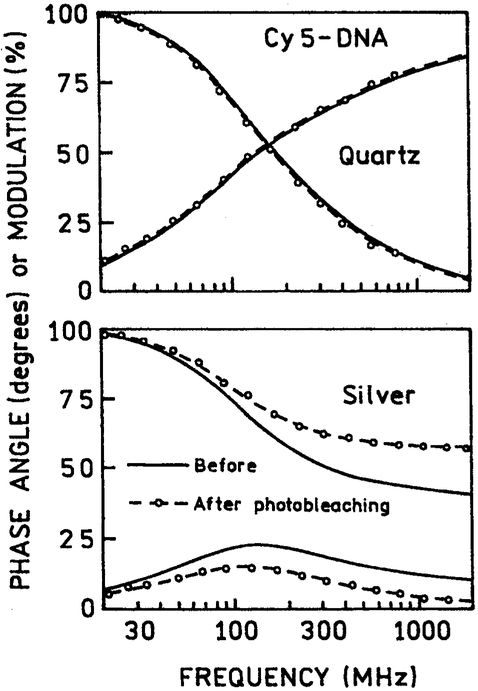
To further investigate the nature of the emission remaining after illumination, we measured the FD intensity decays, before and after illumination. We reasoned the selective photobleaching of labeled DNA distant from the silver particles would result in shorter lifetimes for the remaining populations, which is close to the silver particles. In the absence of silver island films the intensity decays of Cy3-DNA (Fig. 10) and Cy5-DNA (Fig. 11) were essentially identical before and after illumination (top panels), and the mean lifetimes remained the same (Table I). In the presence of silver particles the frequency-response were dramatically altered before illumination, and altered further following illumination (Fig. 10 and 11, lower panels). These changes are due to decay times components, with dramatically shortened decay times because of the silver particles, and increased contribution of these short decay times following photobleaching (Table I).
Fig. 10.
Frequency-domain intensity decays of Cy3-DNA between quartz plates without (top) and with silver island films (bottom), before (——) and after (—— o ——) illumination.
Fig. 11.
Frequency-domain intensity decays of Cy5-DNA between quartz plates without (top) and with silver island films (bottom).
Table I.
Multiexponential Analysis of Cy3-DNA and Cy5-DNA Intensity Decays
| Compound/Conditions | τ (ns) | 〈τ〉 (ns) | α1 (f1) | τ1 (ns) | α2 (f2) | τ2 (ns) | α3 (f3) | τ3 (ns) | |
|---|---|---|---|---|---|---|---|---|---|
| Cy3-DNA, quartz before photobleaching | 1.21a) | 0.90b) | 0.433 (0.138) | 0.29 | 0.567 (0.862) | 1.36 | – | – | 1.7 |
| After photobleaching | 1.25 | 1.03 | 0.272 (0.064) | 0.26 | 0.728 (0.933) | 1.32 | – | – | 1.9 |
| Cy3-DNA, silver before photobleaching | 0.78 | 0.141 | 0.860 (0.285) | 0.047 | 0.103 (0.306) | 0.42 | 0.037 (0.409) | 1.57 | 2.0 |
| After photobleaching | 0.62 | 0.063 | 0.906 (0.316) | 0.030 | 0.066 (0.265) | 0.34 | 0.028 (0.419) | 1.25 | 2.5 |
| Cy5-DNA, quartz before photobleaching | 1.53 | 1.20 | 0.382 (0.127) | 0.40 | 0618 (0.873) | 1.69 | – | – | 2.5 |
| After photobleaching | 1.50 | 1.19 | 0.354 (0.110) | 0.37 | 0.646 (0.890) | 1.64 | – | – | 2.4 |
| Cy5-DNA, silver before photobleaching | 0.99 | 0.016 | 0.989 (0.390) | 0.006 | 0.006 (0.064) | 0.17 | 0.05 (0.546) | 1.79 | 1.1 |
| After photobleaching | 0.76 | 0.002 | 0.9995 (0.575) | 0.001 | 0.0001 (0.024) | 0.34 | 0.004 (0.401) | 1.88 | 1.3 |
,
DISCUSSION
What are the origins of the spectral changes of Cy3-DNA and Cy5-DNA seen in the presence of silver particles and following illumination? We interpret the reduced lifetimes in the presence of silver particles as resulting from an increased radiative decay rate of the fluorophores. This can be seen from the definitions of the quantum yield Q0 and lifetime τ0 in the absence of silver:
| (5) |
| (6) |
In these expressions Γ and knr are the radiative and non-radiative decay rates, respectively. Assume proximity of the fluorophore to the metal particles results in a n-fold increase in the radiative decay rate. In this case the quantum yield Qm and the lifetime (τm) near the metal particle are given by:
| (7) |
| (8) |
A n-fold increase in Γ results in the unusual effect of an increasing quantum yield with a decreased lifetime, which was observed for both Cy3-DNA and Cy5-DNA.
In the presence of silver particles the lifetimes are not only shortened, but the intensity decays become strongly multiexponential. This heterogeneity is due to short lifetime components, which contribute large fraction of the total emission (Table I). We believe these short lifetime components are due to those fluorophores in close proximity to the silver particles, and which display increased intensities and decreased lifetimes.
In the absence of silver particles, continuous illumination did not alter the lifetimes or the heterogeneity of the intensity decays. We interpret this result as due to spatially constant photobleaching across the micron thickness of the sample. In the presence of silver particles the contribution of the short lifetimes increase and the mean lifetimes decrease after illumination. We believe this result is due to the reduced lifetime and increased photostability of Cy3-DNA and Cy5-DNA, which are close to the particles. Upon illumination the emission becomes increasingly dominated by fluorophores in close proximity to the silver particles and these fluorophores display higher quantum yields and decreased lifetimes (Eq. (7) and (8)).
We were surprised that the emission intensity appeared to approach constant values during prolonged illumination, rather than decreasing to zero. We believe this is due to diffusion of unbleached fluorophores into the illuminated area during the 400-s illumination. The diffusion distance (Δx) over a period of t is given by
| (9) |
where D is the diffusion coefficient. Assuming a reasonable value for D of 10−6 cm2/sec, which in 400 s a labeled DNA molecules can diffuse 280 μ. This distance is roughly comparable to the diameter of the illuminated area so that this area will be replenished with unbleached fluorophores on a timescale comparable to the illumination time. This consideration explains the similar rate of intensity decrease seen for all the samples, with or without silver particles (see Fig. 4-7). The initial rapidly decreasing intensity is due to bleaching of fluorophores distant from the silver islands, and these all bleach at the same rate. The totality of the data, while somewhat quantitative, supports our assertion that continuous illumination results in a relative enrichment for fluorophores in close proximity to the particles.
What is the magnitude of the intensity increase that can be expected for fluorophores at the optimal distance from the silver surface? Assume that the short decay time components found in the presence of silver particles are due to these ideally positioned fluorophores. The short decay times range from 1 to 47 ps. Using a typical value of 20 ps suggests that the photostability of these fluorophores will be increased 20-fold, so that more photons could be detected per fluorophore prior to photobleaching. Alternatively, the maximal emission rate of a fluorophore is roughly given by 1/τ [5-6], so that all photon detection rate per fluorophore could increase 20-fold.
Our results suggest the use of silver particles for increased detection sensitivity for DNA sequencing flow cytometry, or microarrays, which typically use high-intensity focused excitation of fluorophores. Gels or substances containing silver particles may also be useful in proteomics [18], in which Cy3 and Cy5 have been used for detection of proteins in 2D gels [19].
Scheme 1.
Sample with silver island film absorption of silver island film (left) AFM image of silver island film (right).
ACKNOWLEDGMENTS
This work was supported by the NIH National Center for Research Resource, RR-08119. The authors thank Dr. Badri Maliwal for design of the DNA oligomers.
ABBREVIATIONS:
- Cy3
N,N′-(dipropyl)-tetramethylindocarbocyanine
- Cy5
N,N′-(dipropyl)-tetramethylindodicarbocyanine
- FD
frequency-domain
REFERENCES
- 1.Yershov G, Barsky V, Belgovskiy A, Kirillov E, Kreindlin E, Ivanov I, Parinov S, Guschin D, Drobishev A, Dubiley S, and Mirzabekov A (1996) DNA analysis and diagnostics on oligonucleotide microchips, Proc. Natl. Acad. Sci 93, 4913–4918. [DOI] [PMC free article] [PubMed] [Google Scholar]
- 2.Thompson RB (Ed.) (1997) Advances in Fluorescence Sensing Technology III, SPIE Proc., 2980, 1–582. [Google Scholar]
- 3.Brown PO and Botstein D (1999) Exploring the new world of the genome with DNA microarrays, Nature Genet. Suppl 21, 33–37. [DOI] [PubMed] [Google Scholar]
- 4.Schena M, Heller RA, Theriault TP, Konrad K, Lachenmeier E, and Davis RW (1998) Microarrays: Biotechnology’s discovery platform for functional genomics, TIB Tech. 16, 301–306. [DOI] [PubMed] [Google Scholar]
- 5.Soper SA, Nutter HL, Keller RA, Davis LM, and Shera EB (1993) The photophysical constants of several fluorescent dyes pertaining to ultrasensitive fluorescence spectroscopy, Photochem. Photobiol 57, 972–977. [Google Scholar]
- 6.Ambrose WP, Goodwin PM, Jett JH, Van Orden A, Werner JH, and Keller RA (1999) Single molecule fluorescence spectroscopy at ambient temperature, Chem. Rev 99, 2929–2956. [DOI] [PubMed] [Google Scholar]
- 7.Lakowicz JR (2001) Radiative decay engineering: Biophysical and biomedical applications, Anal. Biochem 298, 1–24. [DOI] [PMC free article] [PubMed] [Google Scholar]
- 8.Lakowicz JR, Shen Y, D’Auria S, Malicka J, Fang J, Gryczynski Z, and Gryczynski I (2002) Radiative decay engineering, Anal. Biochem 301, 261–277. [DOI] [PMC free article] [PubMed] [Google Scholar]
- 9.Lakowicz JR, Shen B, Gryczynski Z, D’Auria S, and Gryczynski I (2001) Intrinsic fluorescence from DNA can be enhanced by metallic particles, Biochem. Biophys. Res. Commun 286, 875–879. [DOI] [PMC free article] [PubMed] [Google Scholar]
- 10.Schena M, Heller RA, Theriault TP, Konrad K, Lachenmeier E, and Davis RW (1998) Microarrays: biotechnology’s discovery platform for functional genomics, Tibtech 16, 301–306. [DOI] [PubMed] [Google Scholar]
- 11.Harrington CA, Rosenow C, and Retief J (2000) Monitoring gene expression using DNA microarrays, Curr. Opin. Microbiol 3, 285–291. [DOI] [PubMed] [Google Scholar]
- 12.Ni F and Cotton TM (1986) Chemical procedure for preparing surface enhanced Raman scattering active silver films, Anal. Chem 58, 3159–3163. [DOI] [PubMed] [Google Scholar]
- 13.Lakowicz JR, Laczko G, Cherek H, Gratton E, and Limkeman M (1994) Analysis of fluorescence decay kinetics from variable-frequency phase shift and modulation data, Biophys. J 46,463–477. [DOI] [PMC free article] [PubMed] [Google Scholar]
- 14.Weitz DA and Garoff S (1983) The enhancement of Raman scattering, resonance Raman scattering, and fluorescence from molecules adsorbed on a rough silver surface, J. Chem. Phys 78, 5324–5338. [Google Scholar]
- 15.Kümmerlen J, Leitner A, Brunner H, Aussenegg FR, and Wokaun A, (1993) Enhanced dye fluorescence over silver island films: analysis of the distance dependence, Molec. Phys 80, 1031–1046. [Google Scholar]
- 16.Gersten J and Nitzan A (1981) Spectroscopic properties of molecules interacting with small dielectric particles, J. Chem. Phys 75, 1139–1152. [Google Scholar]
- 17.Metiu H (1984) Surface enhanced spectroscopy, Prog. Surface Sci 17, 153–320. [Google Scholar]
- 18.Mayer C, Stich N, Schalkhammer T, and Bauer G (2001) Slide-format proteomic biochips based on surface-enhanced nanocluster-resonance, J. Anal. Chem 371, 238–245. [DOI] [PubMed] [Google Scholar]
- 19.Patton WF and Beechem JM (2001) Rainbow’s end: the quest for multiplexed fluorescence analysis in proteomics, Curr. Opin. Chem. Biol 6, 63–69. [DOI] [PubMed] [Google Scholar]


