Abstract
Background
Colon adenocarcinoma (COAD) is the most common colon cancer exhibiting high mortality. Due to their association with cancer progression, long noncoding RNAs (lncRNAs) are now being used as prognostic biomarkers. In the present study, we used relevant clinical information and expression profiles of lncRNAs originating from The Cancer Genome Atlas database, aiming to construct a prognostic lncRNA signature to estimate the prognosis of patients.
Methods
The samples were randomly spilt into training and validation cohorts. In the training cohort, prognosis-related lncRNAs were selected from differentially expressed lncRNAs using the univariate Cox analysis. Furthermore, the least absolute shrinkage and selection operator (LASSO) regression and multivariate Cox analysis were employed for identifying prognostic lncRNAs. The prognostic signature was constructed by these lncRNAs.
Results
The prognostic model was able to calculate each COAD patient’s risk score and split the patients into groups of low and high risks. Compared to the low-risk group, the high-risk group had significant poor prognosis. Next, the prognostic signature was validated in the validation, as well as all cohorts. The receiver operating characteristic (ROC) curve and c-index were determined in all cohorts. Moreover, these prognostic lncRNA signatures were combined with clinicopathological risk factors to construct a nomogram for predicting the prognosis of COAD in the clinic. Finally, seven lncRNAs (CTC-273B12.10, AC009404.2, AC073283.7, RP11-167H9.4, AC007879.7, RP4-816N1.7, and RP11-400N13.2) were identified and validated by different cohorts. The Kyoto Encyclopedia of Genes and Genomes analysis of the mRNAs co-expressed with the seven prognostic lncRNAs suggested four significantly upregulated pathways, which were AGE-RAGE, focal adhesion, ECM-receptor interaction, and PI3K/Akt signaling pathways.
Conclusion
Thus, our study verified that the seven lncRNAs mentioned can be used as biomarkers to predict the prognosis of COAD patients and design personalized treatments.
Keywords: Long noncoding RNA, Prognosis, Nomogram, The Cancer Genome Atlas, Colon carcinoma
Introduction
Colon cancer refers to a frequently occurring gastrointestinal malignant tumor, and it remains the third most common cause of cancer mortalities (Siegel et al., 2017). It is estimated that each year, 693,900 deaths and 1.4 million newly diagnosed cases of colon cancer are reported (Torre et al., 2016). The commonest type of colon cancer is colon adenocarcinoma (COAD), accounting for 98% of newly diagnosed cases. The main treatment for COAD is surgical resection accompanied with chemotherapy. The biggest limitation of adjuvant chemotherapy is that drugs are absorbed in the upper gastrointestinal tract before entering the colon; therefore, the delivery of colon-targeted drugs is the emphasis of COAD treatment studies (Banerjee et al., 2017). Despite the considerable advancement of COAD treatment and diagnosis, the prognosis of distant metastasis patients is still poor (Lee et al., 2014). At present, the gold standard for estimation of the risk of cancer metastasis and recurrence is the clinicopathological stage. However, many patients with the same stage can have different clinical results, suggesting that the conventional assessment method of colon cancer prognosis is unable to predict it precisely. Therefore, to improve the accuracy of diagnosis and provide directions for personalized treatment of COAD, it is crucial to discover novel prognostic biomarkers and more precise methods that can differentiate between patients with low and high risks of poor prognosis.
Long non-coding RNA (lncRNA), covering over 200 nucleotides, is a subclass of noncoding RNAs, widely distributed in the genome and is able to regulate the expression of genes (Quinn & Chang, 2016). Previous studies have demonstrated that lncRNAs participate in diverse cellular biological functions (e.g., changing chromosome conformation, imprinting genomic loci, and modulating post-transcription) (Ponting, Oliver & Reik, 2009). Although the major function of lncRNAs have not been completely understood, there are accumulating evidence that lncRNAs play a significant role in human carcinogenesis by influencing pathways related to oncogenes and tumor suppressors (Hibi et al., 1996; Ji et al., 2003). The abnormal expression of lncRNAs can alter these biological processes to enhance neoplasm. The altered expression of lncRNAs can reflect the degree of the cancer process, and are regarded as indicators of patient prognosis (Mercer, Dinger & Mattick, 2009). Previous studies have revealed that lncRNAs can be potential biomarkers for prognosis of COAD (Huang et al., 2019). However, most of them explored a limited number of cases without validation groups to test whether the outcome is universally suitable.
Here, from The Cancer Genome Atlas (TCGA), a project containing numerous samples of gene information for 33 cancers, the lncRNA expression profiles of COAD patients were acquired to perform a comprehensively global analysis of prognostic lncRNAs. We detected a 7-lncRNA prognostic signature in COAD and combined it with the traditional clinicopathological risk factors of the disease to form a predictive nomogram. The predictive nomogram is conducive for predicting the prognosis of COAD and guiding clinical treatment.
Materials & Methods
Patient cohort and RNA-Seq data
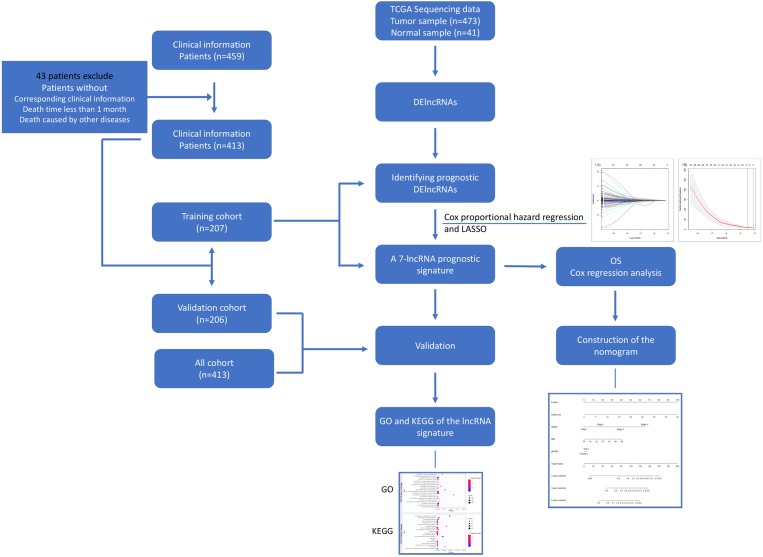
From the official website of TCGA (https://cancergenome.nih.gov/), we obtained the RNA-Seq (level 3, HTSeq-FPKM) data along with the relevant clinical information of 473 COAD patients. Approval from the ethics committee was not required, since the clinical and RNA-Seq expression data were obtained from TCGA. Furthermore, the quality of the clinical data was assessed, and some patients were not included in our studies for the following reasons: (a) their clinical prognostic information was not available; (b) some patients died in the first month after diagnosis; and (c) some deaths were caused by other diseases and accidents. Patients with complete clinical information were randomly split into training and validation cohorts using the R package tool called “caret”. The χ2 test and unpaired two-tailed Student’s t-test were performed to detect significant differences in clinical characteristics between training and validation cohorts. A flowchart of this study is shown in Fig. 1.
Figure 1. Flowchart for identifying a prognostic lncRNAs of COAD.
RNA-Seq data and relevant clinical information for COAD patients were download from the TCGA database. We identified DElncRNAs and further identified and validated a 7-lncRNA prognostic signature. Then a nomogram was built as a prognostic model for COAD. The GO and KEGG were used for the exploration of coexpressed mRNAs’ function. lncRNA, long noncoding RNA; DElncRNAs, differentially expressed lncRNA; OS, overall survival; LASSO, least absolute shrinkage and selection operator; TCGA, The Cancer Genome Atlas; COAD, colon adenocarcinoma.
Identification of differentially expressed long noncoding RNA between adjacent non-tumor tissue and COAD tissue
The Fragments Per Kilobase of transcript per Million Fragments (FPKM) value of lncRNAs was transformed to transcripts per million (TPM) value. If multiple probes represent the identical lncRNA, the average number of these probes was considered the expression number. The “Limma” package in R and the Wilcoxon signed-rank test were used for identifying the differentially expressed lncRNAs (DElncRNAs). The thresholds for screening DElncRNAs were set at |log2(foldchange)| > 1 and false discovery rate (FDR) adjust p < 0.05. Next, the volcano plots of DElncRNAs were constructed.
Construction of prognostic signature in the training cohort
The univariate Cox model was used for assessing the prognostic implication of DElncRNAs, and DElncRNAs with p values less than 0.05 in the training cohort were defined as prognosis-related factors. The lncRNAs from previous screenings were further filtered for crucial lncRNAs using the least absolute shrinkage and selection operator (LASSO) regression method. LASSO is a type of compression estimate. Using LASSO and a penalty proportional to the regression coefficient’s contraction, lncRNAs participating in the prognosis of COAD patients were selected. The R package “glmnet” was used to conduct the LASSO cox analysis to detect crucial lncRNAs. Furthermore, we used multivariate Cox analysis to reduce the dimensionality of these data for further selection. Finally, we constructed a prognostic signature of COAD and calculated the risk score of each patient. According to the risk scores, and with the use of the corresponding median risk score as the cutoff value, COAD patients were split into low-risk and high-risk groups. For the assessment of the survival differences between low-risk and high-risk groups, we used Kaplan–Meier curves and log-rank test.
Validation of signatures in the validation, as well as all cohorts
Similarly, the model coefficients were used to calculate the risk scores in the validation, as well as all cohorts. Kaplan–Meier and log-rank tests were used to compare high- and low-risk patients. The prediction accuracy of the lncRNA signature was estimated based on the receiver operating characteristic (ROC) curves and c-index using the R package “survivalROC”.
Generation of the nomogram
A prognostic nomogram was generated according to the prognostic lncRNAs and traditional risk factors related to clinicopathology. It was an applicable model to predict the survival probability of patients in clinics. The “rms” package of R was used to generate the nomogram.
Functional annotation
To identify the related mRNAs and elucidate the probable biological functions of the seven prognostic lncRNAs, as well as for the assessment of the relevance between the seven prognostic lncRNAs and mRNAs, the calculated Pearson correlation coefficient (PCC) was employed. The PCC value of mRNA was |r| > 0.3, p ≤ 0.05. The enrichment analyses, including Gene Ontology (GO) and Kyoto Encyclopedia of Genes and Genomes (KEGG) (Ogata et al., 1999) pathway analyses were performed using the R package “clusterprofiler”. Statistical significance was set at p <0.05.
Results
Patient characteristics
We obtained RNA-Seq data of 41 adjacent normal tissue samples and 473 COAD samples from TCGA. After screening the eligibility of the clinical data, there were 413 COAD patients (all cohort) with relevant prognostic information and RNA-Seq data. All cohorts were randomly assigned to the training (207 patients) or validation cohort (206 patients). The χ2 test and unpaired two-tailed Student’s t-test showed that there was no significant difference between the validation and training cohorts. We have summarized the clinical features of all the cohorts separately in Table 1.
Table 1. The main clinic characteristics of the 413 COAD patients.
| Characteristic | All cohort number (n = 413) | Training number (n = 207) | Validation number (n = 206) | P value | |
|---|---|---|---|---|---|
| Age | ≧60 | 295 | 155 | 140 | 0.12 |
| <60 | 118 | 52 | 66 | ||
| Gender | Male | 192 | 92 | 100 | 0.404 |
| Female | 221 | 115 | 106 | ||
| Pathologic stage | Stage I/II | 230 | 117 | 113 | 0.687 |
| Stage III/IV | 172 | 84 | 88 | ||
| Unknow | 11 | 6 | 5 | ||
| T classification | T1 + T2 | 83 | 40 | 43 | 0.694 |
| T3 + T4 | 330 | 167 | 163 | ||
| N classification | N0 | 245 | 124 | 121 | 0.809 |
| N1 + N2 | 168 | 83 | 85 | ||
| M classification | M0 | 307 | 160 | 147 | 0.103 |
| M1 | 57 | 23 | 34 | ||
| MX | 44 | 23 | 21 | ||
| Unknown | 5 | 1 | 4 | ||
| Venous invasion | No | 270 | 137 | 133 | 0.623 |
| Yes | 88 | 42 | 46 | ||
| NA | 55 | 28 | 27 | ||
| Lymphatic invasion | No | 229 | 117 | 112 | 0.641 |
| Yes | 144 | 70 | 74 | ||
| NA | 40 | 20 | 20 | ||
| New event | No | 327 | 169 | 158 | 0.216 |
| Yes | 86 | 38 | 48 | ||
| Survival status | Alive | 328 | 163 | 165 | 0.734 |
| Dead | 85 | 44 | 41 | ||
| New event time | 788.87 ± 699.96 | 797.91 ± 691.95 | 779.78 ± 709.50 | 0.721 | |
| Survival time | 879.14 ± 737.59 | 876.01 ± 731.45 | 882.29 ± 762.82 | 0.383 |
Notes.
p value refers to the χ2 test except new event time and survival time. p value of new event time and survival time refers to the unpaired two-tailed Student’s t-test.
Abbreviations
- COAD
- colon adenocarcinoma
- T
- tumor size
- N
- lymph node status
- M
- metastasis
DElncRNAs between adjacent non-tumor tissue and COAD
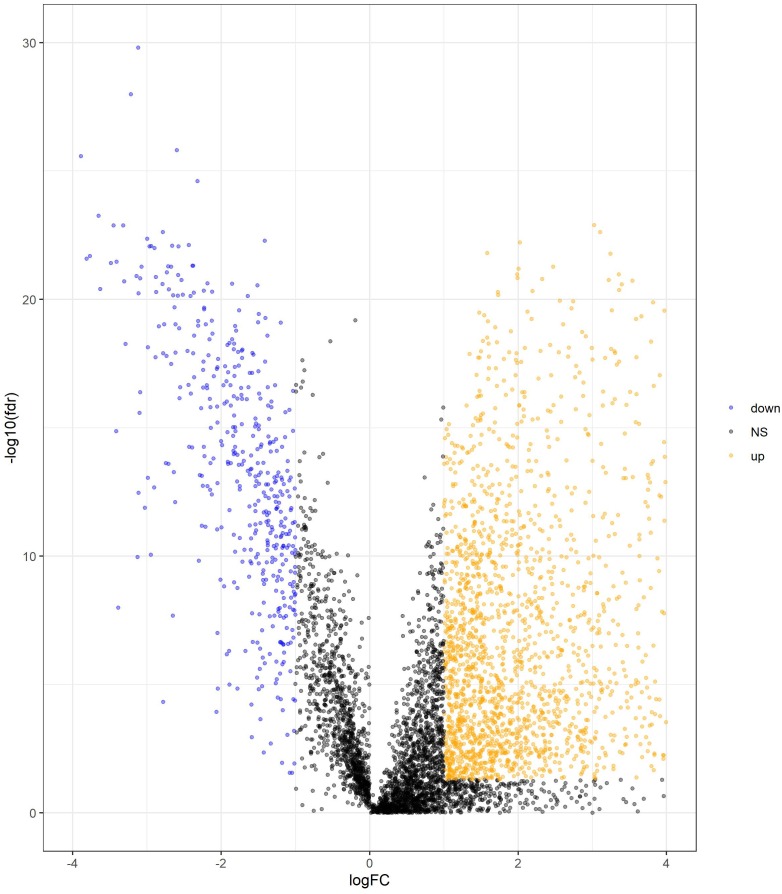
We determined DElncRNAs based on their log 2(fold change) (log2FC) and p values. If —log2FC—>1 and FDR adjust p < 0.05, these lncRNAs were differentially expressed in COAD and adjacent non-tumor tissues (If log2FC>1 and FDR adjust p < 0.05, these DElncRNAs were over-expressed in COAD. If log2FC<−1 and FDR adjust p < 0.05, these DElncRNAs were under-expressed in COAD.). A total of 2417 DElncRNAs (1964 upregulated and 453 downregulated) were identified between normal tissue and COAD (Table S1). The volcano plots of DElncRNAs are shown in Fig. 2.
Figure 2. Volcano plot of DElncRNAs between adjacent normal tissue samples and COAD samples.
The yellow dot shows the risen expression, and the blue dot the declined expression. The thresholds for screening DElncRNAs were set at |log2(foldchange)| > 1 and false discovery rate (FDR) adjust p < 0.05. DElncRNAs, differentially expressed long noncoding RNA; COAD, colon adenocarcinoma.
Construction of a 7-lncRNA prognostic signature in the training cohort
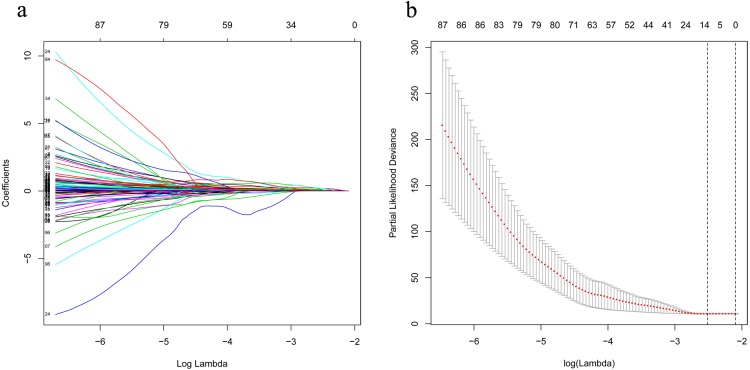
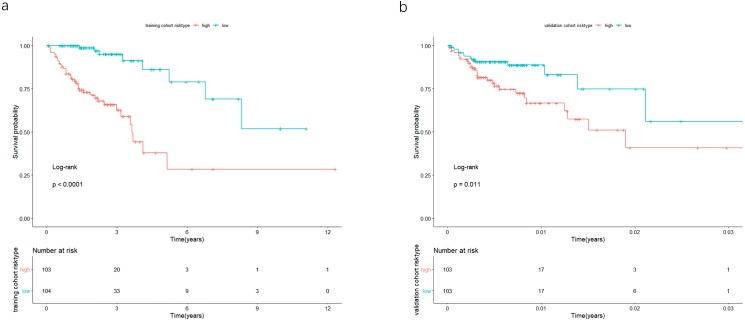
The univariate Cox analysis in the training cohort identified 233 prognostic lncRNAs (P < 0.05) from DElncRNAs (Table S2). Next, LASSO Cox method further identified 13 significant lncRNAs (Fig. 3). We used multivariate Cox analysis to further reduce the dimensionality of the data. Finally, we found that seven lncRNAs (CTC-273B12.10, AC009404.2, AC073283.7, RP11-167H9.4, AC007879.7, RP4-816N1.7, and RP11-400N13.2) were positively correlated with overall survival (OS) and constructed a survival prediction signature. In the multivariate Cox analysis, seven lncRNAs were weighted by regression coefficients to establish the following linear prediction model: . Patients of the low-risk group had significantly longer median of OS than those in the high-risk group. Log-rank test’s p value was less than 0.0001 (Fig. 4A).
Figure 3. LASSO analysis identified 13 genes which are correlated to overall survival in training set.
(A) Ten-time cross-validation for tuning parameter lncRNAs. (B) LASSO coefficient profiles of 233 lncRNAs. LASSO, least absolute shrinkage and selection operator; lncRNAs, long noncoding RNA.
Figure 4. In the training and validation cohort, the patients were split in groups of high and low-risk.
Survival analysis was conducted by Kaplan-Meier analysis and log-rank test. Low-risk group exhibited better prognosis than high-expression group.
Validation of the 7-lncRNA prognostic signature in the validation cohort
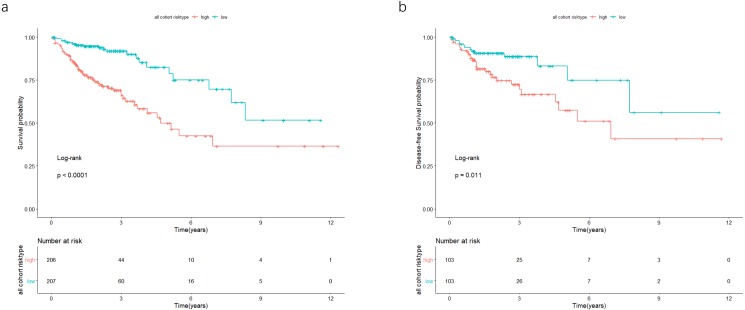
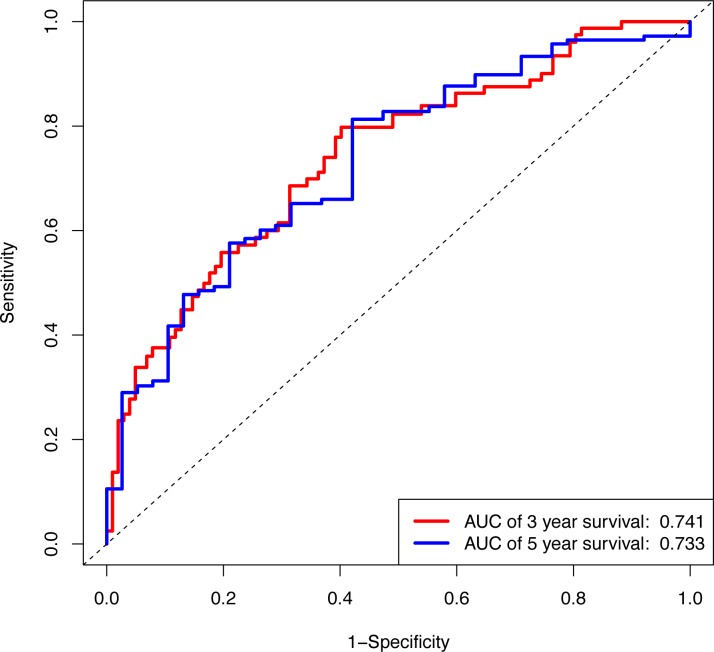
In the validation cohort, there were 206 COAD patients. Using the same signature and cutoff value of the training cohort to calculate risk scores, the validation cohort was also classified into groups of low- and high-risk, and the low-risk groups showed better prognosis than the high-risk groups, as shown in Fig. 4B (p = 0.011). Furthermore, we validated our 7-lncRNA prognostic signature in all cohorts (training and validation cohorts) using previous methods and standards. The results showed that the low-risk group exhibited a better prognosis than the high-risk group (P < 0.0001), further proving the reliability of the prognostic signature (Fig. 5A). Additionally, the disease-free survival curve analysis was performed in all cohorts, and it suggested that the high-risk group to be inclined to recurrence (p = 0.00063) (Fig. 5B). In addition, the area under the ROC curve (AUC) assessed the predictive effect of the signature. The AUC of the prognostic signature was 0.741 for 3-year survival and that for the 5-year survival was 0.733 (Fig. 6). The c-index value was 0.726. Our results indicated the high sensitivity and specificity of the prognostic signature.
Figure 5. In the all cohort, the patients were split in groups of low and high risk.
Using Kaplan-Meier analysis and log-rank test performed survival analysis (A) and disease-free survival analysis (B). Low-risk group exhibited better survival and disease-free survival results.
Figure 6. The ROC curve of the prognostic signature for 3-year and 5-year OS probability in all cohort.
ROC, receiver operating characteristic; OS, overall survival.
Formation and assessment of the nomogram
Using multivariate and univariate Cox analysis, we determined that the 7-lncRNA signature was an individual predictor of COAD patients. In the univariate results, risk score, tumor size, lymph node status, metastasis, stage, venous invasion, and lymphatic invasion were significantly associated with prognosis (Table 2). To further examine whether the 7-lncRNA signature was not associated with previous clinical factors, we performed multivariate Cox regression analysis. The results indicated that risk score and metastasis were the individual prognostic indicators of COAD (Table 2). Furthermore, a prognostic nomogram was constructed based on the previous prognostic factors (Fig. 7).
Table 2. A multivariate analysis of survival with clinic factors and the 7-lncRNA signature.
| Variables | Univariate analysis | Multivariate analysis | ||
|---|---|---|---|---|
| HR (95%CI) | P value | HR (95%CI) | P value | |
| Age (>60 vs ≤60) | 1.372 (0.843–2.233) | 0.20284069 | ||
| Gender (male vs female) | 1.198 (0.779–1.843) | 0.41154492 | ||
| Pathologic stage (stage I/II vs stage III/IV) | 3.486 (2.171–5.599) | 2.39E−07* | 3.859 (0.933–15.972) | 0.06237977 |
| LncRNA model scores (high score vs low score) | 3.494 (2.148–5.683) | 4.67E−07* | 2.363 (1.306–4.275) | 0.0044734* |
| T classification (T1/T2 vs T3/T4) | 3.458 (1.397–8.559) | 0.00730575* | 2.827 (0.654–12.218) | 0.16407723 |
| N classification (N0 vs N1/N2) | 3.042 (1.948–4.748) | 9.87E−07* | 0.470 (0.130–1.695) | 0.24873161 |
| M classification (M0 vs M1 vs MX) | 5.383 (3.328–8.707) | 6.82E−12* | 2.190 (1.147–4.182) | 0.01752146* |
| Venous invasion (yes vs no) | 2.773 (1.742–4.415) | 1.72E−05* | 1.500 (0.772–2.915) | 0.23181158 |
| Lymphatic invasion (yes vs no) | 2.414 (1.522–3.830) | 0.00018109* | 1.219 (0.610–2.436) | 0.57420717 |
Notes.
Abbreviations
- CI
- confidence interval
- HR
- hazard ratio
- lncRNA
- long noncoding RNA
P value refers to the significant level in the χ2 test.
Figure 7. The nomogram for predicting survival probability of COAD patients with 1-, 3- and 5-year OS.
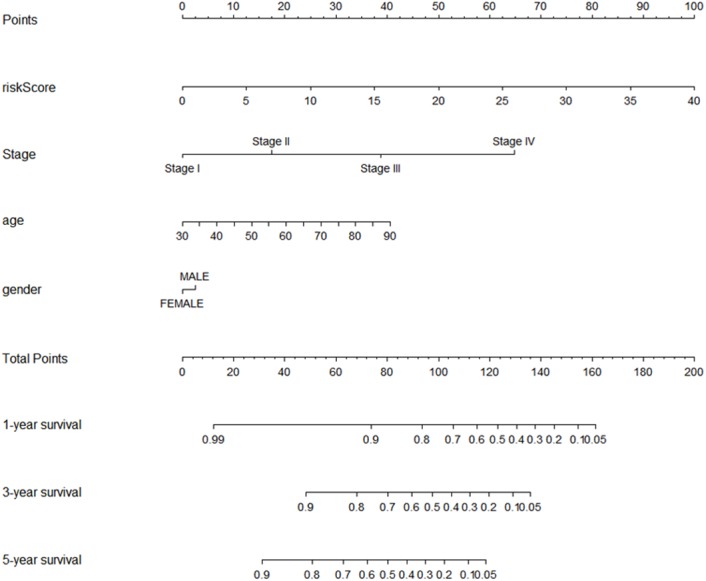
The nomogram is applied by adding up points identified for each variable on the points scale. The total points on the bottom scale indicate the probability of 1-,3- and 5-year OS. COAD, colon adenocarcinoma; OS, overall survival.
Functional annotation of the seven prognostic lncRNAs
To reveal the potential biological functions of the seven prognostic lncRNAs, the co-expression levels between the seven prognostic lncRNAs and mRNAs were detected using PCC. mRNAs with —PCC— >0.3 and p < 0.05 were regarded as mRNAs co-expressed with these lncRNAs. A total of 2012 mRNAs correlated with the seven lncRNAs (Table S3). Extracellular matrix organization, nucleic acid binding, proteinaceous extracellular matrix, collagen catabolic process, and metal ion binding were noticeably upregulated among the GO terms (Fig. 8A). In the KEGG analysis, PI3K/Akt, ECM-receptor interaction, focal adhesion, and AGE-RAGE signaling pathways were significantly upregulated (Fig. 8B).
Figure 8. GO (A) and KEGG pathway (B) analysis of the 7-lncRNA related genes.
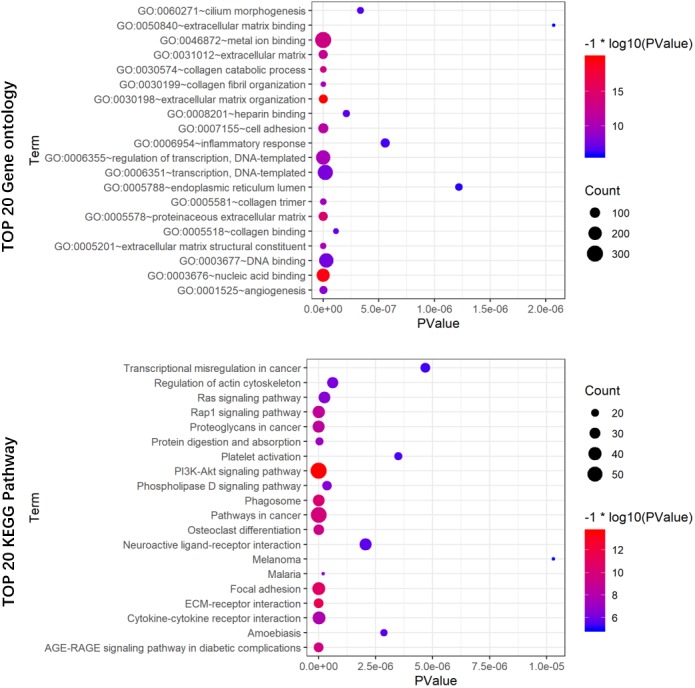
Color represents P value, and the size of the balls shows gene number. GO, Gene ontology, KEGG, Kyoto Encyclopedia of Genes and Genomes; lncRNA, long noncoding RNA.
Discussion
COAD is a malignant tumor with the highest lethality, and its etiology involves genetic alteration, environmental exposures, and fat-rich diet consumption (Hu et al., 2011). Due to the molecular heterogeneity of COAD, the traditional factors (e.g., tumor stage, metastasis, number of lymph nodes involved, tumor size, and age) cannot precisely differentiate related cancer risk subgroups, which have distinct clinical outcomes (Burke, 2004). The prognosis and best treatment for this disease can be credibly classified based on cancer-related molecular makers (Levine, 2013). Accordingly, the prognostic potential of molecular markers has been widely studied recently. For instance, Tan & Tan (2011) constructed a well-known gene signature (ColoPrint®) for the prediction of disease relapse in early-stage colorectal cancer.
Initially, lncRNAs were regarded as “junk DNA” in the genome because they do not encode proteins. In recent studies, lncRNAs have been found to function in DNA methylation, histone modification, and regulation of cell proliferation and differentiation (Li et al., 2014). Accumulating evidence has shown that lncRNAs exhibit restrictive cancer-specific and tissue-specific expression patterns; therefore, the emphasis on the identification of molecular biomarkers has been shifted from mRNA and microRNA to lncRNA (Zhang et al., 2016a; Zhang et al., 2016b). Many studies have investigated the lncRNAs involved in the development, diagnosis, and prognosis of colon cancer. For instance, Sun et al. (2016) found a lncRNA (AK098081) that can serve as an independent risk factor for colon cancer by analysis of GEO datasets (150 cases). Moreover, Li et al. (2017) identified eight novel lncRNAs associated with the prognosis of colon cancer. Nevertheless, it is worth noting that our seven lncRNAs only minimally overlap with colon cancer biomarkers identified by previous studies. Previous studies did not contain different cohorts to validate these prognostic lncRNAs and resulted in inconsistent outcomes, potentially due to the different detection methods and the limited sample size.
In our study, we obtained lncRNA expression profiles of COAD from TCGA database with high-throughput analysis of a larger sample size. Using Cox regression and LASSO analysis, we found seven lncRNAs closely associated with the prognosis of COAD patients and form a 7-lncRNA signature, which was estimated by ROC to demonstrate the competitive predictive power of COAD. LASSO can increase prediction accuracy and avoid overfitting risk of predictive models (Wang et al., 2019). Cox regression analysis is the most effective method in the survival time model (Benner et al., 2010). Moreover, validation and all cohorts were used to validate the signature in different groups. Furthermore, the 7-lncRNA signature was combined with some clinicopathological factors to form a predictive prognosis nomogram, which can suitably differentiate patients with high risk of poor prognosis. COAD patients can be managed hierarchically for better treatment. To the best of our knowledge, the seven lncRNAs have not been previously reported, and this is their first report as prognostic makers of COAD.
In our KEGG and GO analyses, we identified genes, which were co-expressed with these seven lncRNAs and pathways related to these genes including PI3K/Akt, ECM-receptor interaction, focal adhesion, and AGE-RAGE signaling pathways. The main function of the PI3K/Akt signaling pathway is signal transduction, and many studies (Blaser, Chadwick & McGinnis, 2010) have suggested that it is involved in cancer progression. Dysregulated gene expression of the PI3K/Akt signaling pathway in colorectal cancer has been reported by a previous study (Slattery et al., 2018). Several studies have reported that ECM-receptor interaction is significantly associated with cancer (e.g., breast cancer (Wang et al., 2018), hepatocellular carcinoma (Zhang et al., 2017), gastric cancer (Zhao et al., 2015), and bladder cancer (He et al., 2019)). Zhai et al. (2017) using the weighted correlation network analysis, found that colon cancer recurrence-associated genes are associated with ECM-receptor interaction. Focal adhesion is believed to regulate the metastasis of numerous cancers (e.g., colon, gastric, and breast cancers (Cance et al., 2000; Lai et al., 2010; Provenzano & Keely, 2009)). Some researchers discovered that focal adhesion molecule modulation can inhibit colorectal cancer cell invasion (Buhrmann et al., 2017). The AGE-RAGE signaling pathway activates downstream signaling, resulting in pathophysiological conditions, such as diabetes and neurological disorders. However, there may also be a relationship between this signaling pathway and cancer (Ahmad et al., 2018). Moreover, the AGE-RAGE signaling pathway has been found to enhance prostate cancer cell proliferation through retinoblastoma phosphorylation (Bao et al., 2015). However, it is not clear whether these seven lncRNAs interact with the PI3K/Akt, ECM-receptor interaction, focal adhesion, and AGE-RAGE signaling pathways in COAD, because we have no experimental information on the mechanisms associated with these lncRNAs. Therefore, further studies on these lncRNAs are needed to better understand the potential mechanisms between the lncRNAs and COAD.
Conclusions
In conclusion, our study found that seven lncRNAs were significantly associated with prognosis in COAD patients; therefore, the 7-lncRNA signature with some clinicopathological characteristics could be a useful biomarker for the prognosis of COAD.
Supplemental Information
1964 upregulated DElncRNAs and 453 downregulated DElncRNAs.
Abbreviations: lncRNA, long noncoding RNA; mRNA, messenger RNA.
Acknowledgments
The authors thank all the researchers and staff who supported the The Cancer Genome Atlas Research Network.
Funding Statement
This work was supported by National Natural Science Foundation of China (No. 81560397). The funders had no role in study design, data collection and analysis, decision to publish, or preparation of the manuscript.
Additional Information and Declarations
Competing Interests
The authors declare there are no competing interests.
Author Contributions
Xiaorui Fu performed the experiments, analyzed the data, authored or reviewed drafts of the paper, and approved the final draft.
Jinzhong Duanmu performed the experiments, analyzed the data, prepared figures and/or tables, and approved the final draft.
Taiyuan Li analyzed the data, prepared figures and/or tables, authored or reviewed drafts of the paper, and approved the final draft.
Qunguang Jiang conceived and designed the experiments, authored or reviewed drafts of the paper, and approved the final draft.
Data Availability
The following information was supplied regarding data availability:
The raw data is available at Dryad: Jiang, QunGuang; Fu, Xiaorui; Duanmu, Jinzhong; Li, Taiyuan (2019), Dr, v4, Dryad, Dataset, https://doi.org/10.5061/dryad.7pvmcvdpc.
References
- Ahmad et al. (2018).Ahmad S, Khan H, Siddiqui Z, Khan MY, Rehman S, Shahab U, Godovikova T, Silnikov V, Moinuddin AGEs, RAGEs and s-RAGE; friend or foe for cancer. Seminars in Cancer Biology. 2018;49:44–55. doi: 10.1016/j.semcancer.2017.07.001. [DOI] [PubMed] [Google Scholar]
- Banerjee et al. (2017).Banerjee A, Pathak S, Subramanium V, Dharanivasan G, Murugesan R, Verma RS. Strategies for targeted drug delivery in treatment of colon cancer: current trends and future perspectives. Drug Discovery Today. 2017;22:1224–1232. doi: 10.1016/j.drudis.2017.05.006. [DOI] [PubMed] [Google Scholar]
- Bao et al. (2015).Bao J-M, He M-Y, Liu Y-W, Lu Y-J, Hong Y-Q, Luo H-H, Ren Z-L, Zhao S-C, Jiang Y. AGE/RAGE/Akt pathway contributes to prostate cancer cell proliferation by promoting Rb phosphorylation and degradation. American Journal of Cancer Research. 2015;5:1741–1750. [PMC free article] [PubMed] [Google Scholar]
- Benner et al. (2010).Benner A, Zucknick M, Hielscher T, Ittrich C, Mansmann U. High-dimensional cox models: the choice of penalty as part of the model building process. Biometrical Journal. 2010;52:50–69. doi: 10.1002/bimj.200900064. [DOI] [PubMed] [Google Scholar]
- Blaser, Chadwick & McGinnis (2010).Blaser RE, Chadwick L, McGinnis GC. Behavioral measures of anxiety in zebrafish (Danio rerio) Behavioural Brain Research. 2010;208:56–62. doi: 10.1016/j.bbr.2009.11.009. [DOI] [PubMed] [Google Scholar]
- Buhrmann et al. (2017).Buhrmann C, Shayan P, Goel A, Shakibaei M. Resveratrol regulates colorectal cancer cell invasion by modulation of focal adhesion molecules. Nutrients. 2017;9:1073. doi: 10.3390/nu9101073. [DOI] [PMC free article] [PubMed] [Google Scholar]
- Burke (2004).Burke HB. Outcome prediction and the future of the TNM staging system. Journal of the National Cancer Institute. 2004;96:1408–1409. doi: 10.1093/jnci/djh293. [DOI] [PubMed] [Google Scholar]
- Cance et al. (2000).Cance WG, Harris JE, Iacocca MV, Roche E, Yang X, Chang J, Simkins S, Xu L. Immunohistochemical analyses of focal adhesion kinase expression in benign and malignant human breast and colon tissues: correlation with preinvasive and invasive phenotypes. Clinical Cancer Research. 2000;6:2417–2423. [PubMed] [Google Scholar]
- He et al. (2019).He Y, Deng Y, Peng P, Wang N, Wang J, Ding Z, Chen X, Zhou X. A novel messenger RNA and long noncoding RNA signature associated with the progression of nonmuscle invasive bladder cancer. Journal of Cellular Biochemistry. 2019;120:8101–8109. doi: 10.1002/jcb.28089. [DOI] [PubMed] [Google Scholar]
- Hibi et al. (1996).Hibi K, Nakamura H, Hirai A, Fujikake Y, Kasai Y, Akiyama S, Ito K, Takagi H. Loss of H19 imprinting in esophageal cancer. Cancer Research. 1996;56:480–482. [PubMed] [Google Scholar]
- Hu et al. (2011).Hu J, Vecchia CLa, Morrison H, Negri E, Mery L. Salt, processed meat and the risk of cancer. European Journal of Cancer Prevention. 2011;20:132–139. doi: 10.1097/CEJ.0b013e3283429e32. [DOI] [PubMed] [Google Scholar]
- Huang et al. (2019).Huang W, Liu Z, Li Y, Liu L, Mai G. Identification of long noncoding RNAs biomarkers for diagnosis and prognosis in patients with colon adenocarcinoma. Journal of Cellular Biochemistry. 2019;120:4121–4131. doi: 10.1002/jcb.27697. [DOI] [PubMed] [Google Scholar]
- Ji et al. (2003).Ji P, Diederichs S, Wang W, Böing S, Metzger R, Schneider PM, Tidow N, Brandt B, Buerger H, Bulk E, Thomas M, Berdel WE, Serve H, Müller-Tidow C. MALAT-1, a novel noncoding RNA, and thymosin β4 predict metastasis and survival in early-stage non-small cell lung cancer. Oncogene. 2003;22:8031–8041. doi: 10.1038/sj.onc.1206928. [DOI] [PubMed] [Google Scholar]
- Lai et al. (2010).Lai I-R, Chu P-Y, Lin H-S, Liou J-Y, Jan Y-J, Lee J-C, Shen T-L. Phosphorylation of focal adhesion kinase at Tyr397 in gastric carcinomas and its clinical significance. American Journal of Pathology. 2010;177:1629–1637. doi: 10.2353/ajpath.2010.100172. [DOI] [PMC free article] [PubMed] [Google Scholar]
- Lee et al. (2014).Lee H, Choi DW, Cho YB, Yun SH, Kim HC, Lee WY, Heo JS, Choi SH, Jung KU, Chun H-K. Recurrence pattern depends on the location of colon cancer in the patients with synchronous colorectal liver metastasis. Annals of Surgical Oncology. 2014;21:1641–1646. doi: 10.1245/s10434-013-3477-5. [DOI] [PubMed] [Google Scholar]
- Levine (2013).Levine DA. Integrated genomic characterization of endometrial carcinoma. Nature. 2013;497:67–73. doi: 10.1038/nature12113. [DOI] [PMC free article] [PubMed] [Google Scholar]
- Li et al. (2014).Li L, Eichten SR, Shimizu R, Petsch K, Yeh C-T, Wu W, Chettoor AM, Givan SA, Cole RA, Fowler JE, Evans MMS, Scanlon MJ, Yu J, Schnable PS, Timmermans MCP, Springer NM, Muehlbauer GJ. Genome-wide discovery and characterization of maize long non-coding RNAs. Genome Biology. 2014;15:R40. doi: 10.1186/gb-2014-15-2-r40. [DOI] [PMC free article] [PubMed] [Google Scholar]
- Li et al. (2017).Li J, Xue W, Lv J, Han P, Liu Y, Cui B. Identification of potential long non-coding RNA biomarkers associated with the progression of colon cancer. Oncotarget. 2017;8:75834–75843. doi: 10.18632/oncotarget.17924. [DOI] [PMC free article] [PubMed] [Google Scholar]
- Mercer, Dinger & Mattick (2009).Mercer TR, Dinger ME, Mattick JS. Long non-coding RNAs: insights into functions. Nature Reviews Genetics. 2009;10:155–159. doi: 10.1038/nrg2521. [DOI] [PubMed] [Google Scholar]
- Ogata et al. (1999).Ogata H, Goto S, Sato K, Fujibuchi W, Bono H, Kanehisa M. KEGG: kyoto encyclopedia of genes and genomes. Nucleic Acids Research. 1999;27:29–34. doi: 10.1093/nar/27.1.29. [DOI] [PMC free article] [PubMed] [Google Scholar]
- Ponting, Oliver & Reik (2009).Ponting CP, Oliver PL, Reik W. Evolution and functions of long noncoding RNAs. Cell. 2009;136:629–641. doi: 10.1016/j.cell.2009.02.006. [DOI] [PubMed] [Google Scholar]
- Provenzano & Keely (2009).Provenzano PP, Keely PJ. The role of focal adhesion kinase in tumor initiation and progression. Cell Adhesion & Migration. 2009;3:347–350. doi: 10.4161/cam.3.4.9458. [DOI] [PMC free article] [PubMed] [Google Scholar]
- Quinn & Chang (2016).Quinn JJ, Chang HY. Unique features of long non-coding RNA biogenesis and function. Nature Reviews Genetics. 2016;17:47–62. doi: 10.1038/nrg.2015.10. [DOI] [PubMed] [Google Scholar]
- Siegel et al. (2017).Siegel RL, Miller KD, Fedewa SA, Ahnen DJ, Meester RGS, Barzi A, Jemal A. Colorectal cancer statistics, 2017. CA: A Cancer Journal for Clinicians. 2017;67:177–193. doi: 10.3322/caac.21395. [DOI] [PubMed] [Google Scholar]
- Slattery et al. (2018).Slattery ML, Mullany LE, Sakoda LC, Wolff RK, Stevens JR, Samowitz WS, Herrick JS. The PI3K/AKT signaling pathway: associations of miRNAs with dysregulated gene expression in colorectal cancer. Molecular Carcinogenesis. 2018;57:243–261. doi: 10.1002/mc.22752. [DOI] [PMC free article] [PubMed] [Google Scholar]
- Sun et al. (2016).Sun X, Hu Y, Zhang L, Hu C, Guo G, Mao C, Xu J, Ye S, Huang G, Xue X, Guo A, Shen X. Mining, validation, and clinical significance of colorectal cancer (CRC)-associated lncRNAs. PLOS ONE. 2016;11:e0164590. doi: 10.1371/journal.pone.0164590. [DOI] [PMC free article] [PubMed] [Google Scholar]
- Tan & Tan (2011).Tan IB, Tan P. An 18-gene signature (ColoPrint®) for colon cancer prognosis. Nature Reviews Clinical Oncology. 2011;8:131–133. doi: 10.1038/nrclinonc.2010.229. [DOI] [PubMed] [Google Scholar]
- Torre et al. (2016).Torre LA, Siegel RL, Ward EM, Jemal A. Global cancer incidence and mortality rates and trends–an update. Cancer Epidemiology, Biomarkers & Prevention. 2016;25:16–27. doi: 10.1158/1055-9965.EPI-15-0578. [DOI] [PubMed] [Google Scholar]
- Wang et al. (2019).Wang H, Lengerich BJ, Aragam B, Xing EP. Precision Lasso: accounting for correlations and linear dependencies in high-dimensional genomic data. Bioinformatics. 2019;35:1181–1187. doi: 10.1093/bioinformatics/bty750. [DOI] [PMC free article] [PubMed] [Google Scholar]
- Wang et al. (2018).Wang Y, Xu H, Zhu B, Qiu Z, Lin Z. Systematic identification of the key candidate genes in breast cancer stroma. Cellular & Molecular Biology Letters. 2018;23:44. doi: 10.1186/s11658-018-0110-4. [DOI] [PMC free article] [PubMed] [Google Scholar]
- Zhai et al. (2017).Zhai X, Xue Q, Liu Q, Guo Y, Chen Z. Colon cancer recurrence-associated genes revealed by WGCNA co-expression network analysis. Molecular Medicine Reports. 2017;16:6499–6505. doi: 10.3892/mmr.2017.7412. [DOI] [PMC free article] [PubMed] [Google Scholar]
- Zhang et al. (2017).Zhang C, Peng L, Zhang Y, Liu Z, Li W, Chen S, Li G. The identification of key genes and pathways in hepatocellular carcinoma by bioinformatics analysis of high-throughput data. Medical Oncology. 2017;34:101. doi: 10.1007/s12032-017-0963-9. [DOI] [PMC free article] [PubMed] [Google Scholar]
- Zhang et al. (2016a).Zhang F, Ren C, Lau KK, Zheng Z, Lu G, Yi Z, Zhao Y, Su F, Zhang S, Zhang B, Sobie EA, Zhang W, Walsh MJ. A network medicine approach to build a comprehensive atlas for the prognosis of human cancer. Briefings in Bioinformatics. 2016a;17:1044–1059. doi: 10.1093/bib/bbw076. [DOI] [PMC free article] [PubMed] [Google Scholar]
- Zhang et al. (2016b).Zhang F, Ren C, Zhao H, Yang L, Su F, Zhou M-M, Han J, Sobie EA, Walsh MJ. Identification of novel prognostic indicators for triple-negative breast cancer patients through integrative analysis of cancer genomics data and protein interactome data. Oncotarget. 2016b;7:71620–71634. doi: 10.18632/oncotarget.12287. [DOI] [PMC free article] [PubMed] [Google Scholar]
- Zhao et al. (2015).Zhao Z, Song Y, Piao D, Liu T, Zhao L. Identification of genes and long non-coding RNAs associated with the pathogenesis of gastric cancer. Oncology Reports. 2015;34:1301–1310. doi: 10.3892/or.2015.4129. [DOI] [PubMed] [Google Scholar]
Associated Data
This section collects any data citations, data availability statements, or supplementary materials included in this article.
Supplementary Materials
1964 upregulated DElncRNAs and 453 downregulated DElncRNAs.
Abbreviations: lncRNA, long noncoding RNA; mRNA, messenger RNA.
Data Availability Statement
The following information was supplied regarding data availability:
The raw data is available at Dryad: Jiang, QunGuang; Fu, Xiaorui; Duanmu, Jinzhong; Li, Taiyuan (2019), Dr, v4, Dryad, Dataset, https://doi.org/10.5061/dryad.7pvmcvdpc.


